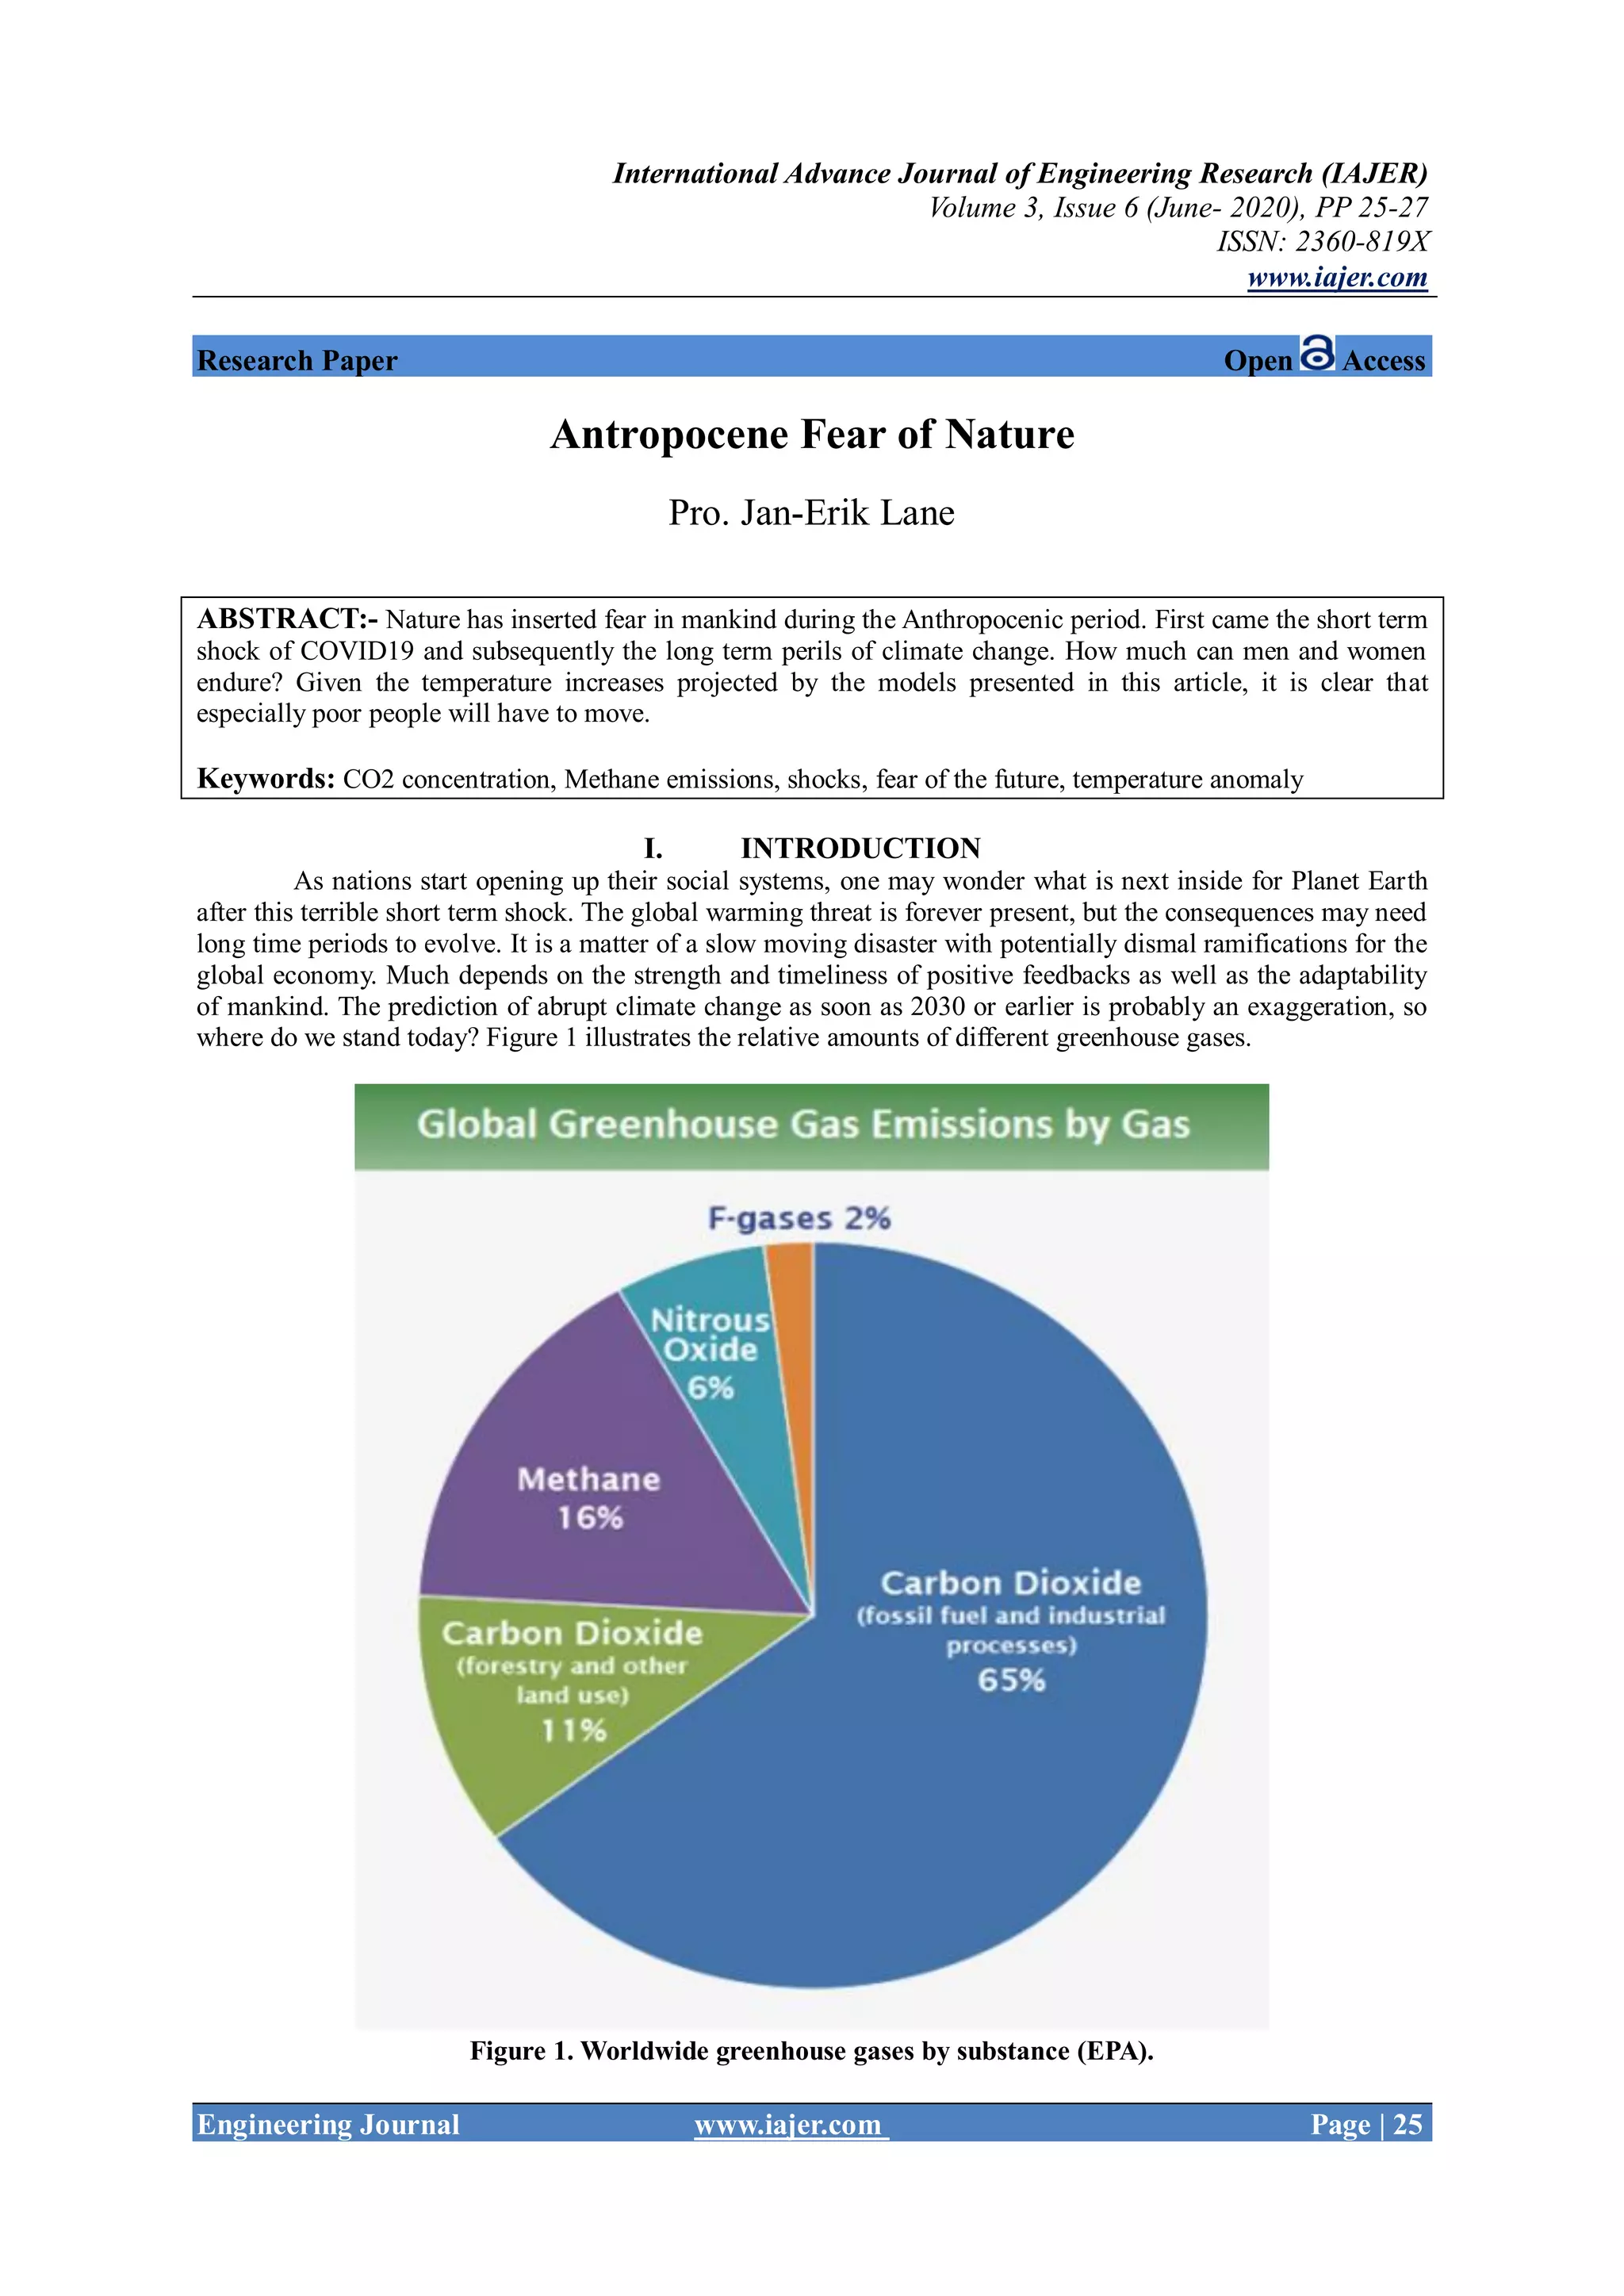
International Advance Journal of Engineering Research (IAJER)
Volume 3, Issue 6 (June- 2020), PP 25-27
ISSN: 2360-819X
www.iajer.com
Engineering Journal www.iajer.com Page | 25
Research Paper Open Access
Antropocene Fear of Nature
Pro. Jan-Erik Lane
ABSTRACT:- Nature has inserted fear in mankind during the Anthropocenic period. First came the short term
shock of COVID19 and subsequently the long term perils of climate change. How much can men and women
endure? Given the temperature increases projected by the models presented in this article, it is clear that
especially poor people will have to move.
Keywords: CO2 concentration, Methane emissions, shocks, fear of the future, temperature anomaly
I. INTRODUCTION
As nations start opening up their social systems, one may wonder what is next inside for Planet Earth
after this terrible short term shock. The global warming threat is forever present, but the consequences may need
long time periods to evolve. It is a matter of a slow moving disaster with potentially dismal ramifications for the
global economy. Much depends on the strength and timeliness of positive feedbacks as well as the adaptability
of mankind. The prediction of abrupt climate change as soon as 2030 or earlier is probably an exaggeration, so
where do we stand today? Figure 1 illustrates the relative amounts of different greenhouse gases.
Figure 1. Worldwide greenhouse gases by substance (EPA).
Antropocene Fear Of Nature
Engineering Journal www.iajer.com Page | 26
As CO2(Carbon Dioxide) and CH4 (Methane) constitute the bulk of worldwide GHG emissions, we will
concentrate on finding models for their numbers. The omnipresence of CO2 and CH4. The baseline facts about
carbon dioxide and methane can be stated in a simple chart, depicting developments after the Second World
War.
Figure 2: CO2 and CH4 concentration (Sealevel).
CO2 Concentration
It should be considered somewhat surprising that the Keeling curve has risen also during the COVID
19 pandemic, reaching a value of 418 ppm (). However, it should be remembered that greenhouse gases
originate from various human activities and all of them have not been shut down. There is an ongoing revolution
in transportation with the coming of EV (Electrical Vehicles), but the majority of the world’s population can still
not afford this expensive mode of transport. Moreover, housing, heating, electricity and agriculture continue,
emitting CO2. Figure 3 shows greenhouse gases divided by sector.
The impact of carbon dioxide is primarily an increase in temperature, indirectly causing a number of
outcomes, and reinforcing global warming by means of positive feedback loops. Over time, the relationship
between CO2 concentration in the atmosphere and temperature increase can be modeled as a linear function as
follows:
Temperature Increase / degrees C=-3.3 + 0.0103*CO2/ppm (1)
Given the current level of CO2 of 418 ppm, global surface temperature has increased by 1 degree C. If and
when we reach 500 ppm, the temperature rise would according to the model become higher than the 1.5 degree
max target of the 2015 Paris agreement (1.8 degrees). The abrupt theory of climate change implies that we will
reach 500 ppm as soon as within ten years. Yet, global warming is a slow process, albeit Hawking irreversible.
Methane Emissions
When emissions of CH4 are added to the global warming picture, things become even worse. Methane
emissions originate almost exclusively from agriculture and natural gas production.
Antropocene Fear Of Nature
Engineering Journal www.iajer.com Page | 27
Figure 3. 2017 Worldwide Greenhouse gas emissions by gas and sector (PBL).
In the future, CH4 may come from the tundra where the permafrost is now thawing. This trend is
extremely dangerous and volatile, as the amount of carbon stored in the Northern Hemisphere underneath the
permafrost is excessively huge. When we model the relationship between CH4 and temperature increase, we get
the following linear regression line:
Temperature increase / degrees C=-1.16 + 0.00094*CH4 concentration / ppb (2)
Given current levels at 1900, we would get a temperature rise of 0.6 degrees C.
II. CONCLUSION
Apparently, increases in temperature in the Anthropogenic period have reached a value of 1 degree
Celsius, caused by emissions of both CO2 and CH4. Carbon dioxide seem to be more important than CH4 as of
now, but that my change in the coming decade. When global warming passes 2 degrees, a number of tipping
points will be triggered. Nobody knows how large temperature increase mankind can support in different parts
of the world. People will migrate.
REFERENCES
[1]. Environmental Protection Agency (EPA): Global Greenhouse Gas Emissions Data: Global Emissions
by Gas. https://www.epa.gov/ghgemissions/global-greenhouse-gas-emissions-data .
[2]. Olivier, J.G.J., Schure, K.M., and Peters, J.A.H.W (PBL): Trends in Global CO2 and Total Greenhouse
Gas Emissions – 2017 Report. PBL Netherlands Environmental Assessment Agency, The Hague,
Netherlands, 2017.
[3]. Burton, David A (Sealevel): CO2 and CH4 since 1800. http://sealevel.info/co2_and_ch4.html

C362527

  • 1.
    International Advance Journalof Engineering Research (IAJER) Volume 3, Issue 6 (June- 2020), PP 25-27 ISSN: 2360-819X www.iajer.com Engineering Journal www.iajer.com Page | 25 Research Paper Open Access Antropocene Fear of Nature Pro. Jan-Erik Lane ABSTRACT:- Nature has inserted fear in mankind during the Anthropocenic period. First came the short term shock of COVID19 and subsequently the long term perils of climate change. How much can men and women endure? Given the temperature increases projected by the models presented in this article, it is clear that especially poor people will have to move. Keywords: CO2 concentration, Methane emissions, shocks, fear of the future, temperature anomaly I. INTRODUCTION As nations start opening up their social systems, one may wonder what is next inside for Planet Earth after this terrible short term shock. The global warming threat is forever present, but the consequences may need long time periods to evolve. It is a matter of a slow moving disaster with potentially dismal ramifications for the global economy. Much depends on the strength and timeliness of positive feedbacks as well as the adaptability of mankind. The prediction of abrupt climate change as soon as 2030 or earlier is probably an exaggeration, so where do we stand today? Figure 1 illustrates the relative amounts of different greenhouse gases. Figure 1. Worldwide greenhouse gases by substance (EPA).
  • 2.
    Antropocene Fear OfNature Engineering Journal www.iajer.com Page | 26 As CO2(Carbon Dioxide) and CH4 (Methane) constitute the bulk of worldwide GHG emissions, we will concentrate on finding models for their numbers. The omnipresence of CO2 and CH4. The baseline facts about carbon dioxide and methane can be stated in a simple chart, depicting developments after the Second World War. Figure 2: CO2 and CH4 concentration (Sealevel). CO2 Concentration It should be considered somewhat surprising that the Keeling curve has risen also during the COVID 19 pandemic, reaching a value of 418 ppm (). However, it should be remembered that greenhouse gases originate from various human activities and all of them have not been shut down. There is an ongoing revolution in transportation with the coming of EV (Electrical Vehicles), but the majority of the world’s population can still not afford this expensive mode of transport. Moreover, housing, heating, electricity and agriculture continue, emitting CO2. Figure 3 shows greenhouse gases divided by sector. The impact of carbon dioxide is primarily an increase in temperature, indirectly causing a number of outcomes, and reinforcing global warming by means of positive feedback loops. Over time, the relationship between CO2 concentration in the atmosphere and temperature increase can be modeled as a linear function as follows: Temperature Increase / degrees C=-3.3 + 0.0103*CO2/ppm (1) Given the current level of CO2 of 418 ppm, global surface temperature has increased by 1 degree C. If and when we reach 500 ppm, the temperature rise would according to the model become higher than the 1.5 degree max target of the 2015 Paris agreement (1.8 degrees). The abrupt theory of climate change implies that we will reach 500 ppm as soon as within ten years. Yet, global warming is a slow process, albeit Hawking irreversible. Methane Emissions When emissions of CH4 are added to the global warming picture, things become even worse. Methane emissions originate almost exclusively from agriculture and natural gas production.
  • 3.
    Antropocene Fear OfNature Engineering Journal www.iajer.com Page | 27 Figure 3. 2017 Worldwide Greenhouse gas emissions by gas and sector (PBL). In the future, CH4 may come from the tundra where the permafrost is now thawing. This trend is extremely dangerous and volatile, as the amount of carbon stored in the Northern Hemisphere underneath the permafrost is excessively huge. When we model the relationship between CH4 and temperature increase, we get the following linear regression line: Temperature increase / degrees C=-1.16 + 0.00094*CH4 concentration / ppb (2) Given current levels at 1900, we would get a temperature rise of 0.6 degrees C. II. CONCLUSION Apparently, increases in temperature in the Anthropogenic period have reached a value of 1 degree Celsius, caused by emissions of both CO2 and CH4. Carbon dioxide seem to be more important than CH4 as of now, but that my change in the coming decade. When global warming passes 2 degrees, a number of tipping points will be triggered. Nobody knows how large temperature increase mankind can support in different parts of the world. People will migrate. REFERENCES [1]. Environmental Protection Agency (EPA): Global Greenhouse Gas Emissions Data: Global Emissions by Gas. https://www.epa.gov/ghgemissions/global-greenhouse-gas-emissions-data . [2]. Olivier, J.G.J., Schure, K.M., and Peters, J.A.H.W (PBL): Trends in Global CO2 and Total Greenhouse Gas Emissions – 2017 Report. PBL Netherlands Environmental Assessment Agency, The Hague, Netherlands, 2017. [3]. Burton, David A (Sealevel): CO2 and CH4 since 1800. http://sealevel.info/co2_and_ch4.html