The integrated use of audio frequency telluric and electrical resistivity tomography methods provides an efficient approach for groundwater exploration in karst areas with or without thin cover. Two case studies from Tai'an City, China are presented:
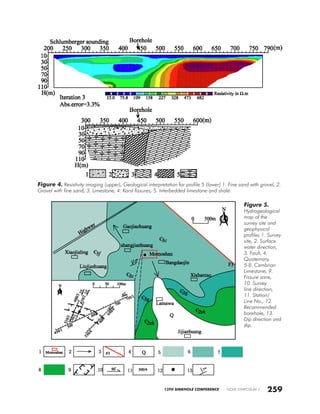
1) In the first case, audio frequency telluric profiling identified lower potential anomalies indicating water-filled karst zones. Electrical resistivity tomography lines perpendicular to these anomalies revealed vertical variations in resistivity, locating karst fractures and caves for well drilling.
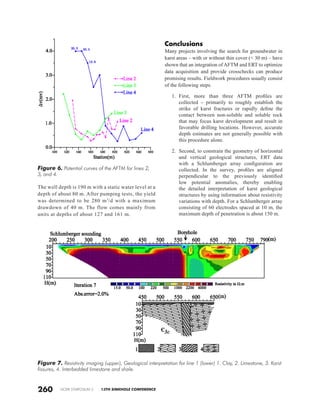
2) The second case similarly used audio frequency telluric to constrain the orientation of water-bearing zones, then electrical resistivity tomography along this strike. Lower resistivity anomalies indicated favorable zones for locating a productive well.