![A Wave-to-Wire Model of Ocean
Wave Energy Conversion System
Using MATLAB/Simulink
Platform
4th International Conference on Development
of Renewable Energy Technology
[ICDRET 2016]
AUTHORS
Jakir Hossain, B.Sc in EEE, KUET
Eklas Hossain, PhD Candidate, UWM, USA
Sarder Shazali Sikander, M.Sc in EE, NUST, Pakistan](https://image.slidesharecdn.com/wavepaperpresentation-160301075045/75/A-wave-to-wire-model-of-ocean-wave-energy-conversion-system-using-MATLAB-Simulink-platform-1-2048.jpg)
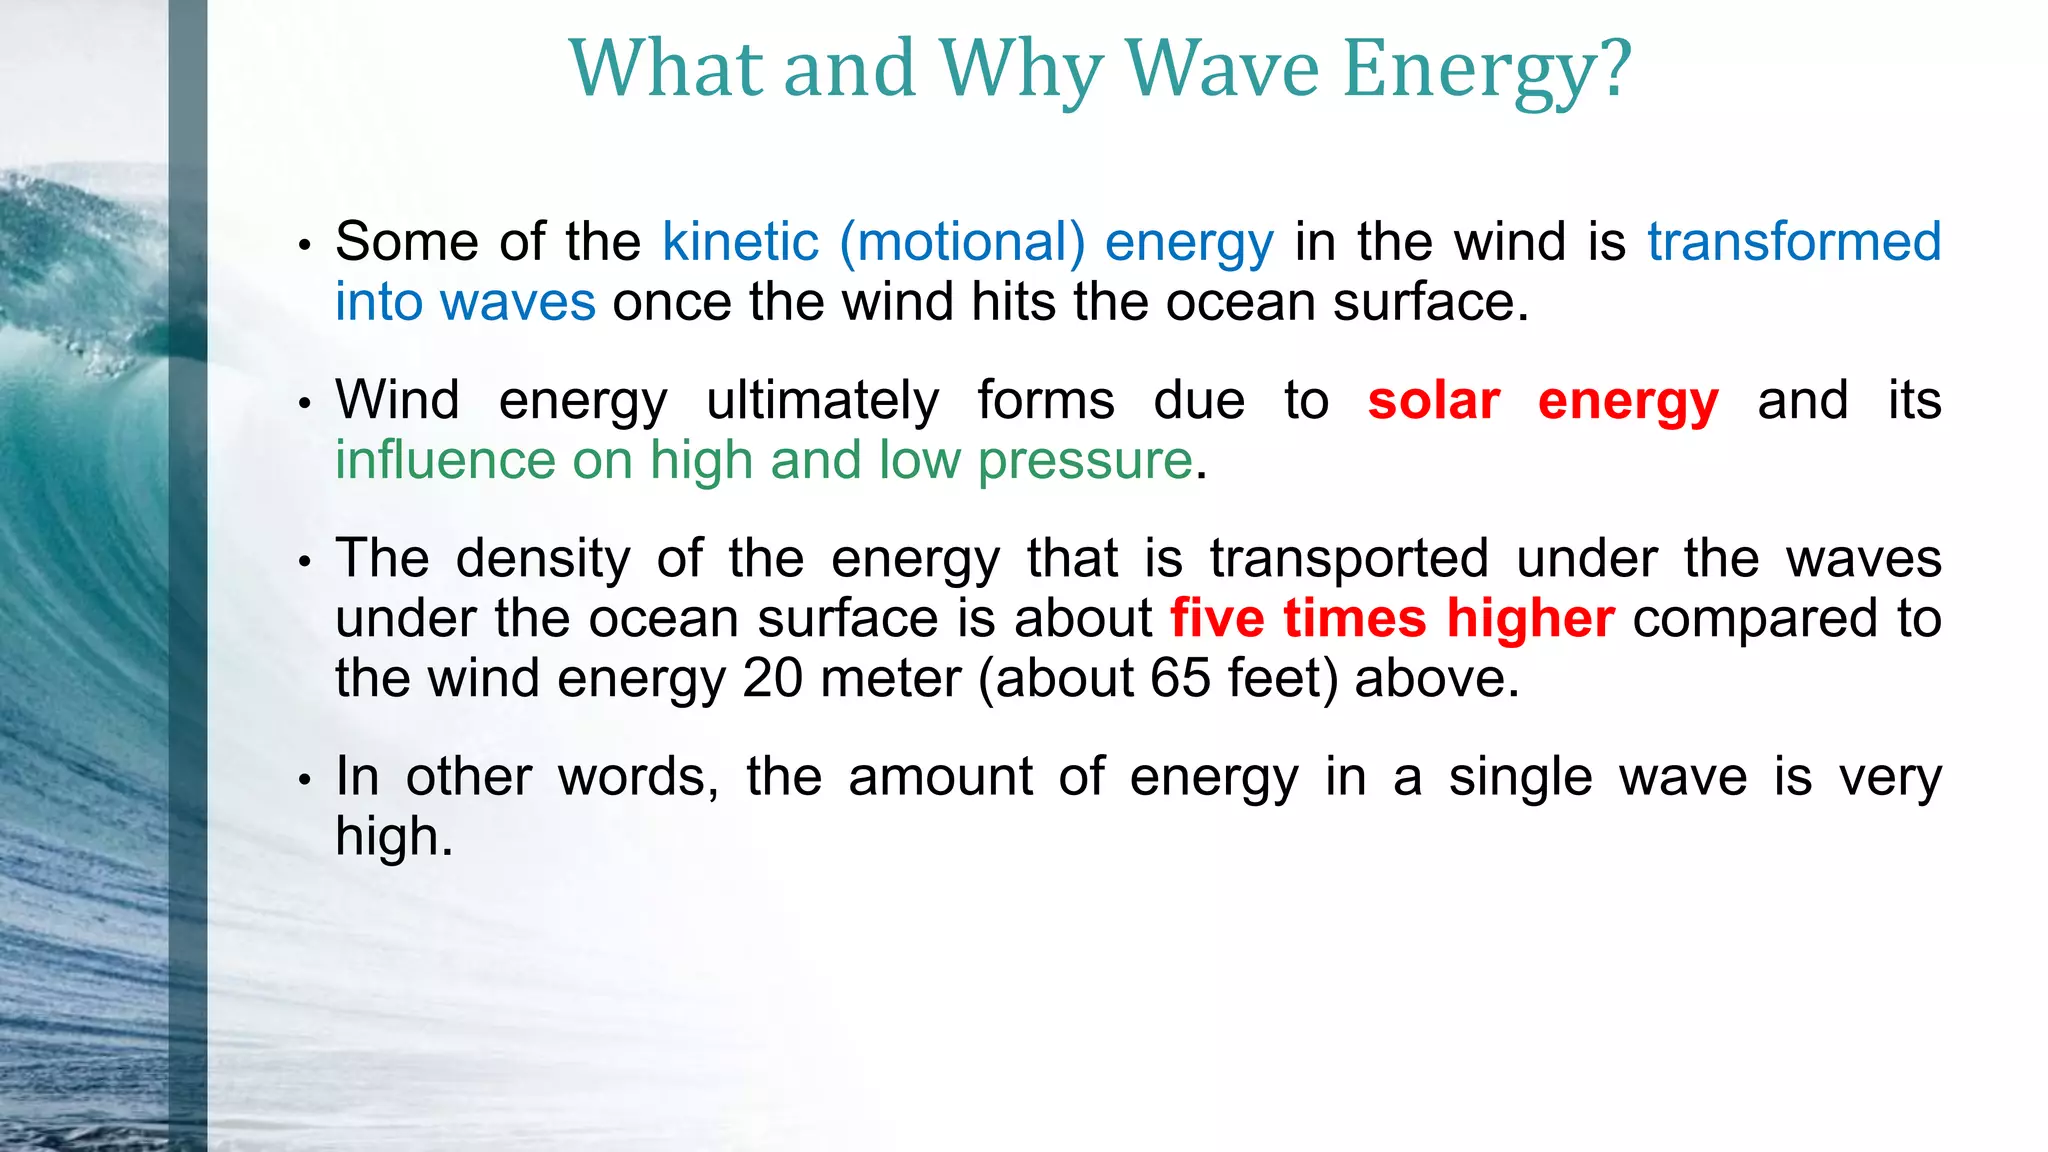
![Wave Energy vs. Other Renewable Sources
Photovoltaic Wind Wave
Status Early commercial Commercial Pre-commercial
Energy Source Sun Sun Sun-Wind
Power Density 1 kW/m2 at peak
solar insolation
1 kW/m2 at 12
m/s [General
Electric (GE) 1.5
MW machine]
25 kW/m at Sun
Francisco, average
annual power flux
Variability Daily cycles-clouds When it blows 24×7 and highly
variable
Predictability Poor Hours Daily
Availability 20-30% 30-40% 80-90%
Potential Sites Limited Limited Extensive but
limited
Average Power
Output per Plant
Scalable to 5 MW Scalable to 30
MW
Scalable to 100+
MW [Provides
Highest energy
density]
Environmental
issues
Visual Pollution Noise and Visual
Pollution
None [Virtually no
environmental
impacts]
80% to 90%
Availability
Scalable to
100+ MW
Environmentally
Zero Impacts
Daily
Predictability](https://image.slidesharecdn.com/wavepaperpresentation-160301075045/75/A-wave-to-wire-model-of-ocean-wave-energy-conversion-system-using-MATLAB-Simulink-platform-4-2048.jpg)
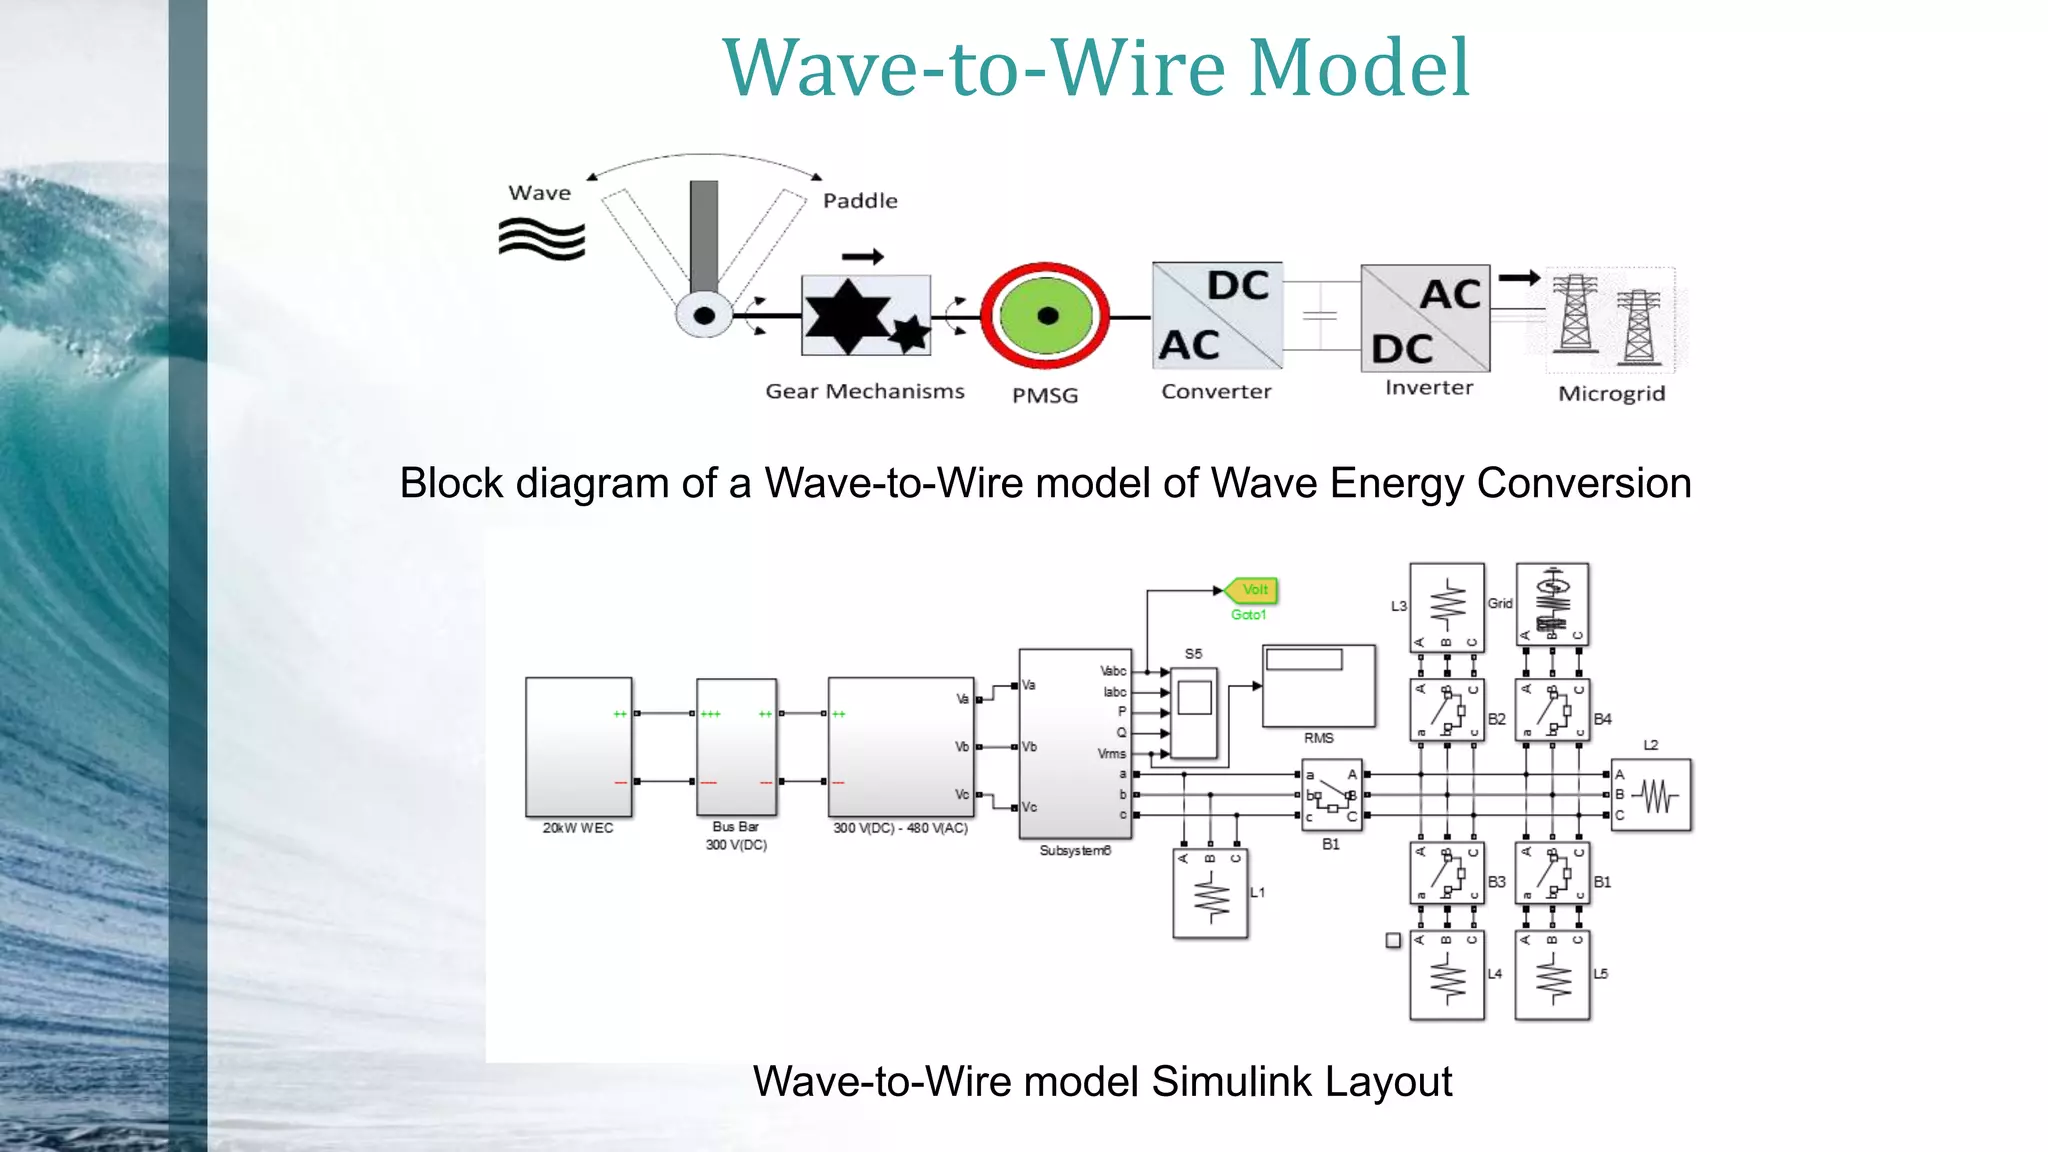
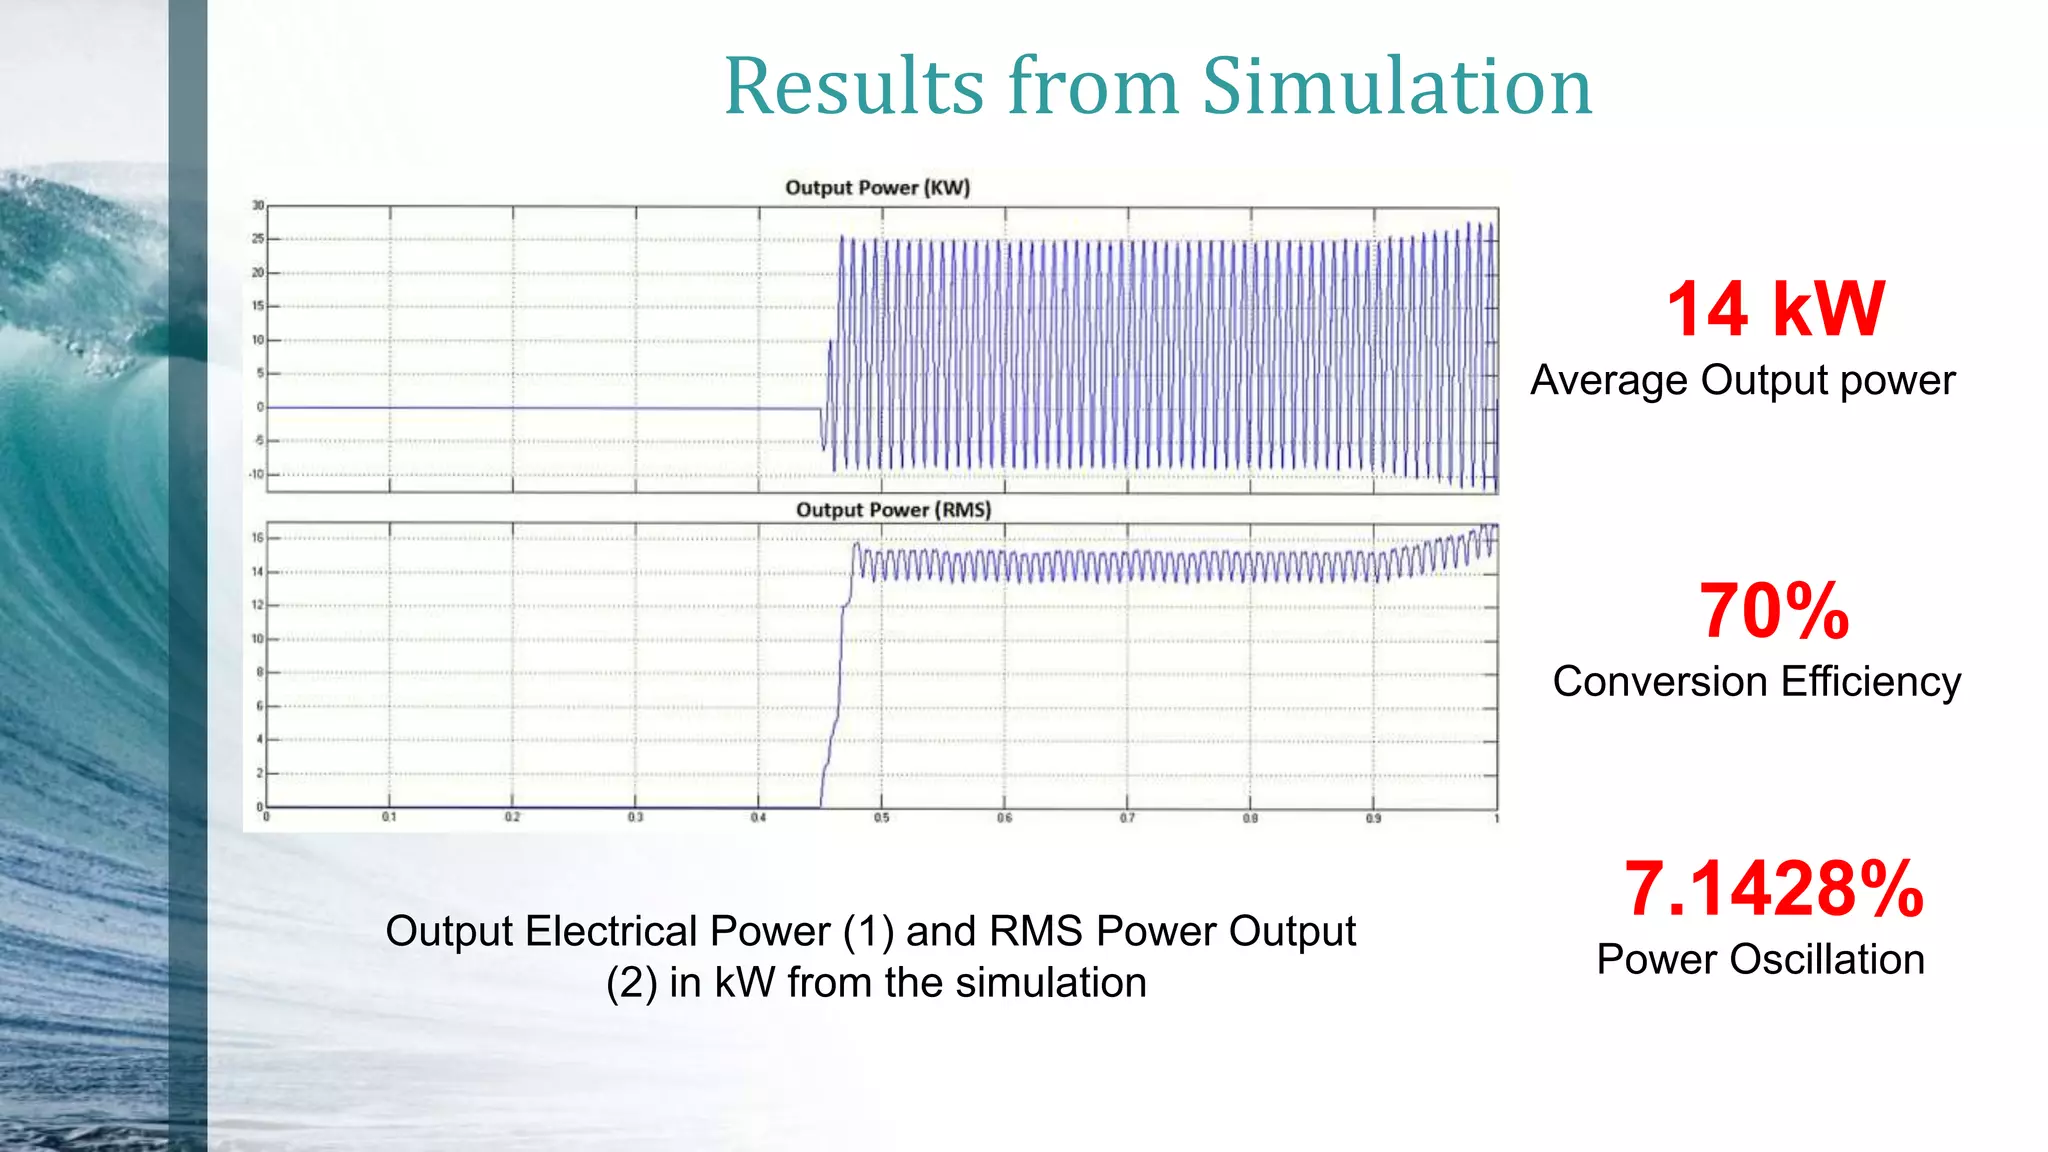

The document presents a wave-to-wire model for ocean wave energy conversion using MATLAB/Simulink, detailing wave energy's advantages over other renewable sources, the global potential of wave power, and various harnessing techniques. It analyzes simulation results indicating an average output power of 14 kW with a conversion efficiency of 70%, while addressing challenges such as device vulnerability to environmental forces and maintenance costs. The conclusion emphasizes the significant untapped potential of wave energy, alongside its environmental benefits and the feasibility of developing technology in regions like Bangladesh.


