Download as PDF, PPTX
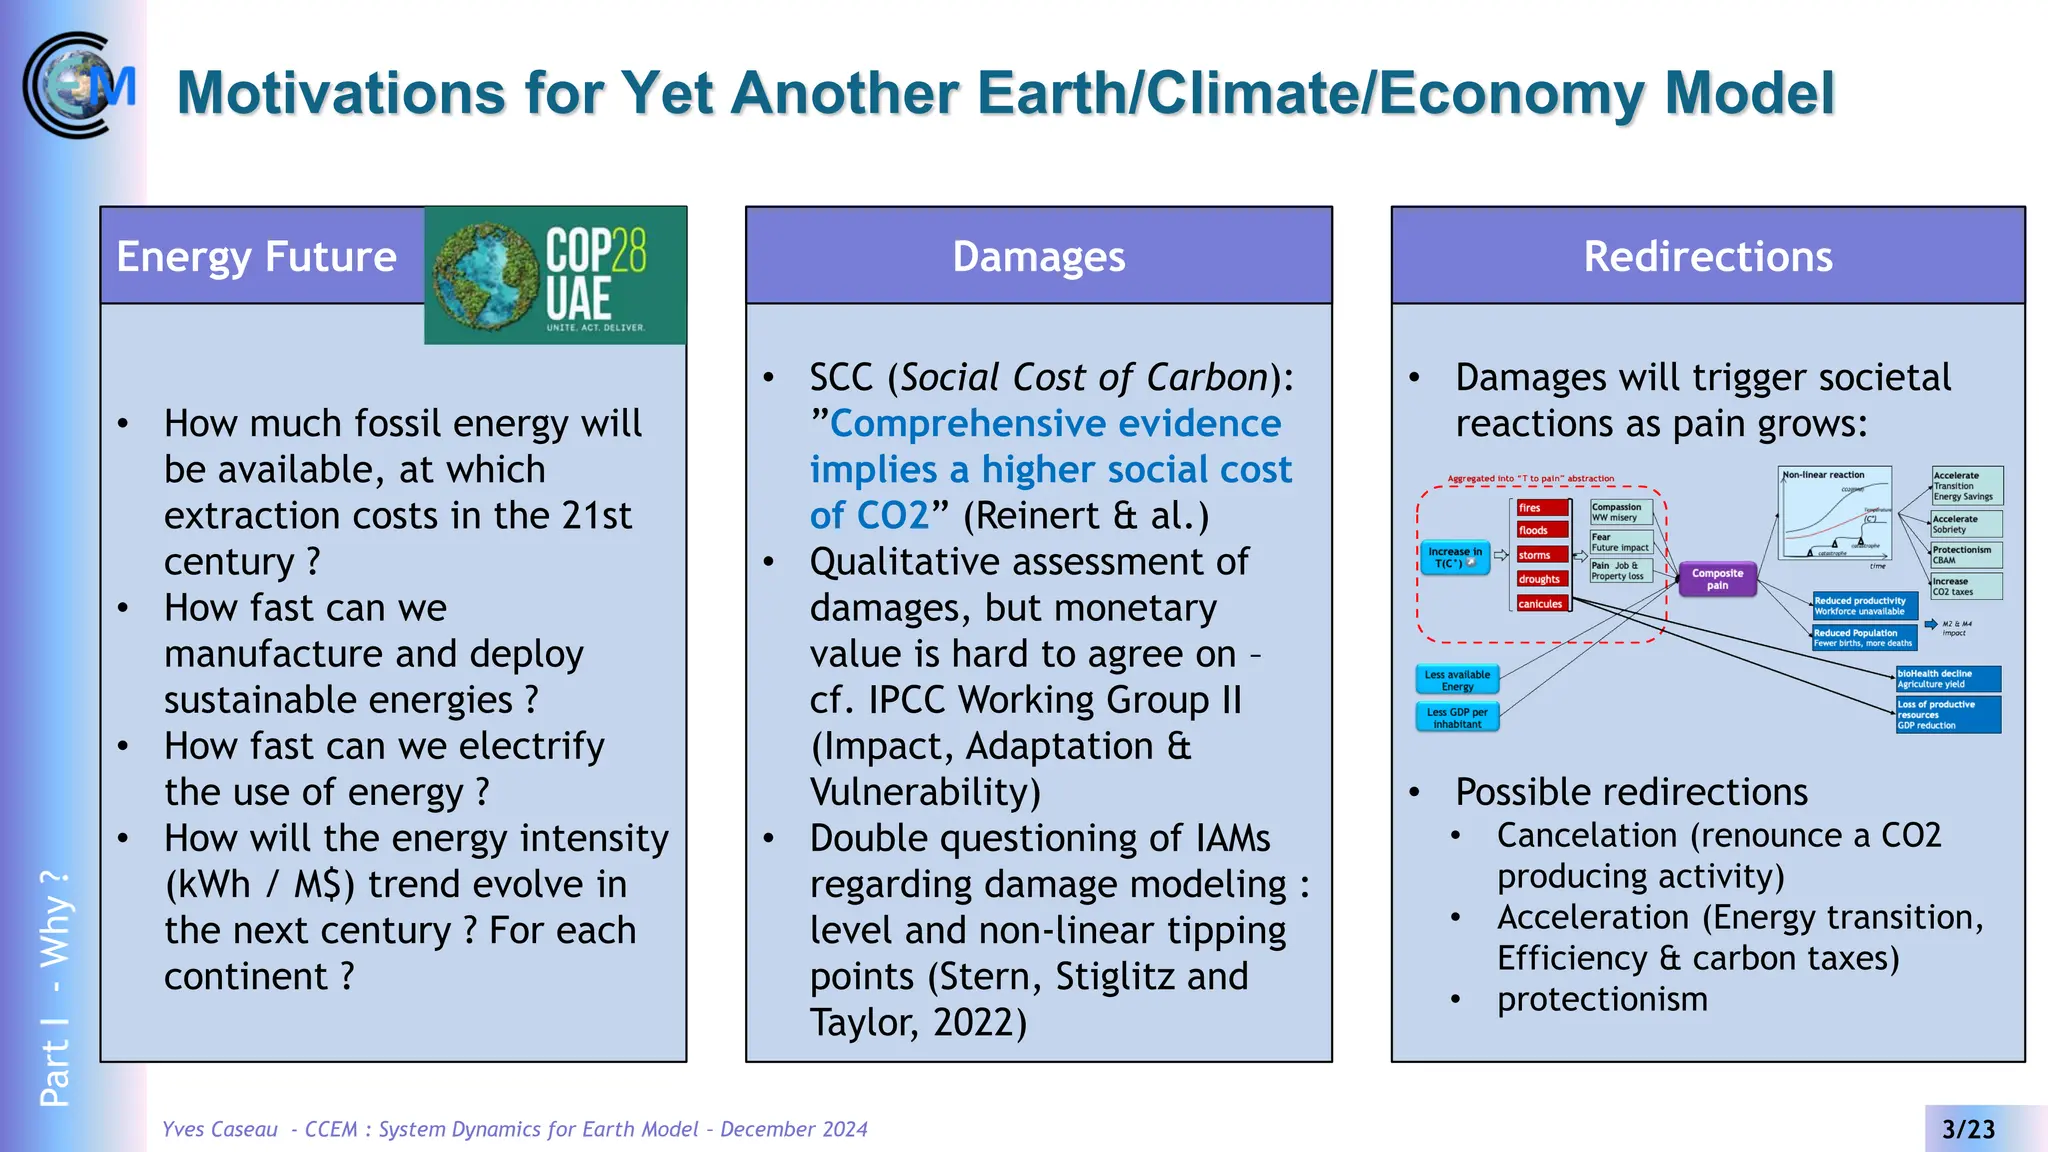
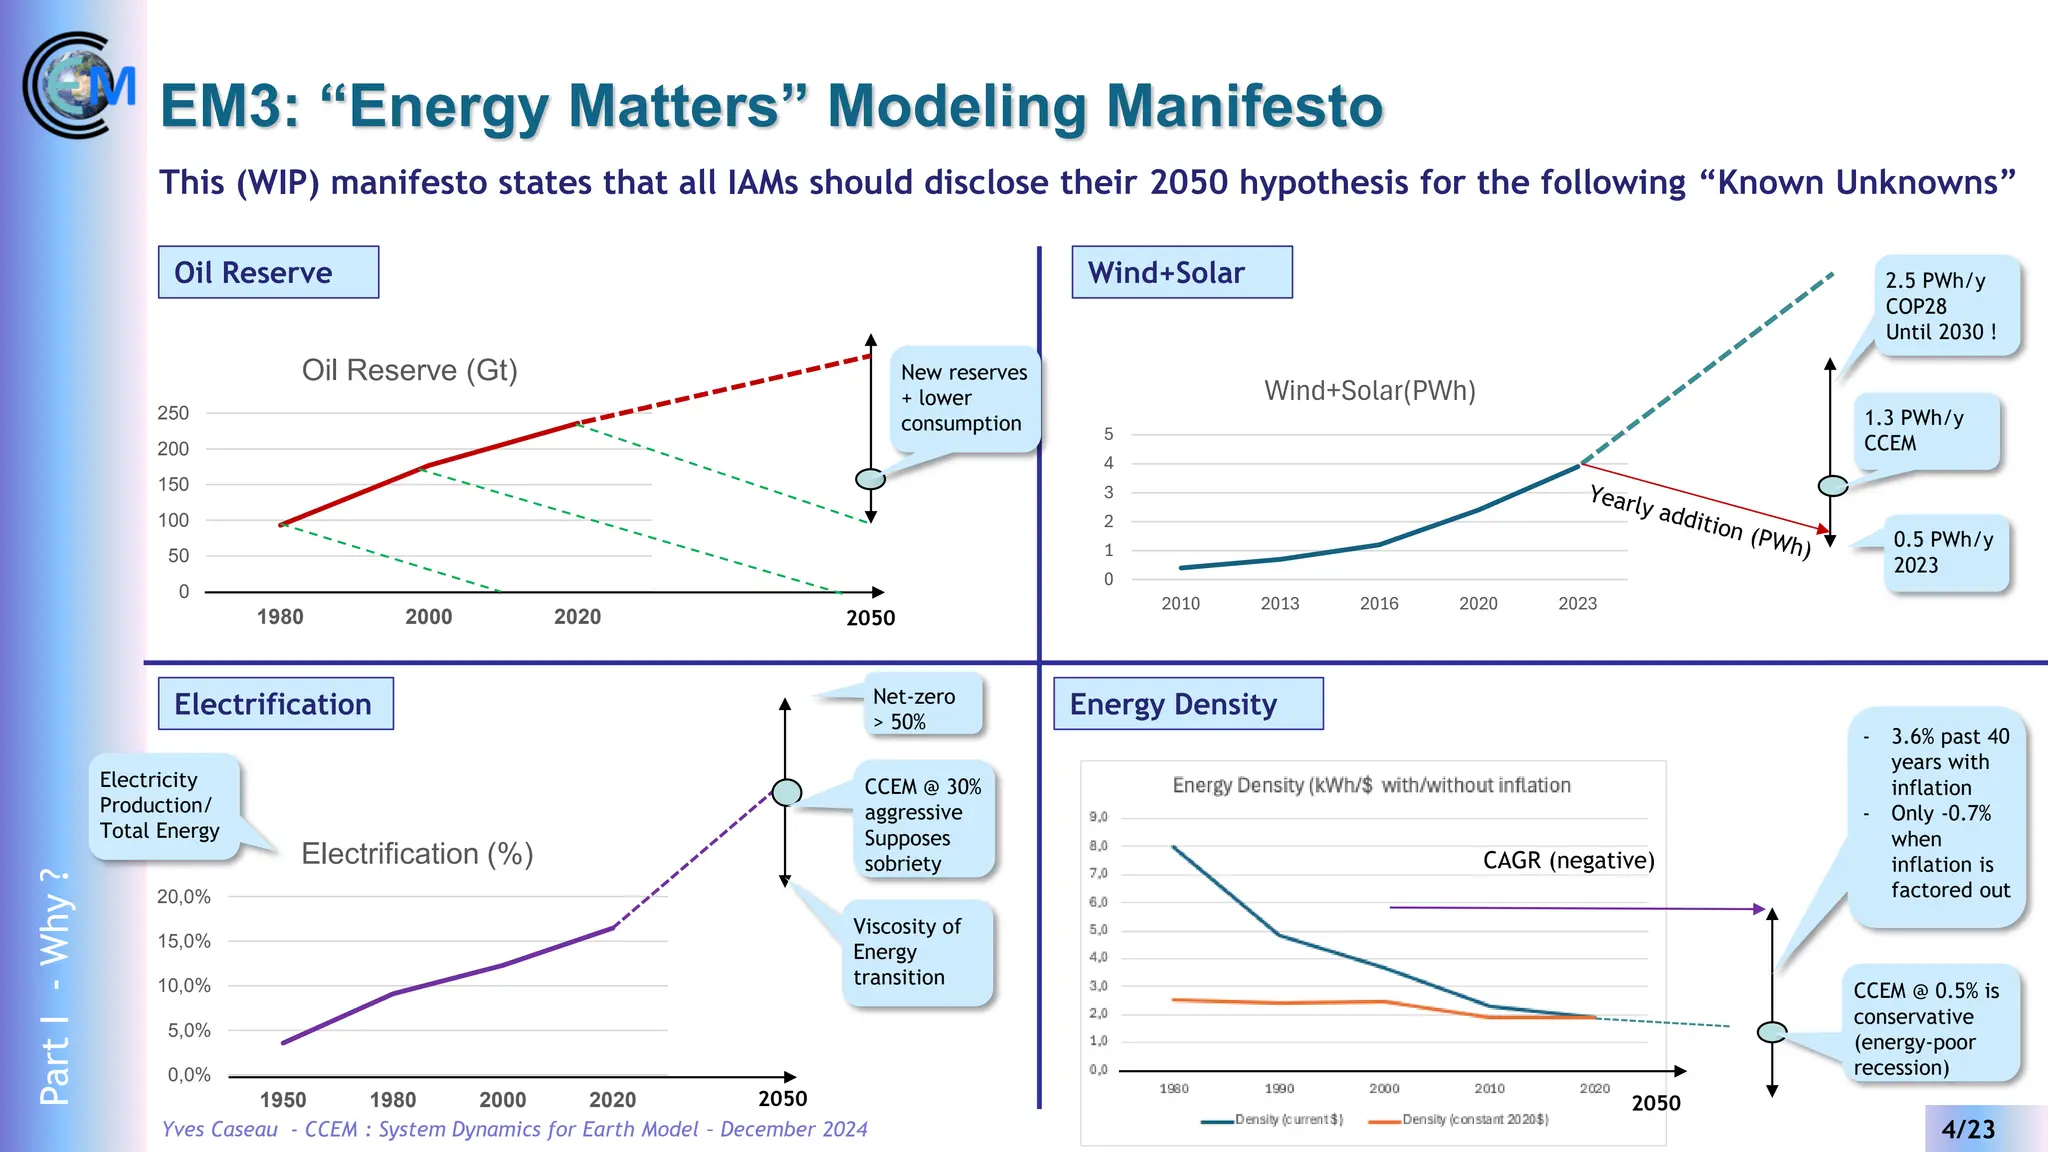
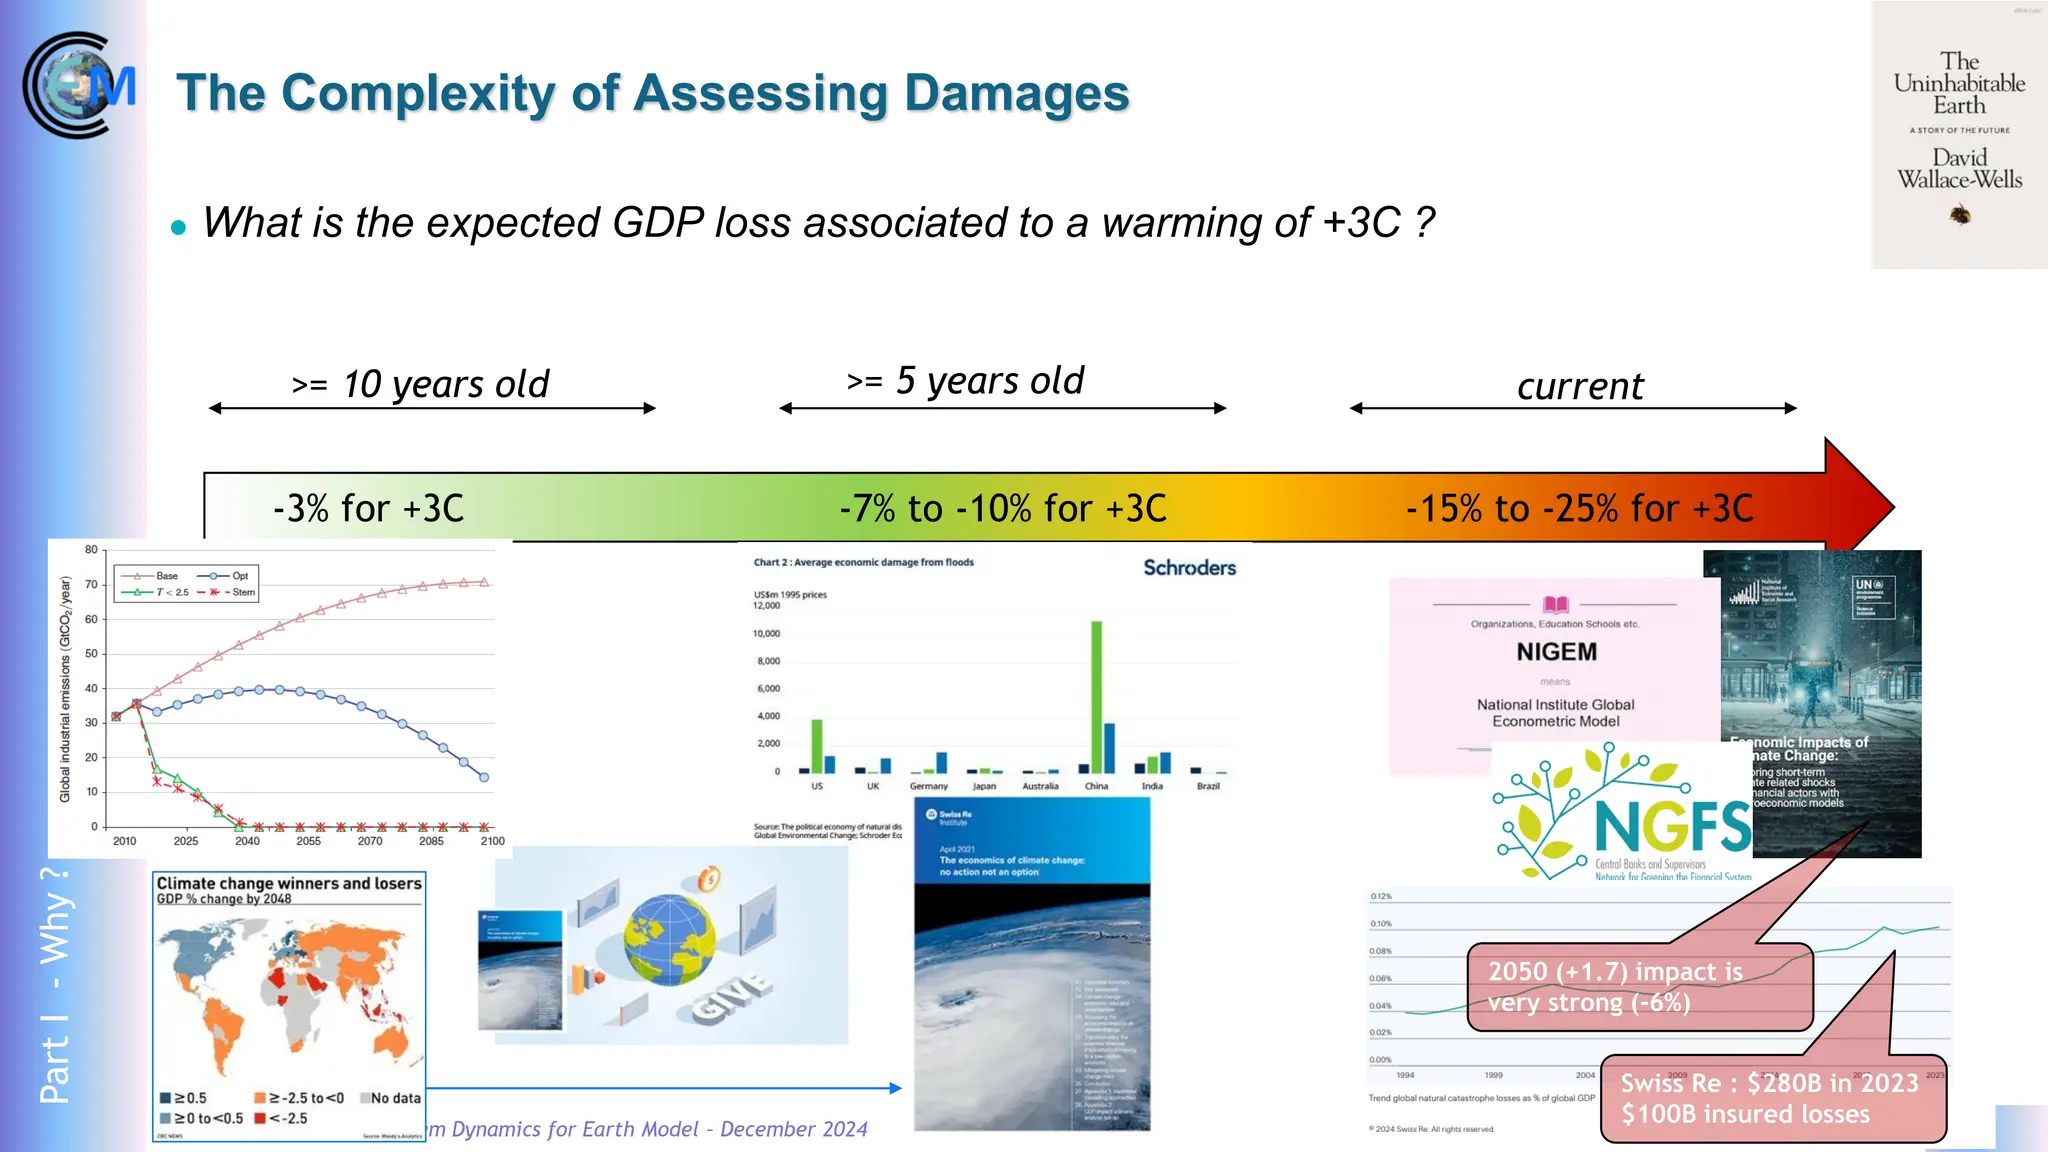
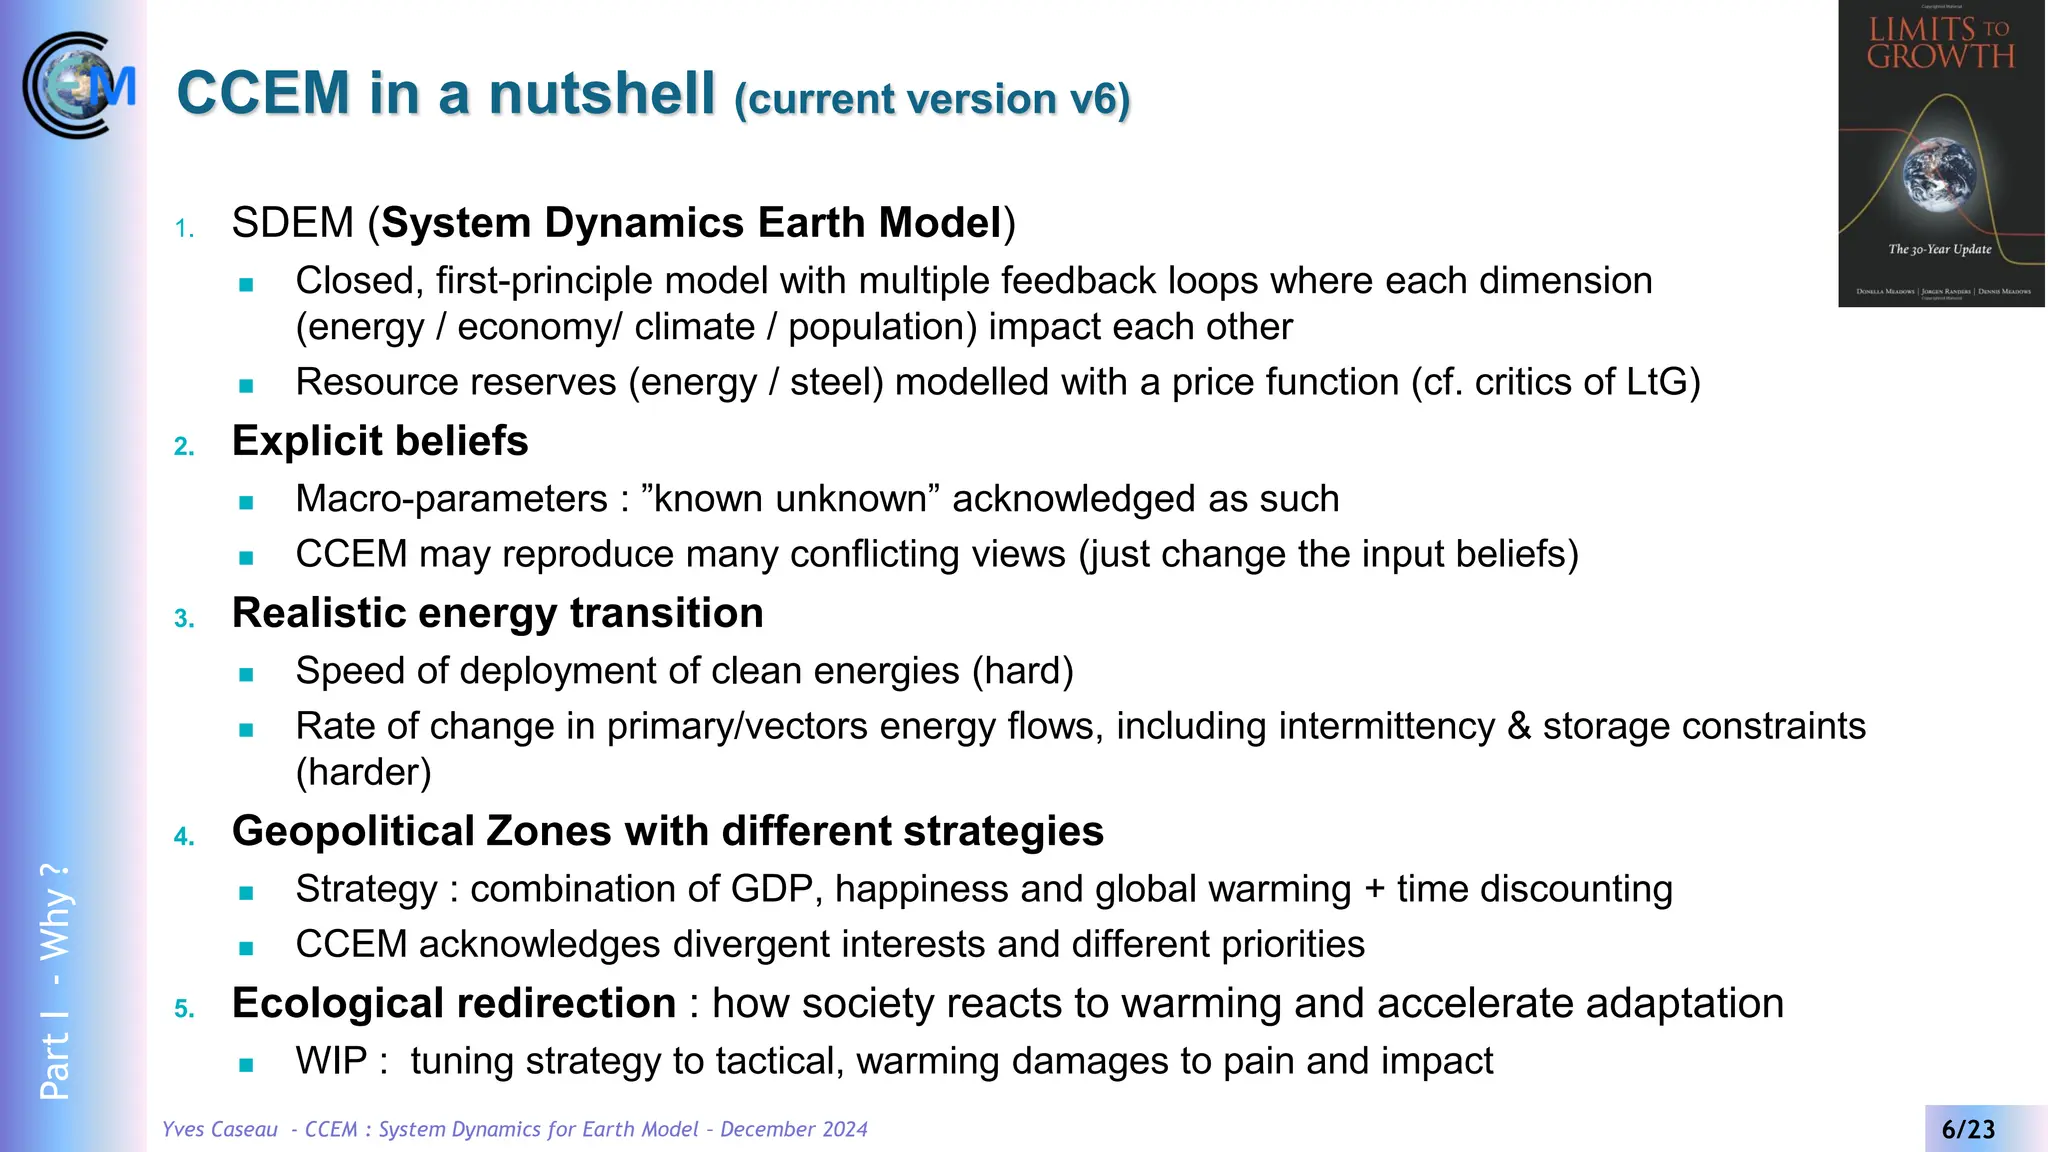
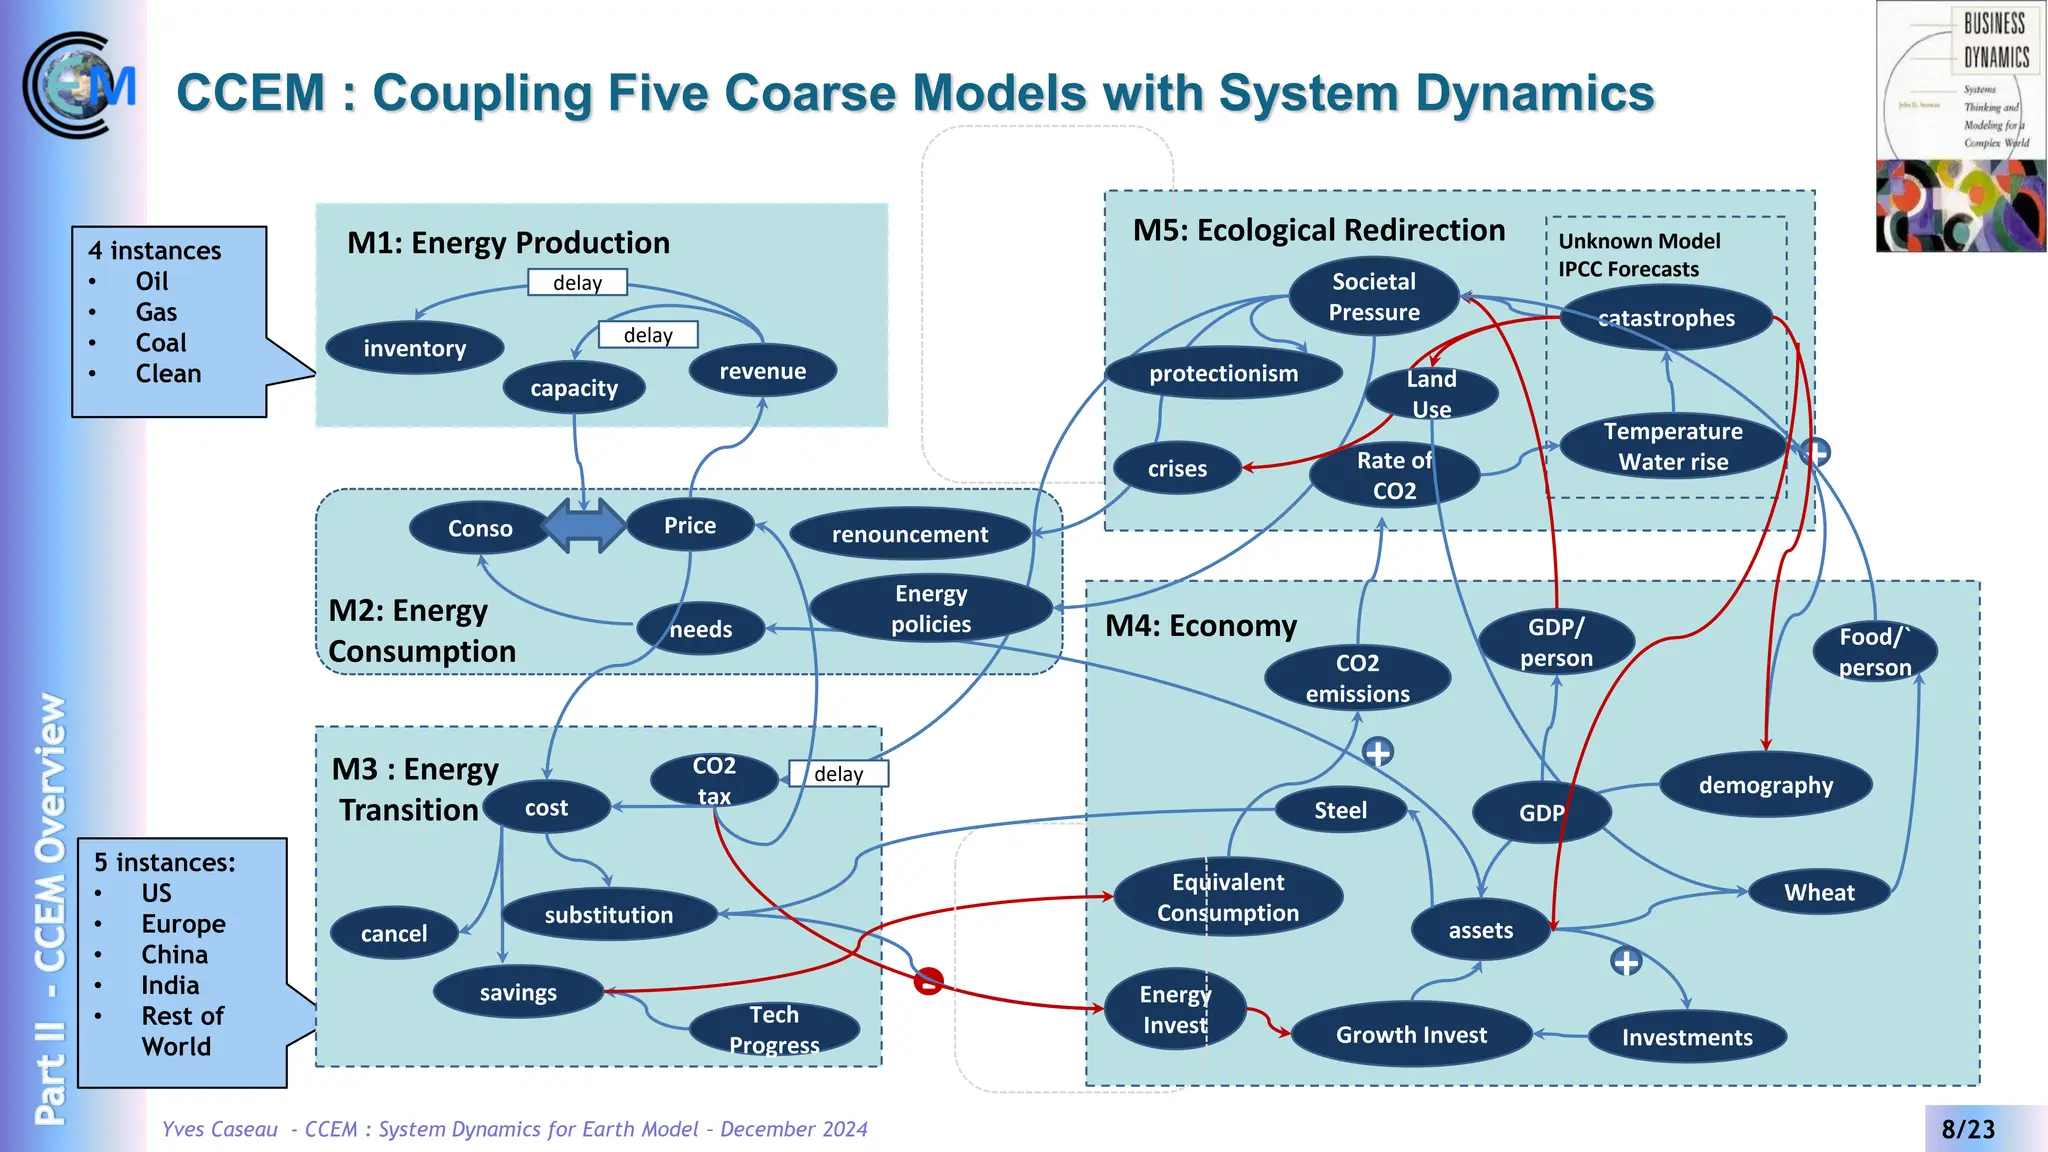
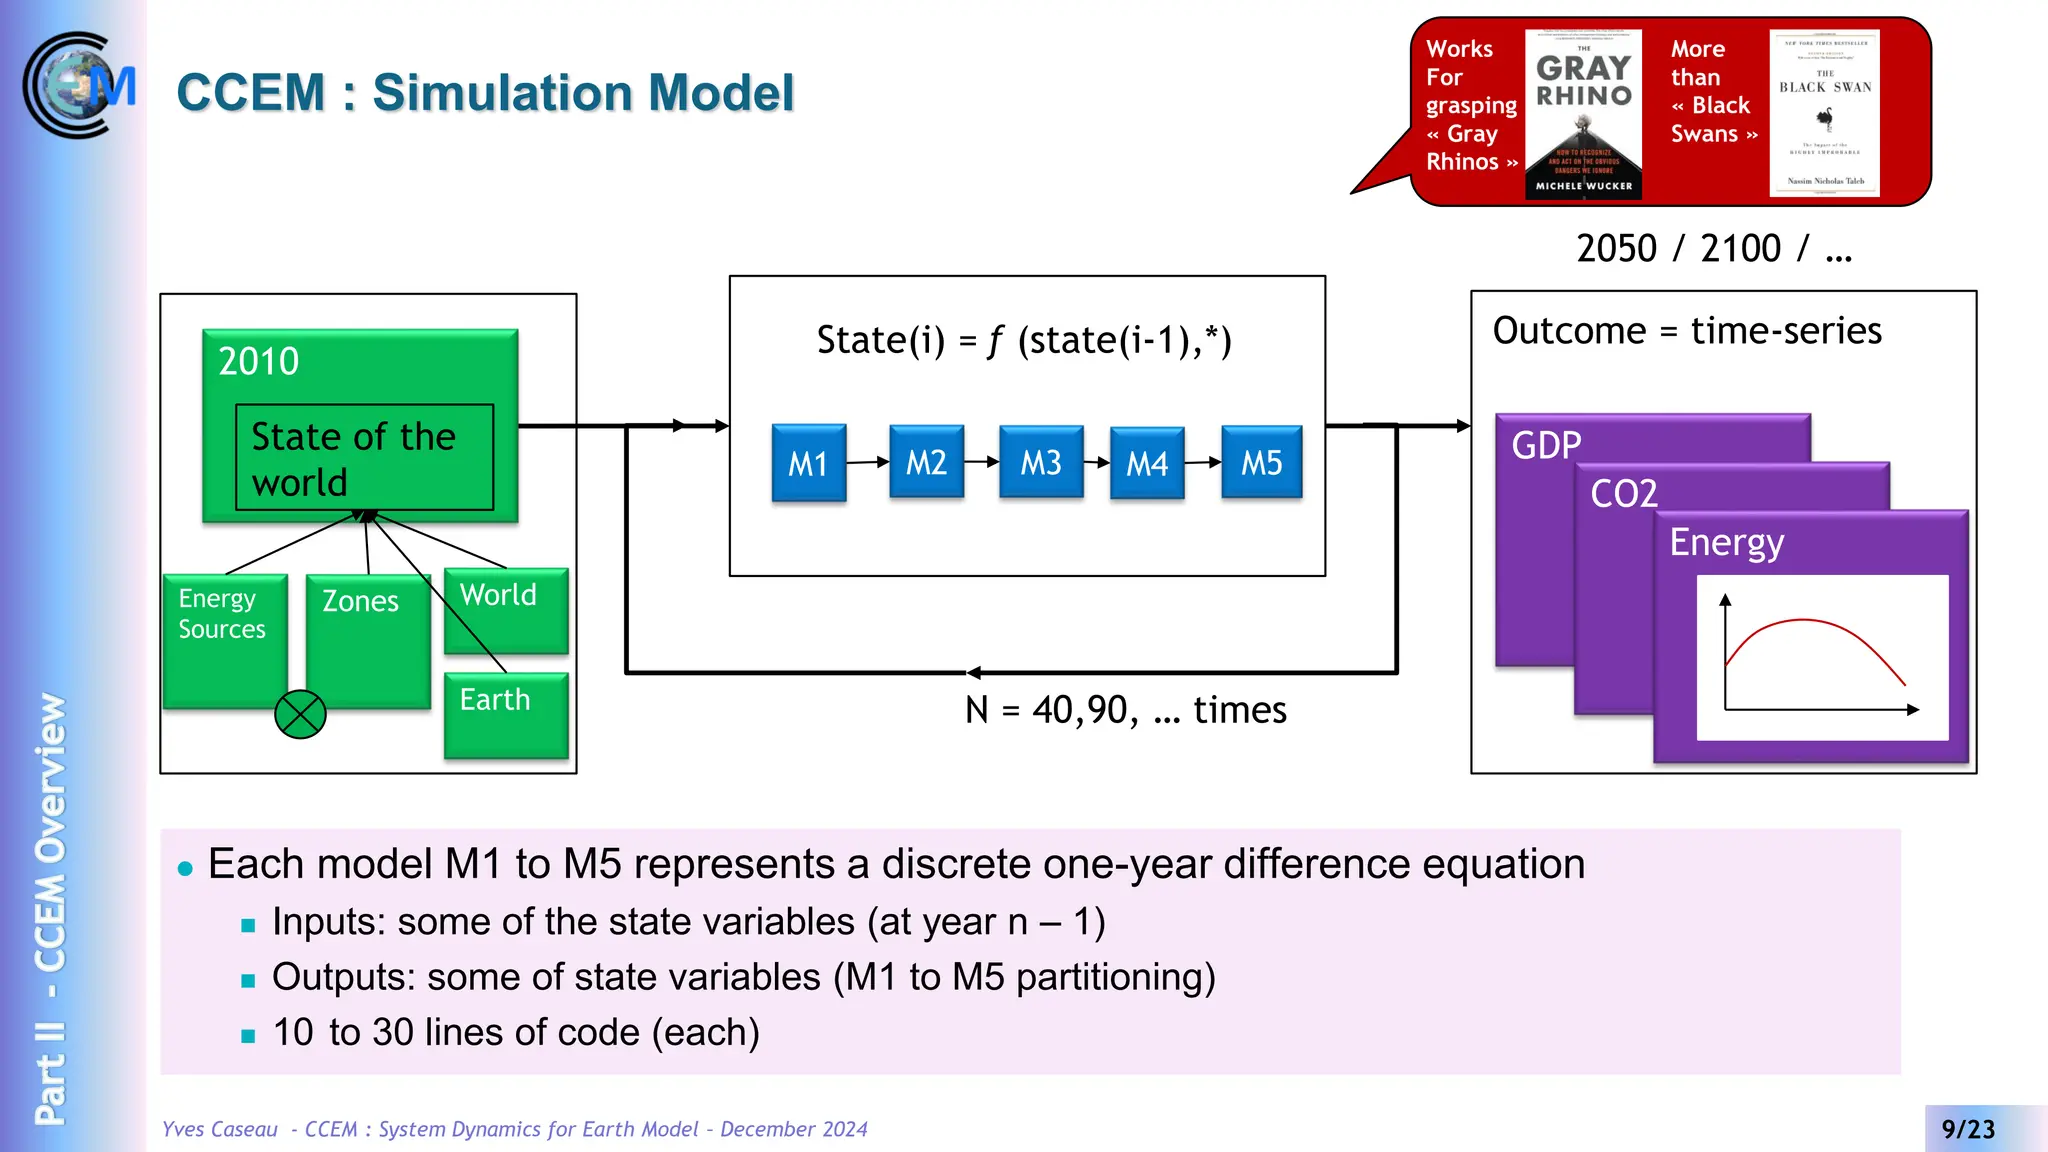
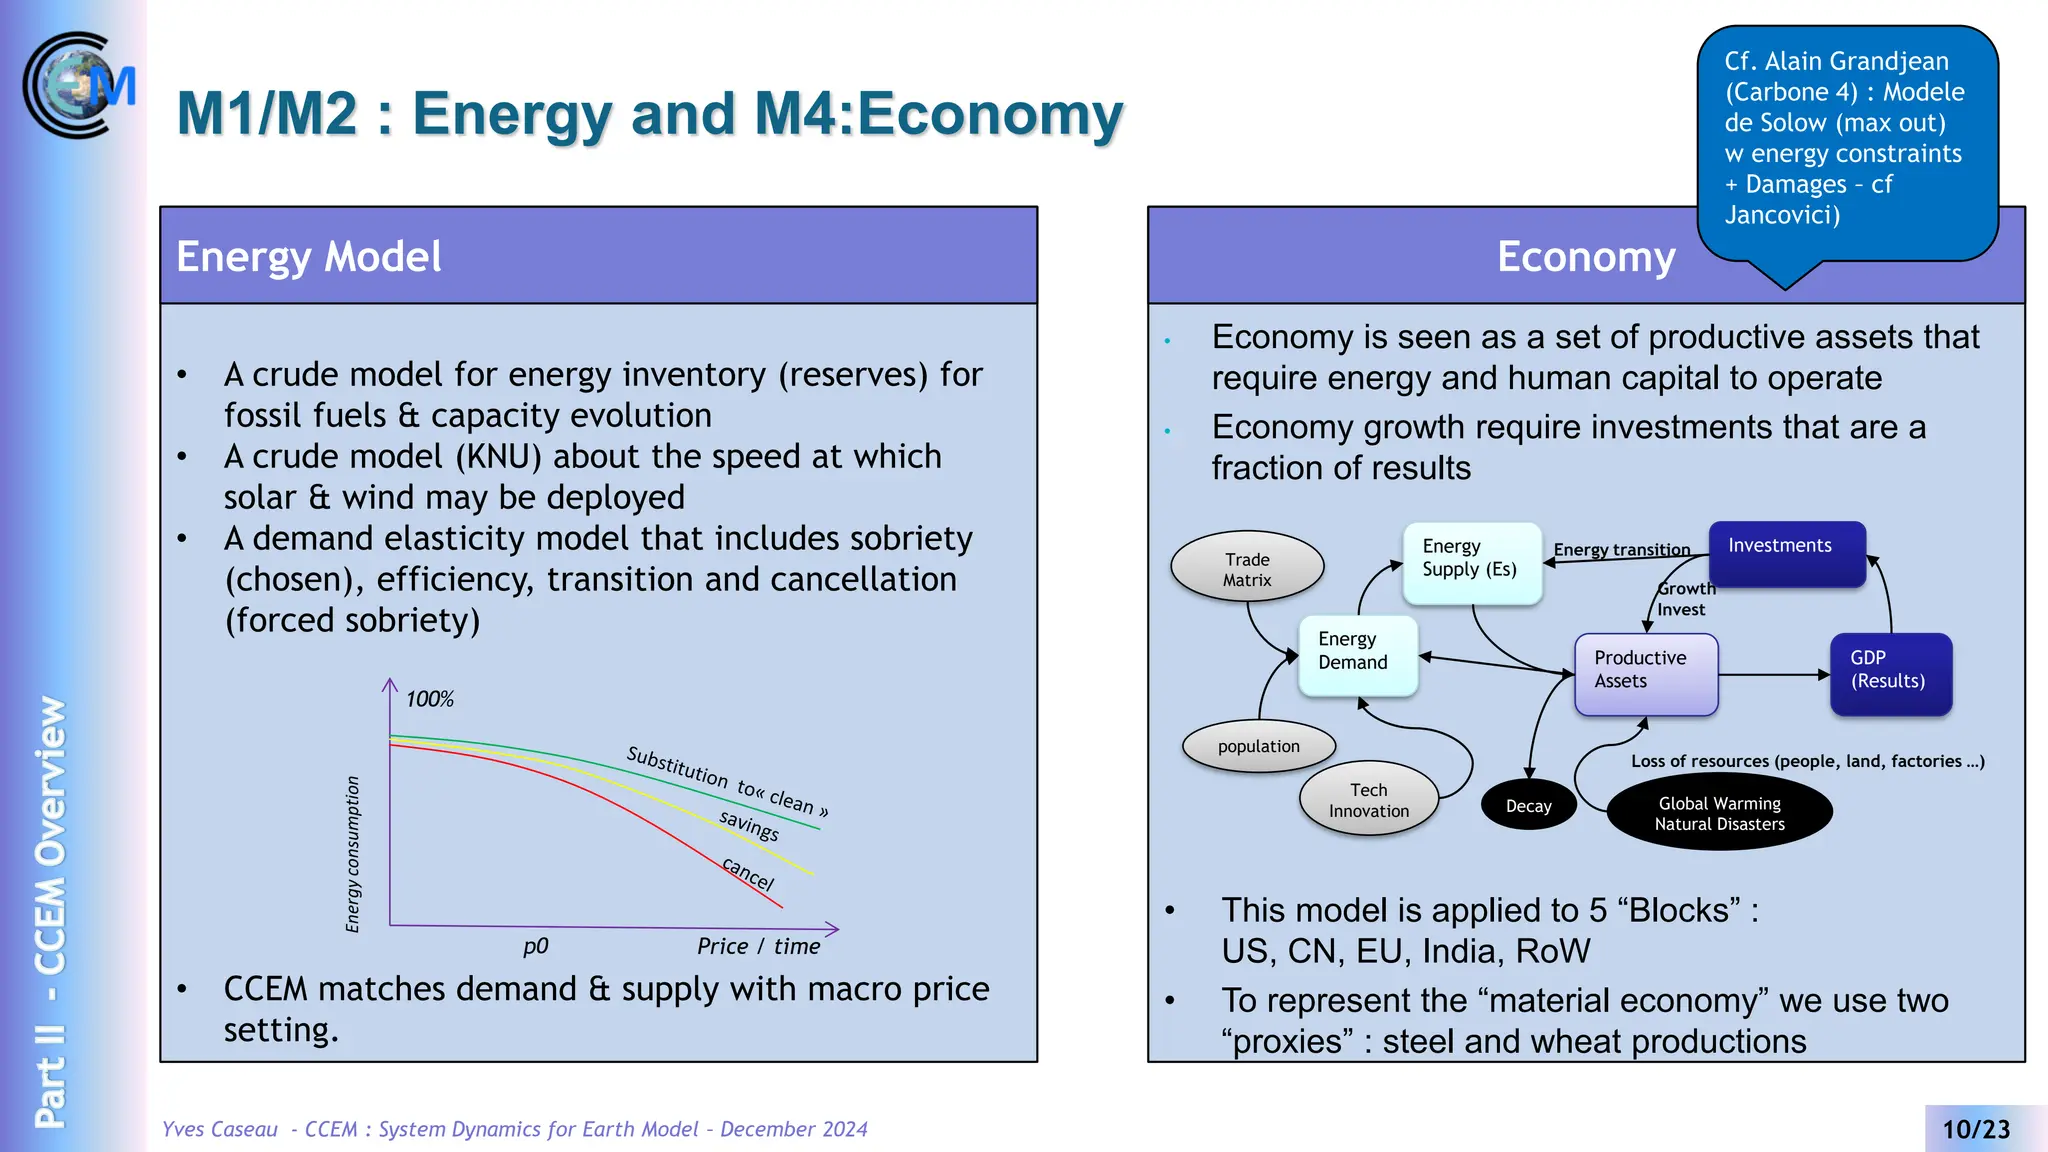
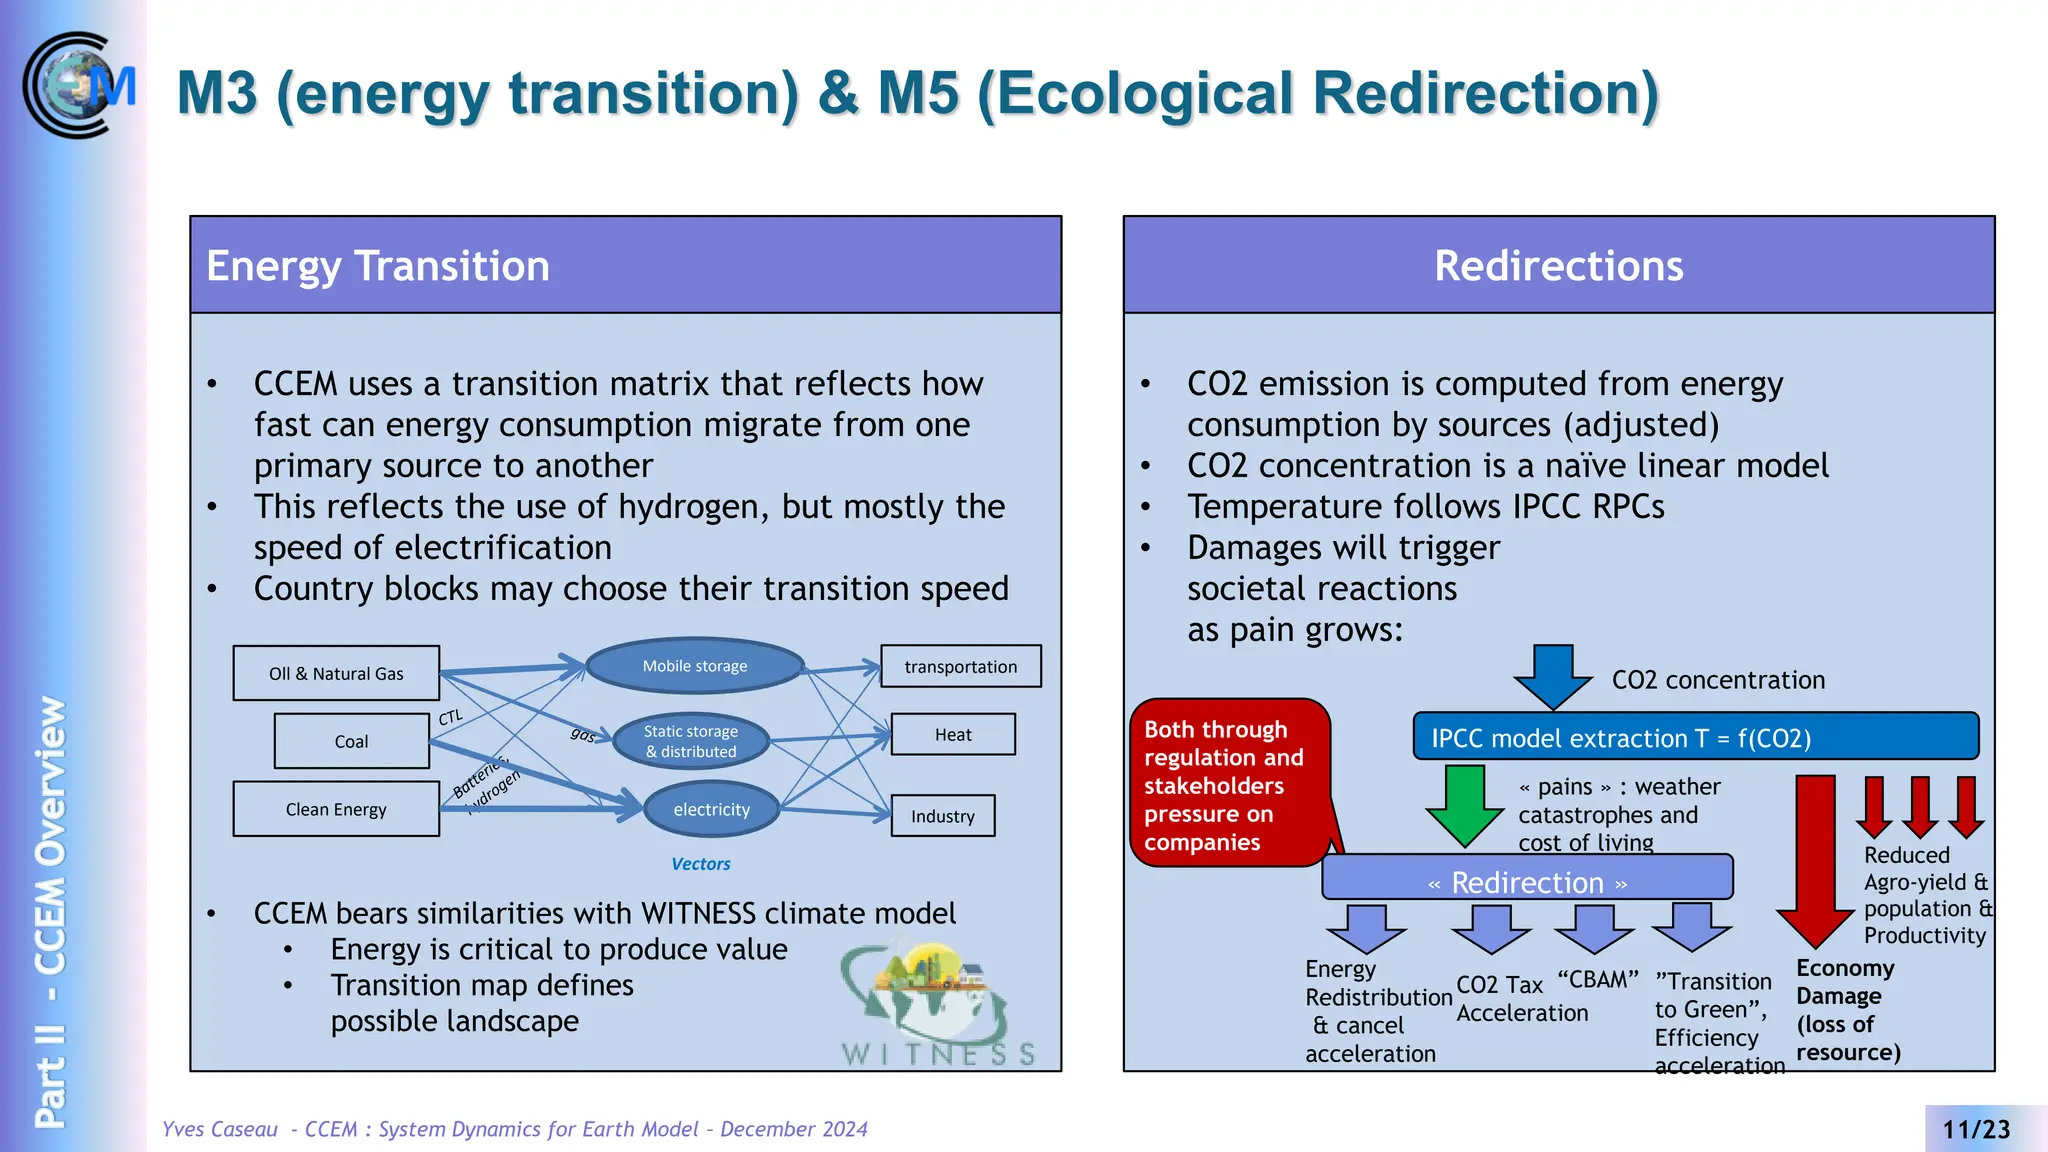

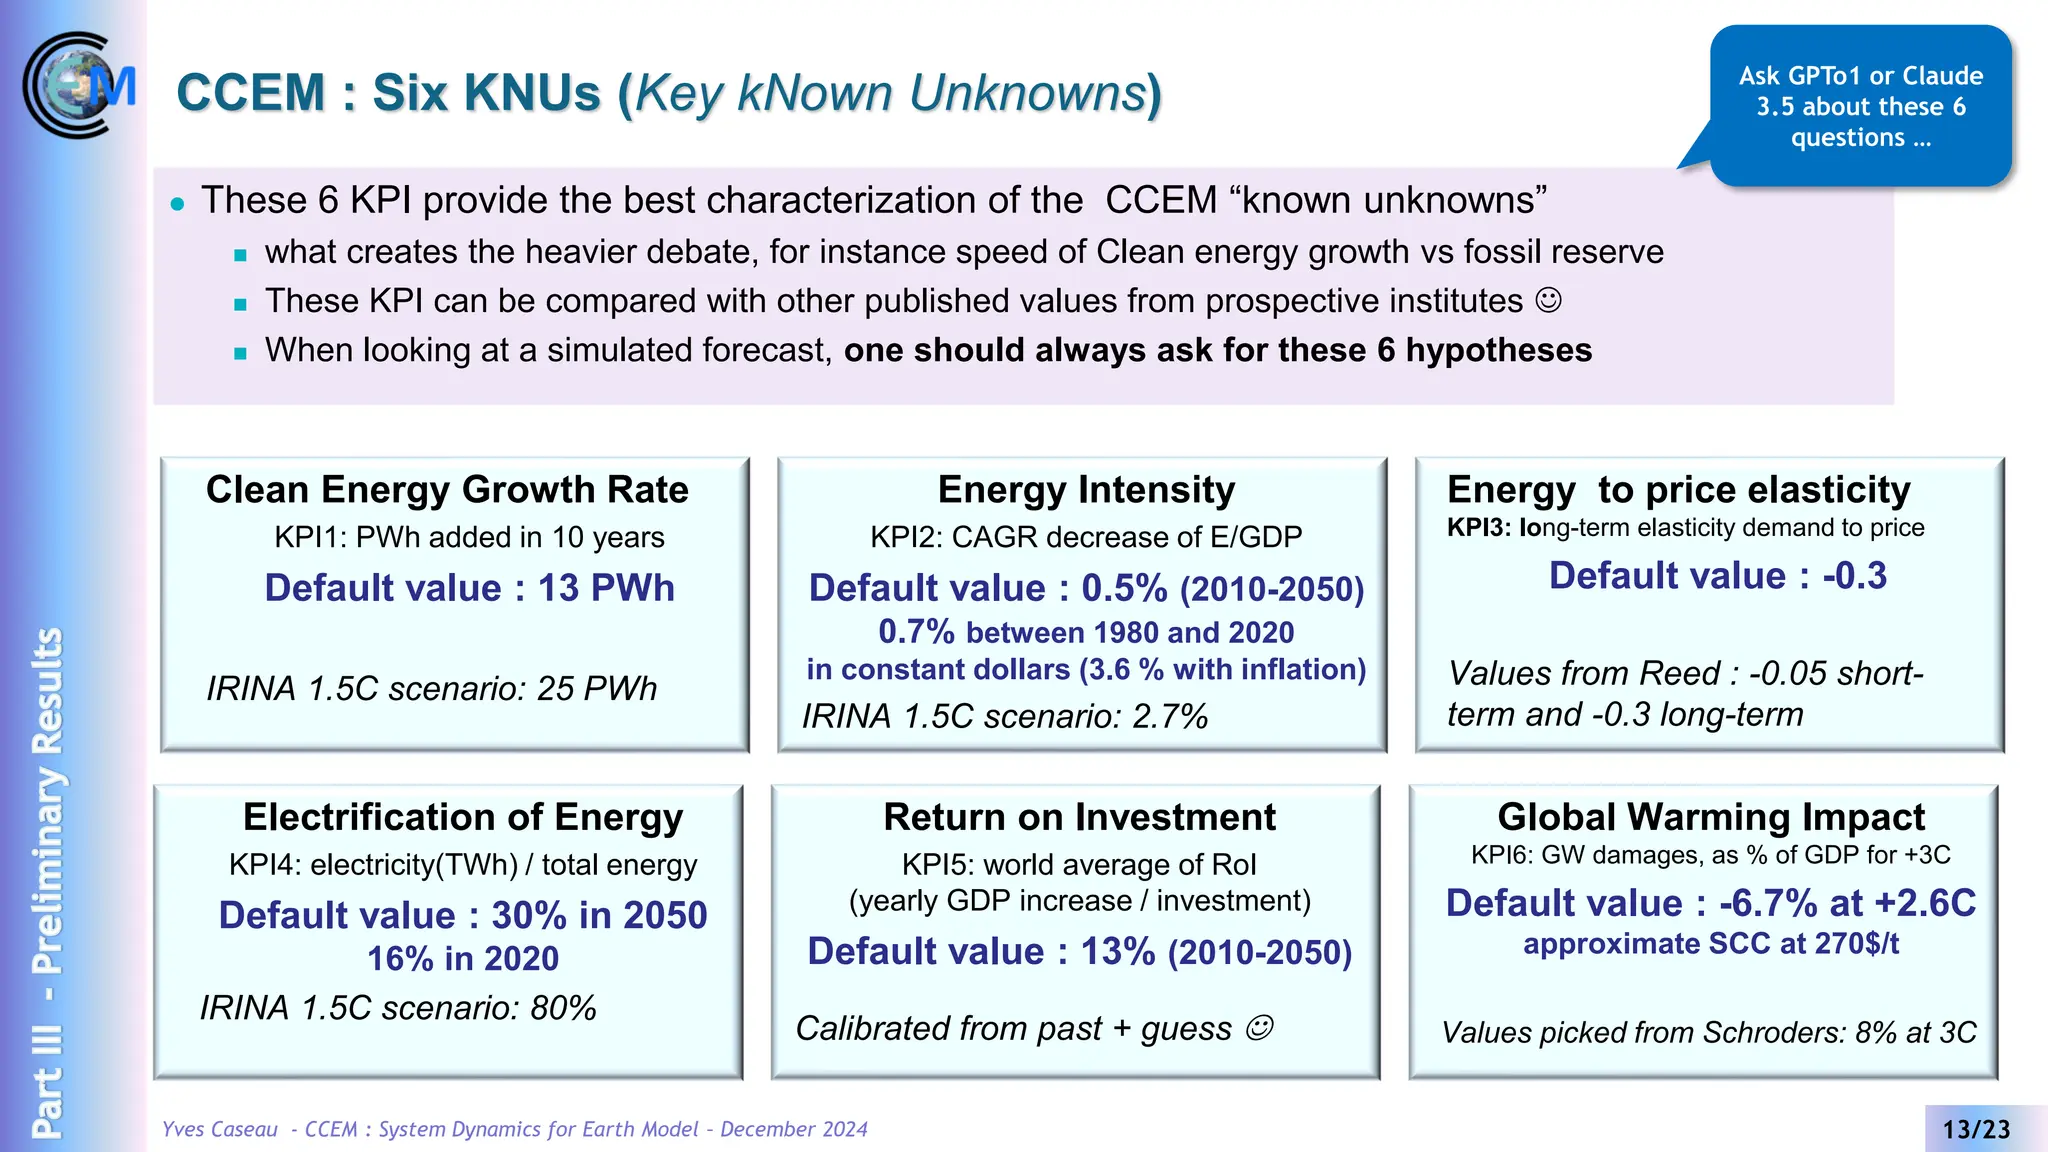
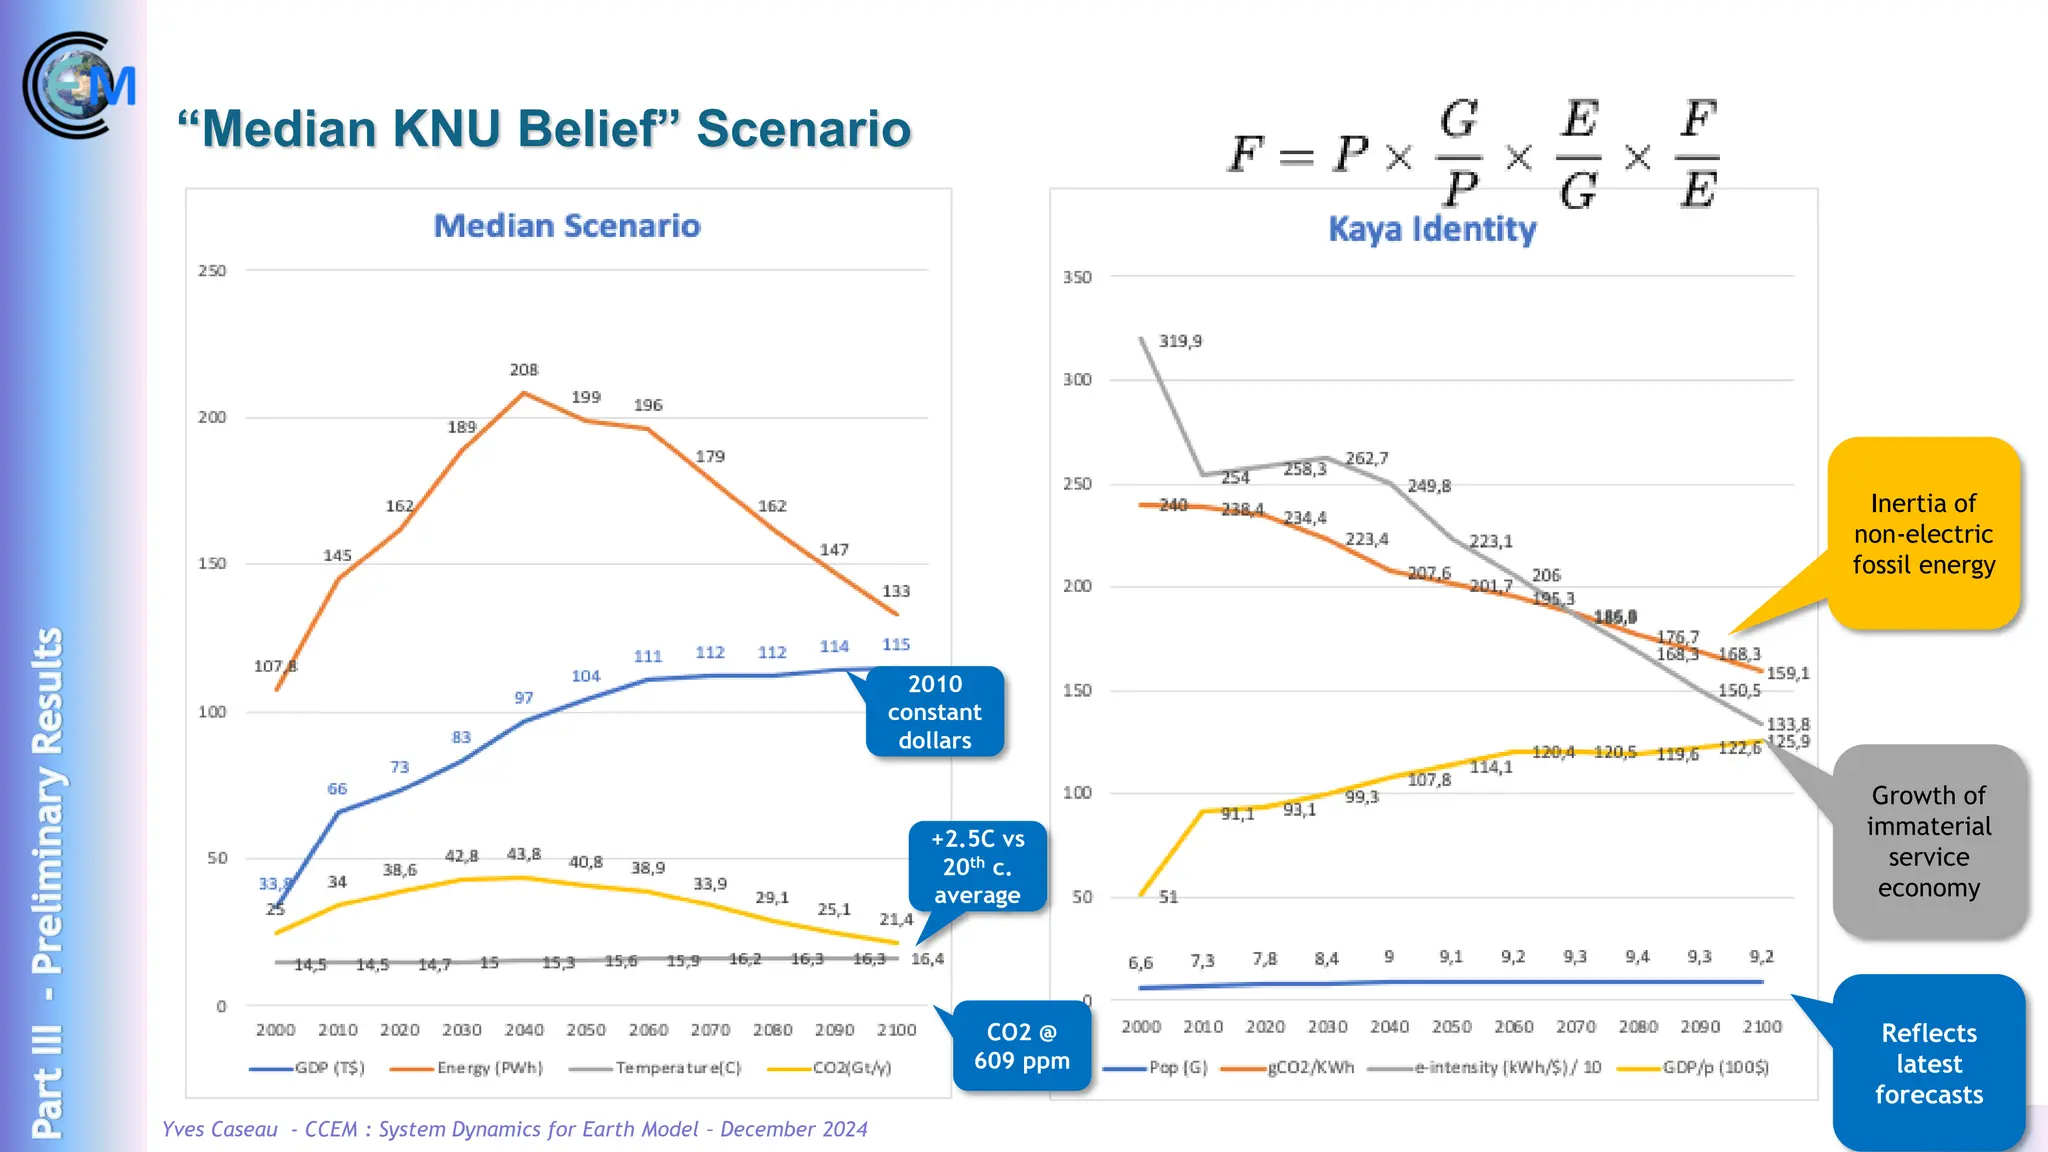
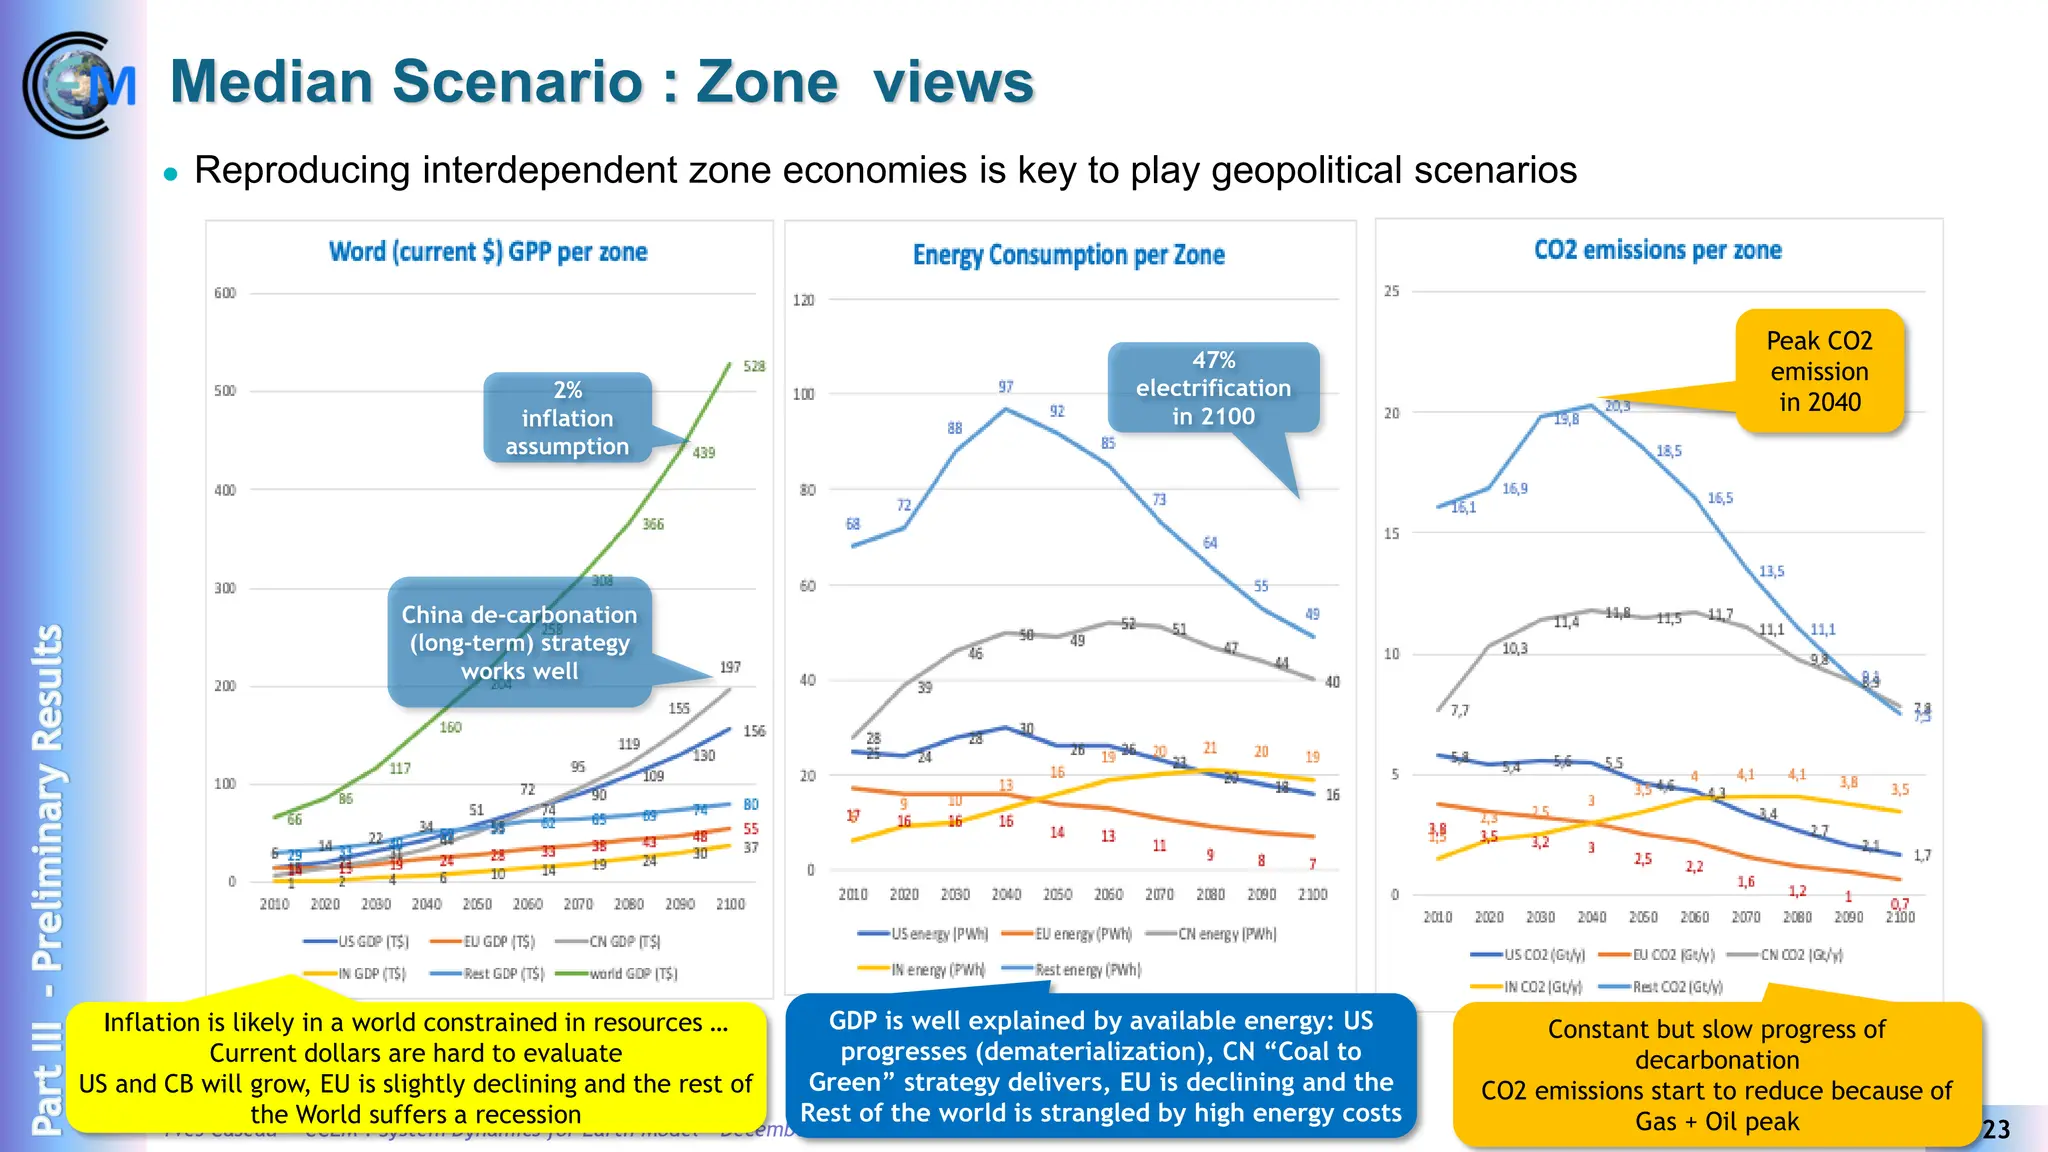
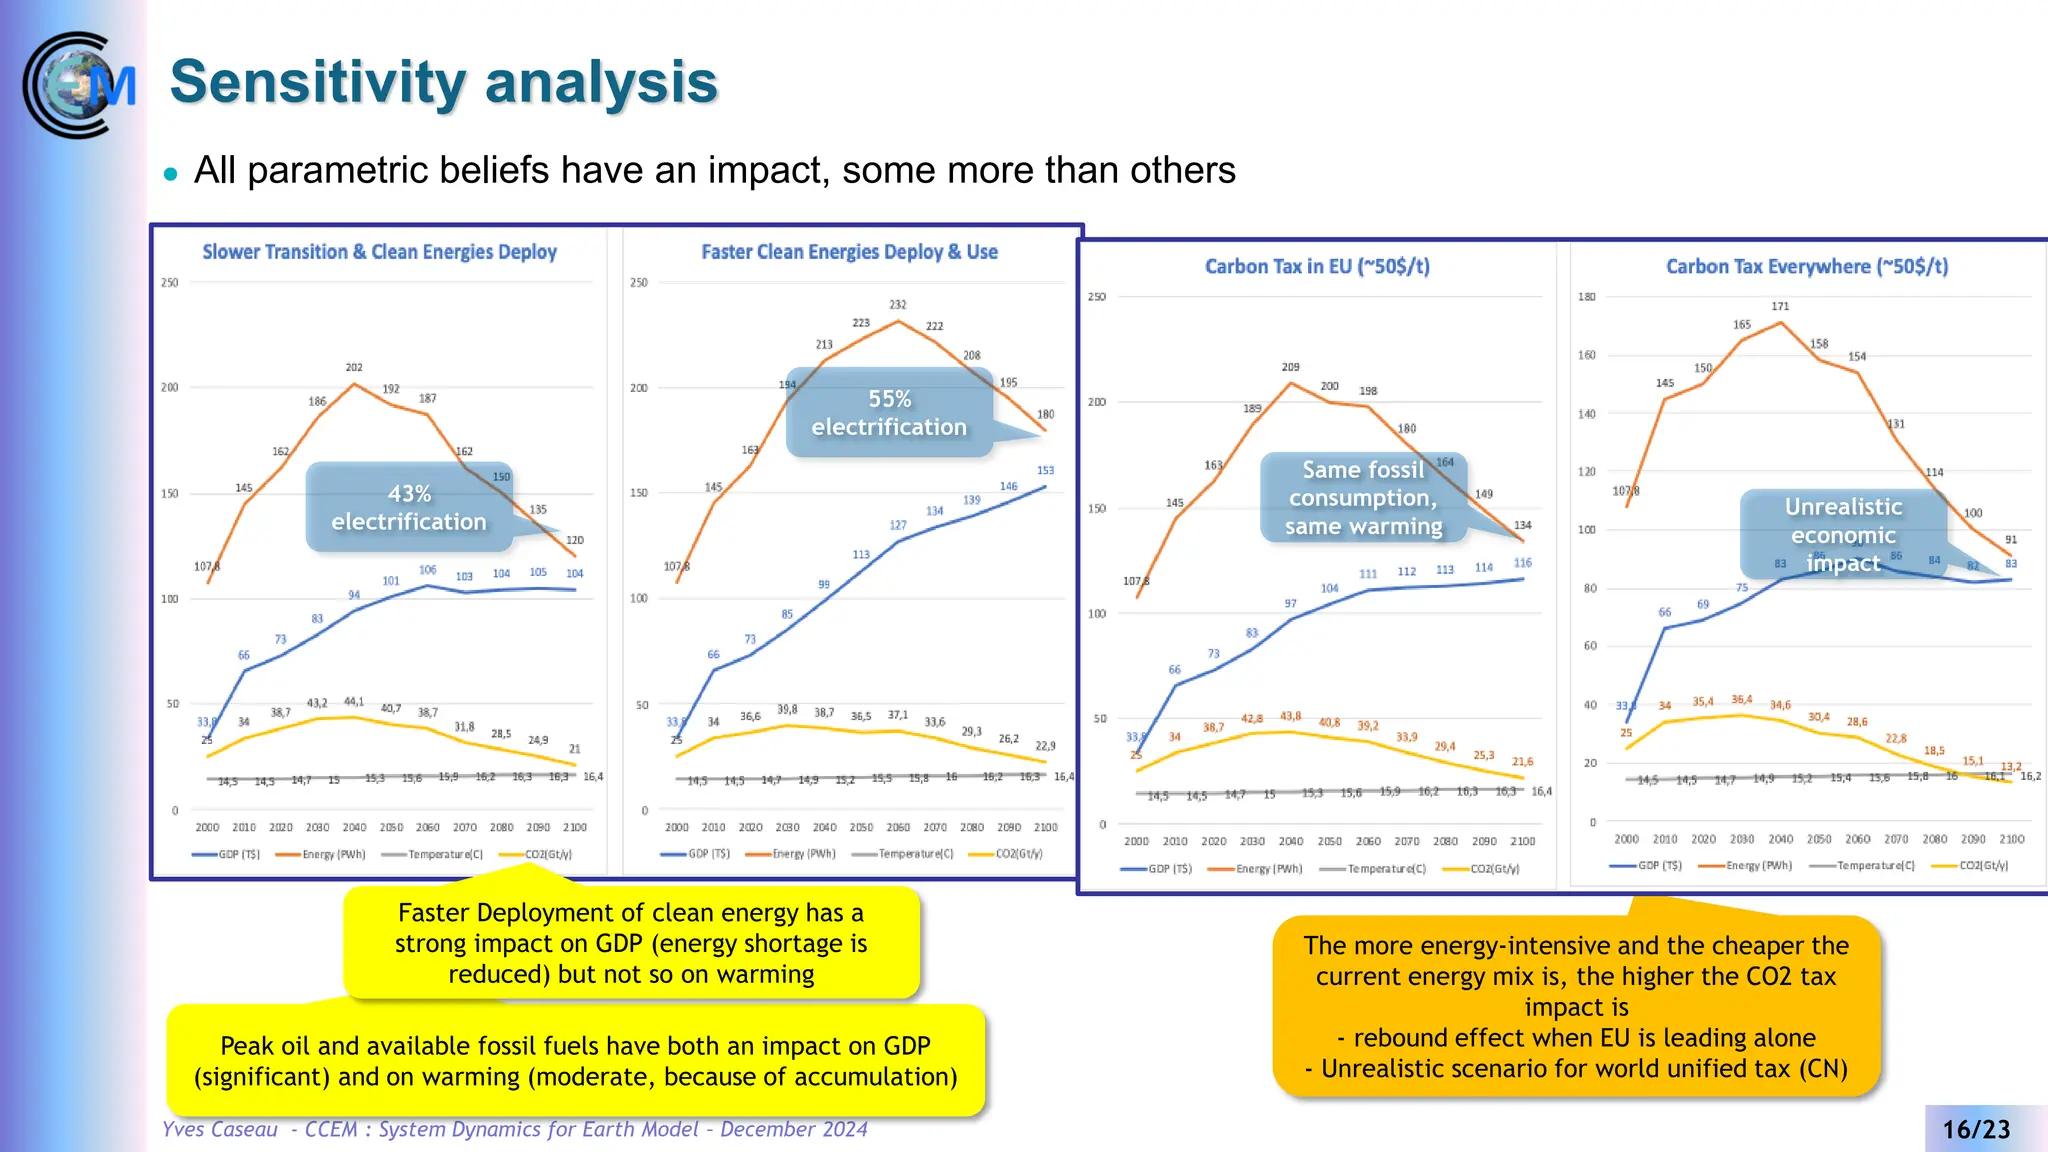
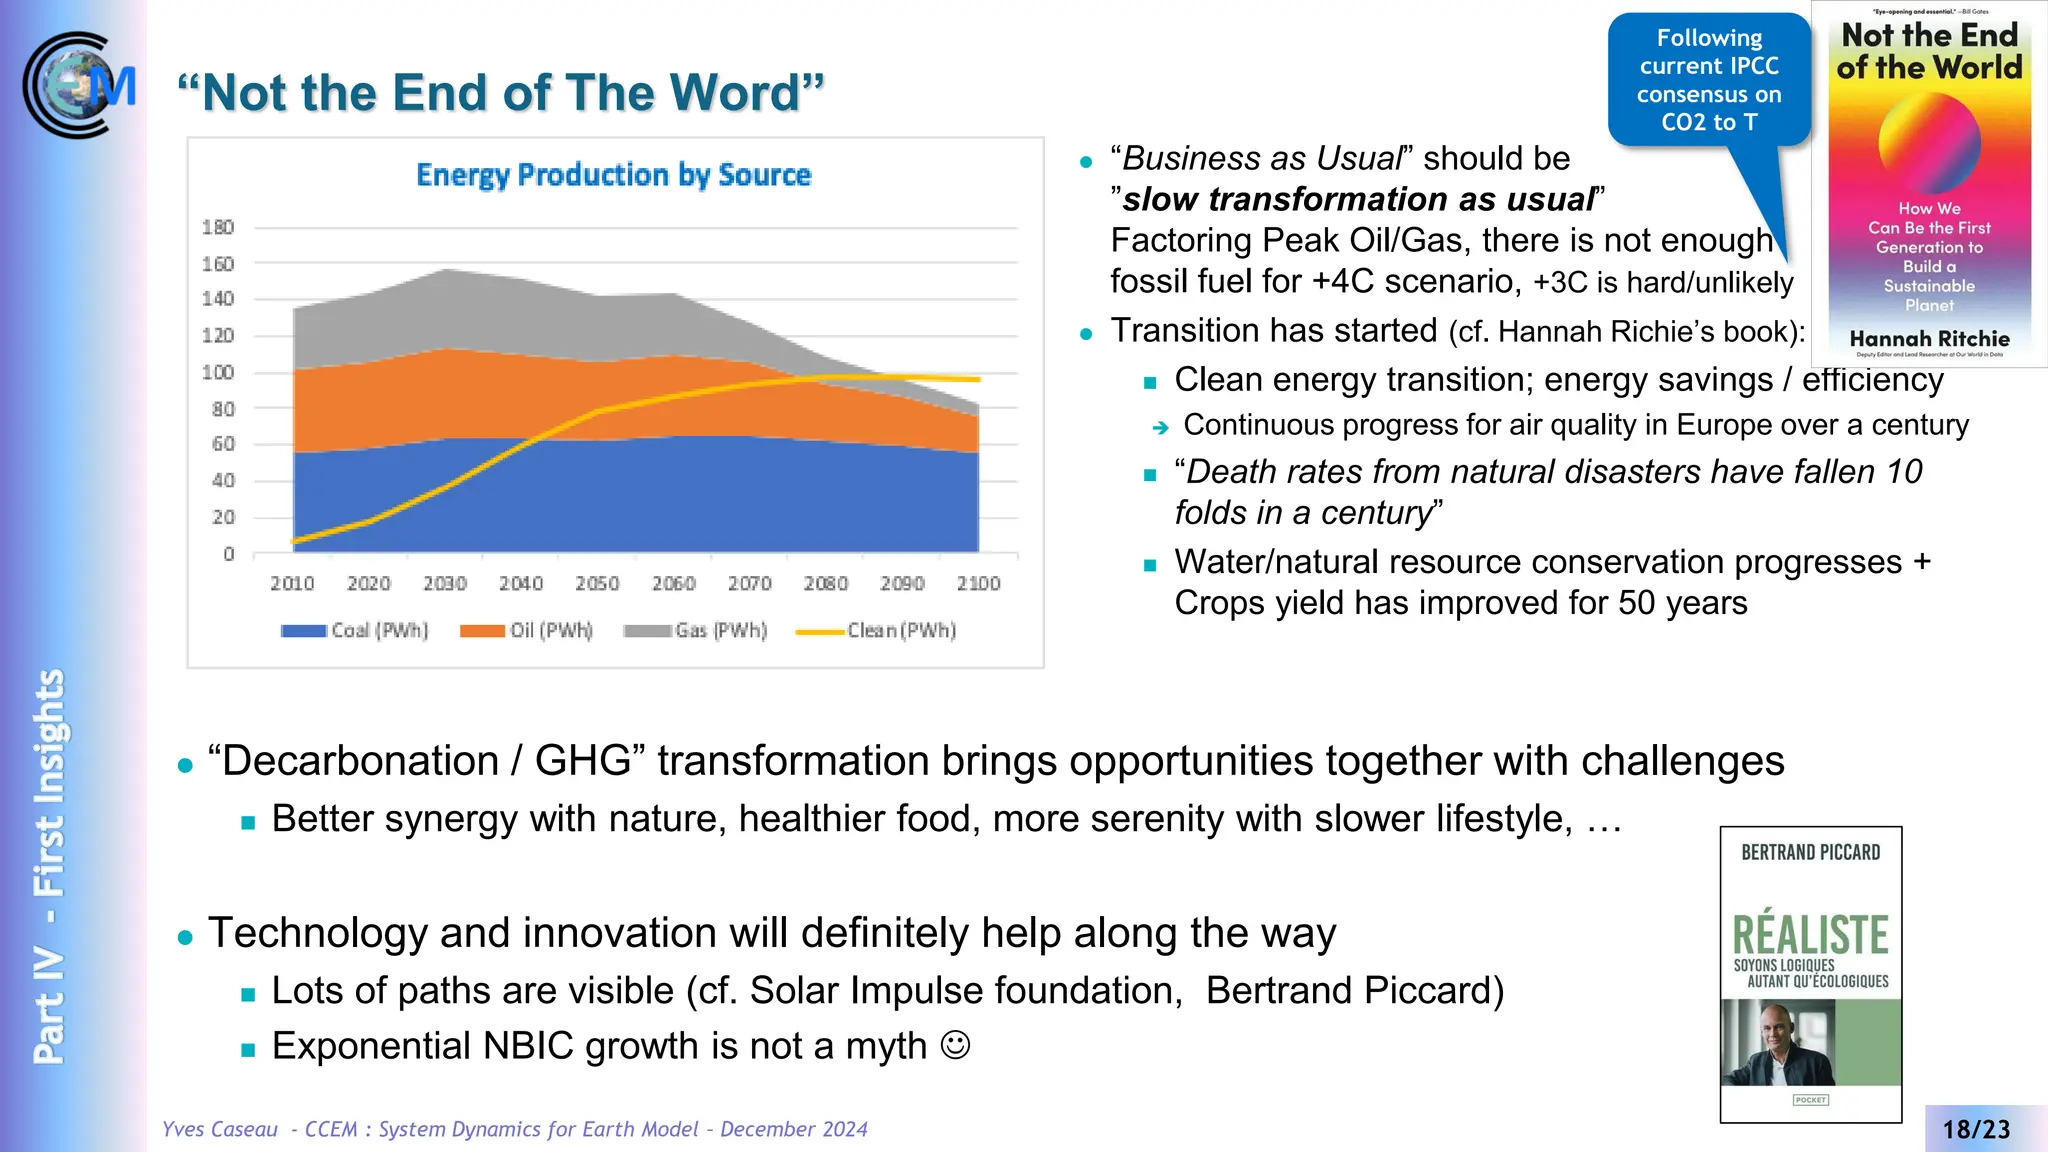
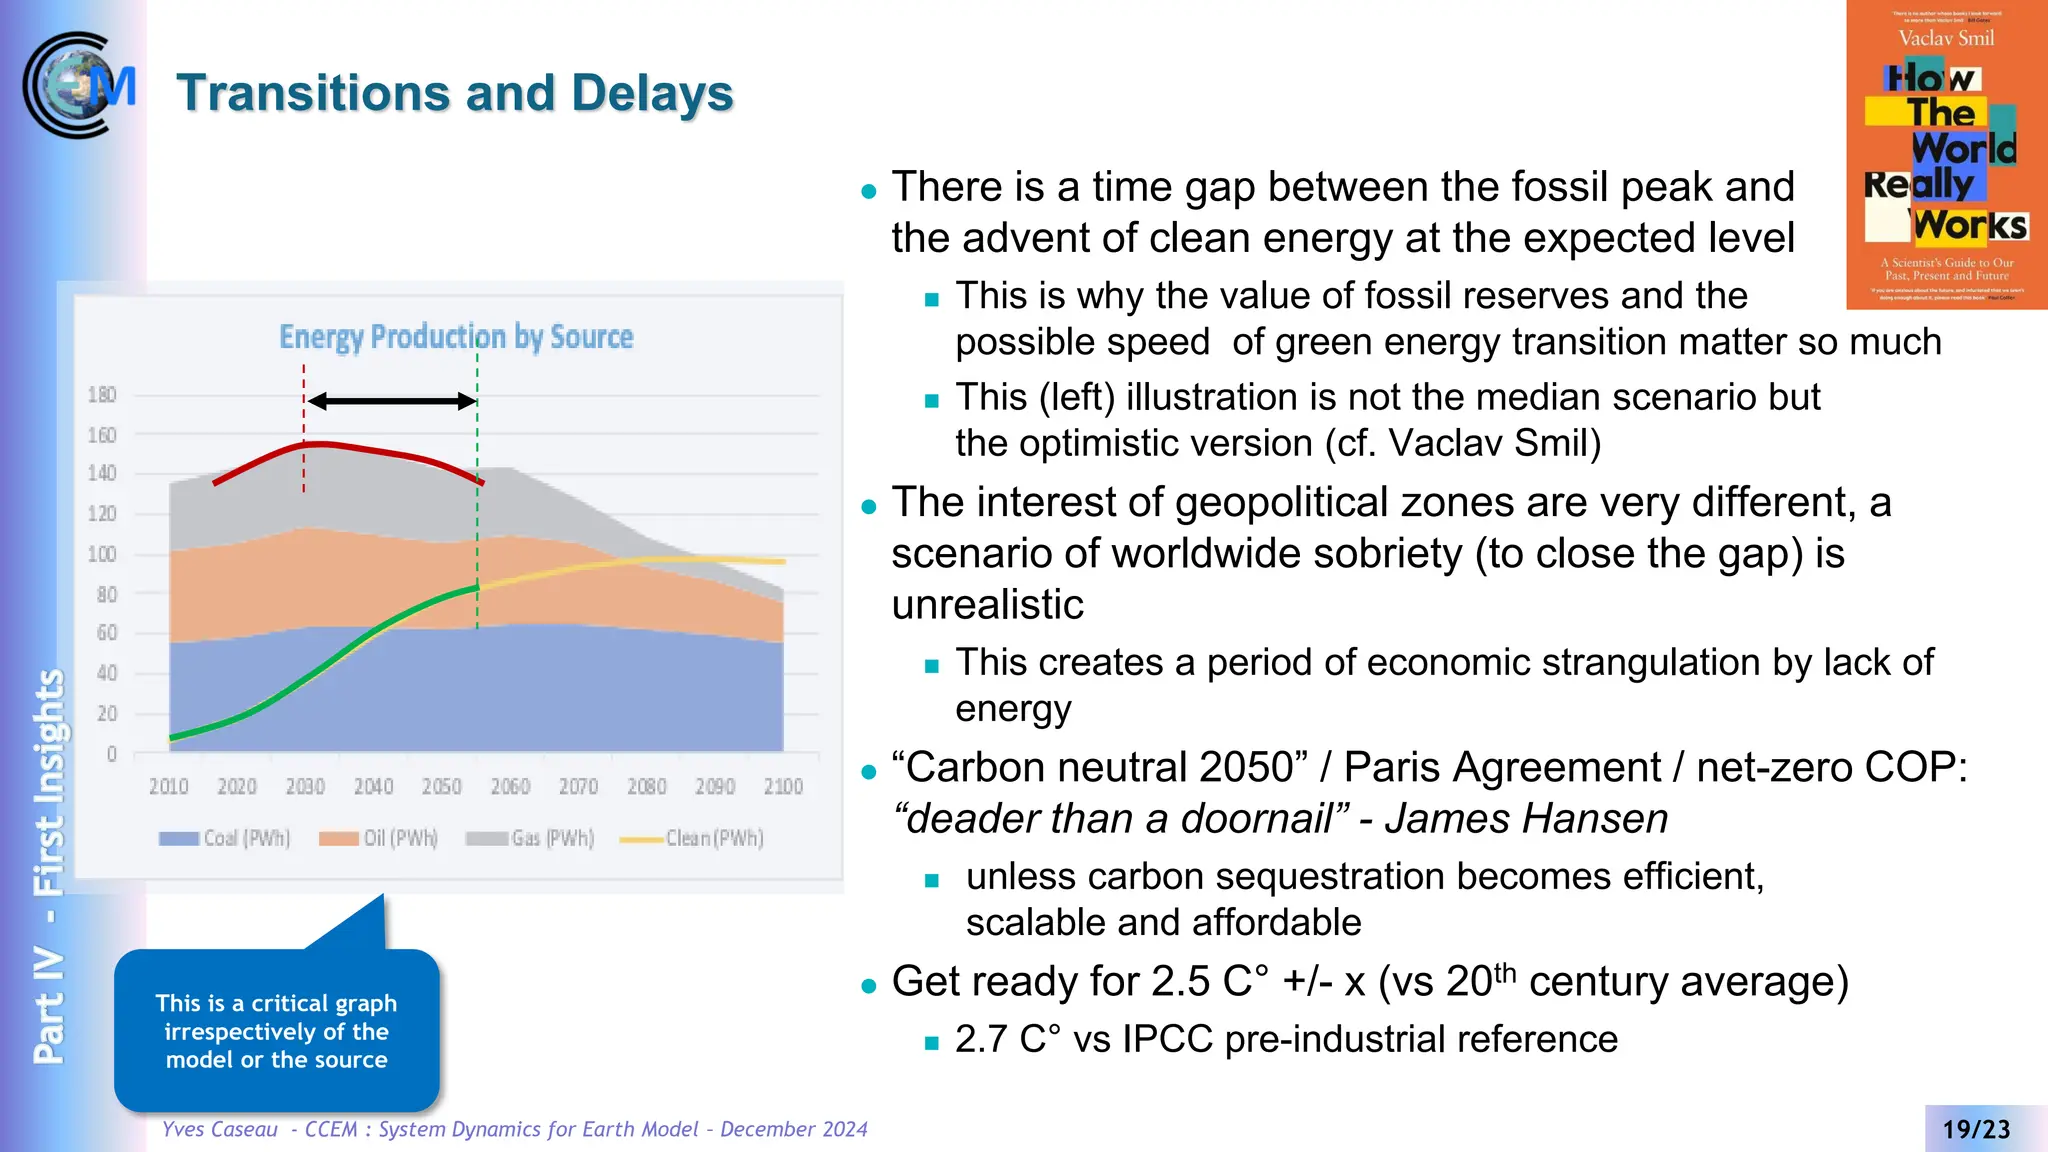


The document presents the System Dynamics Earth Model (CCEM) developed to assess global warming impacts, integrating various models to evaluate energy, economy, and climate interactions. It discusses key unknowns affecting climate projections, societal reactions to warming, and the complexity of energy transition challenges. Preliminary results suggest a continuous transformation towards cleaner energy, while acknowledging significant geopolitical and economic disparities along with the need for adaptation to inevitable impacts of climate change.