Download to read offline
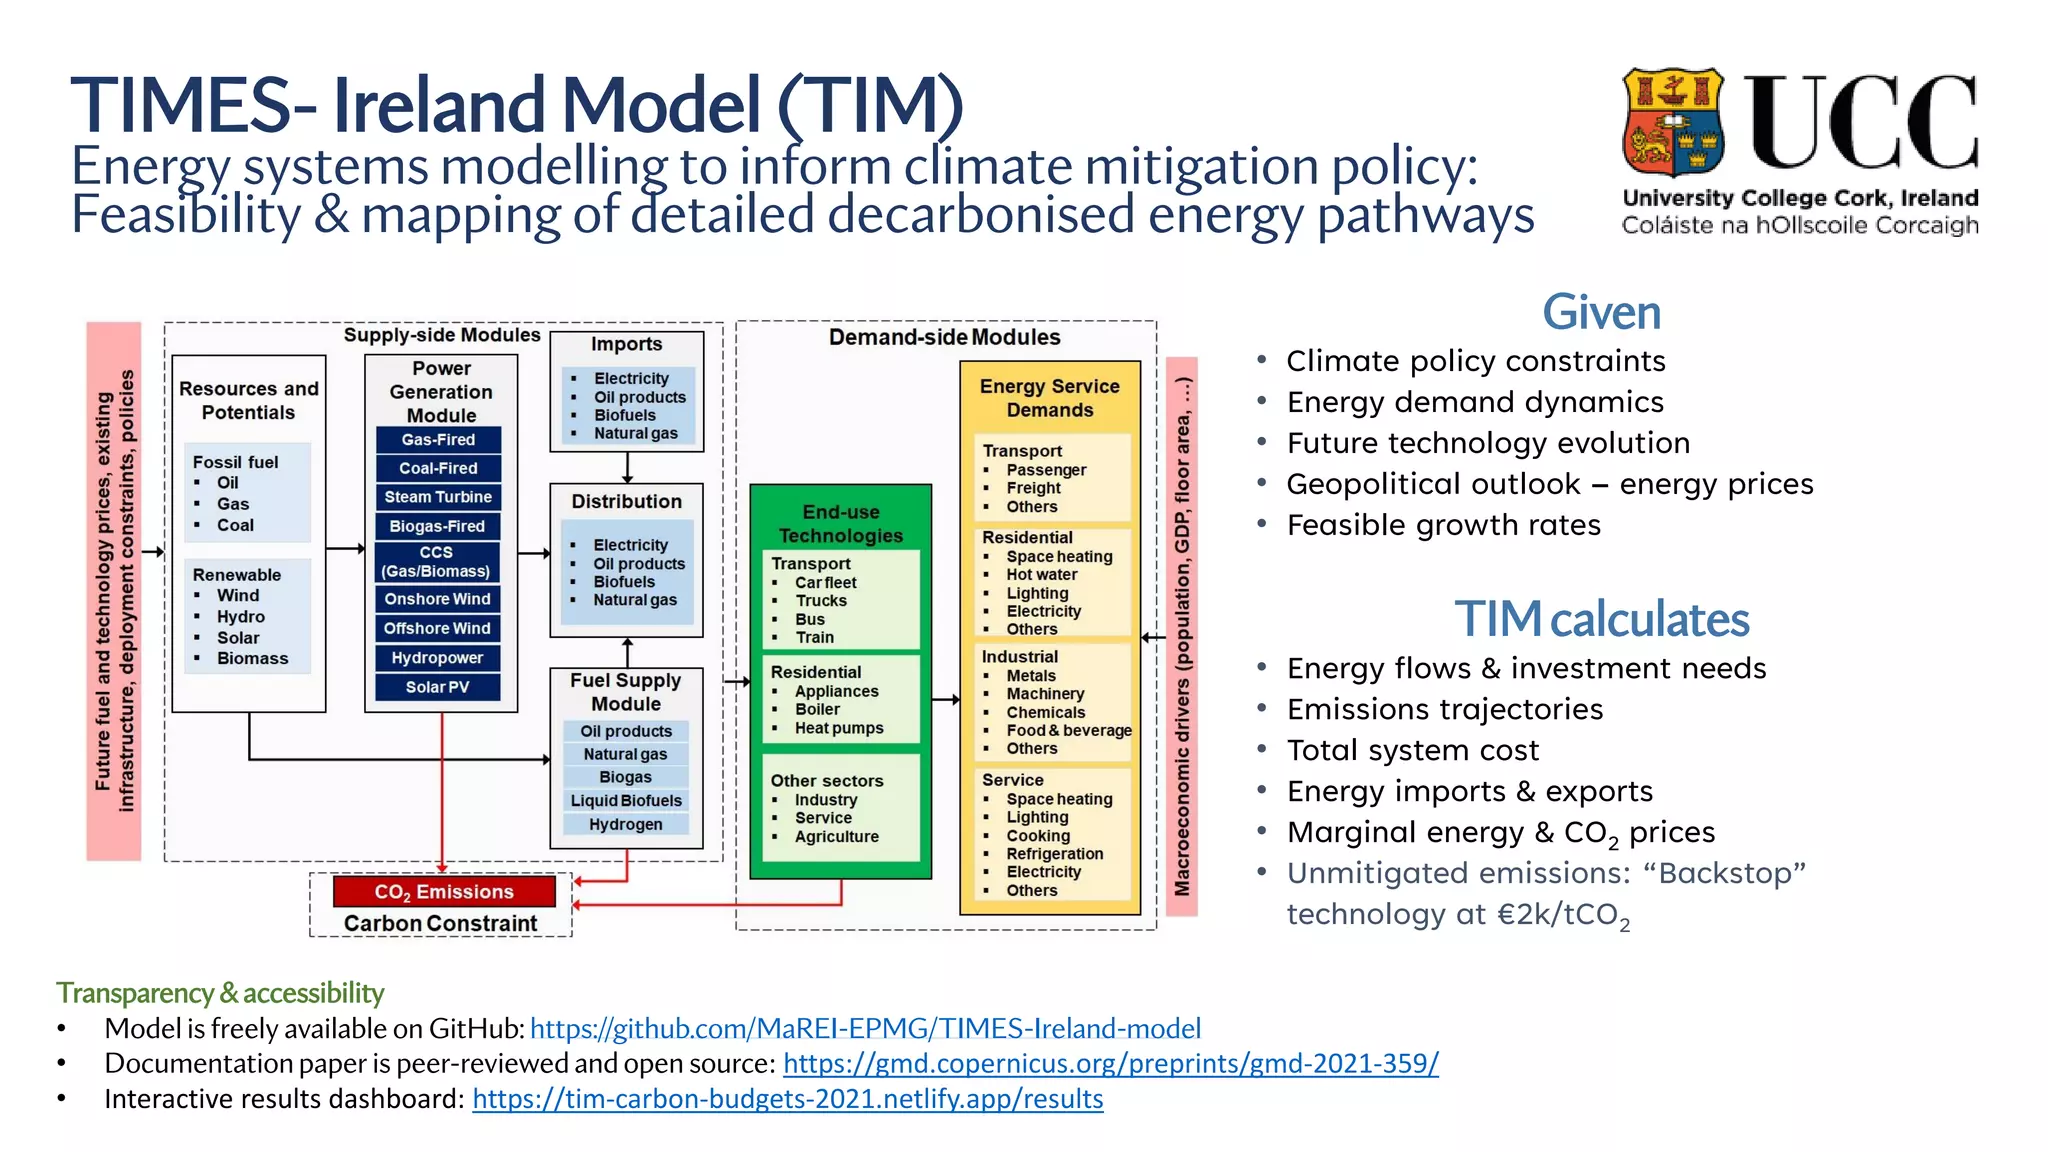
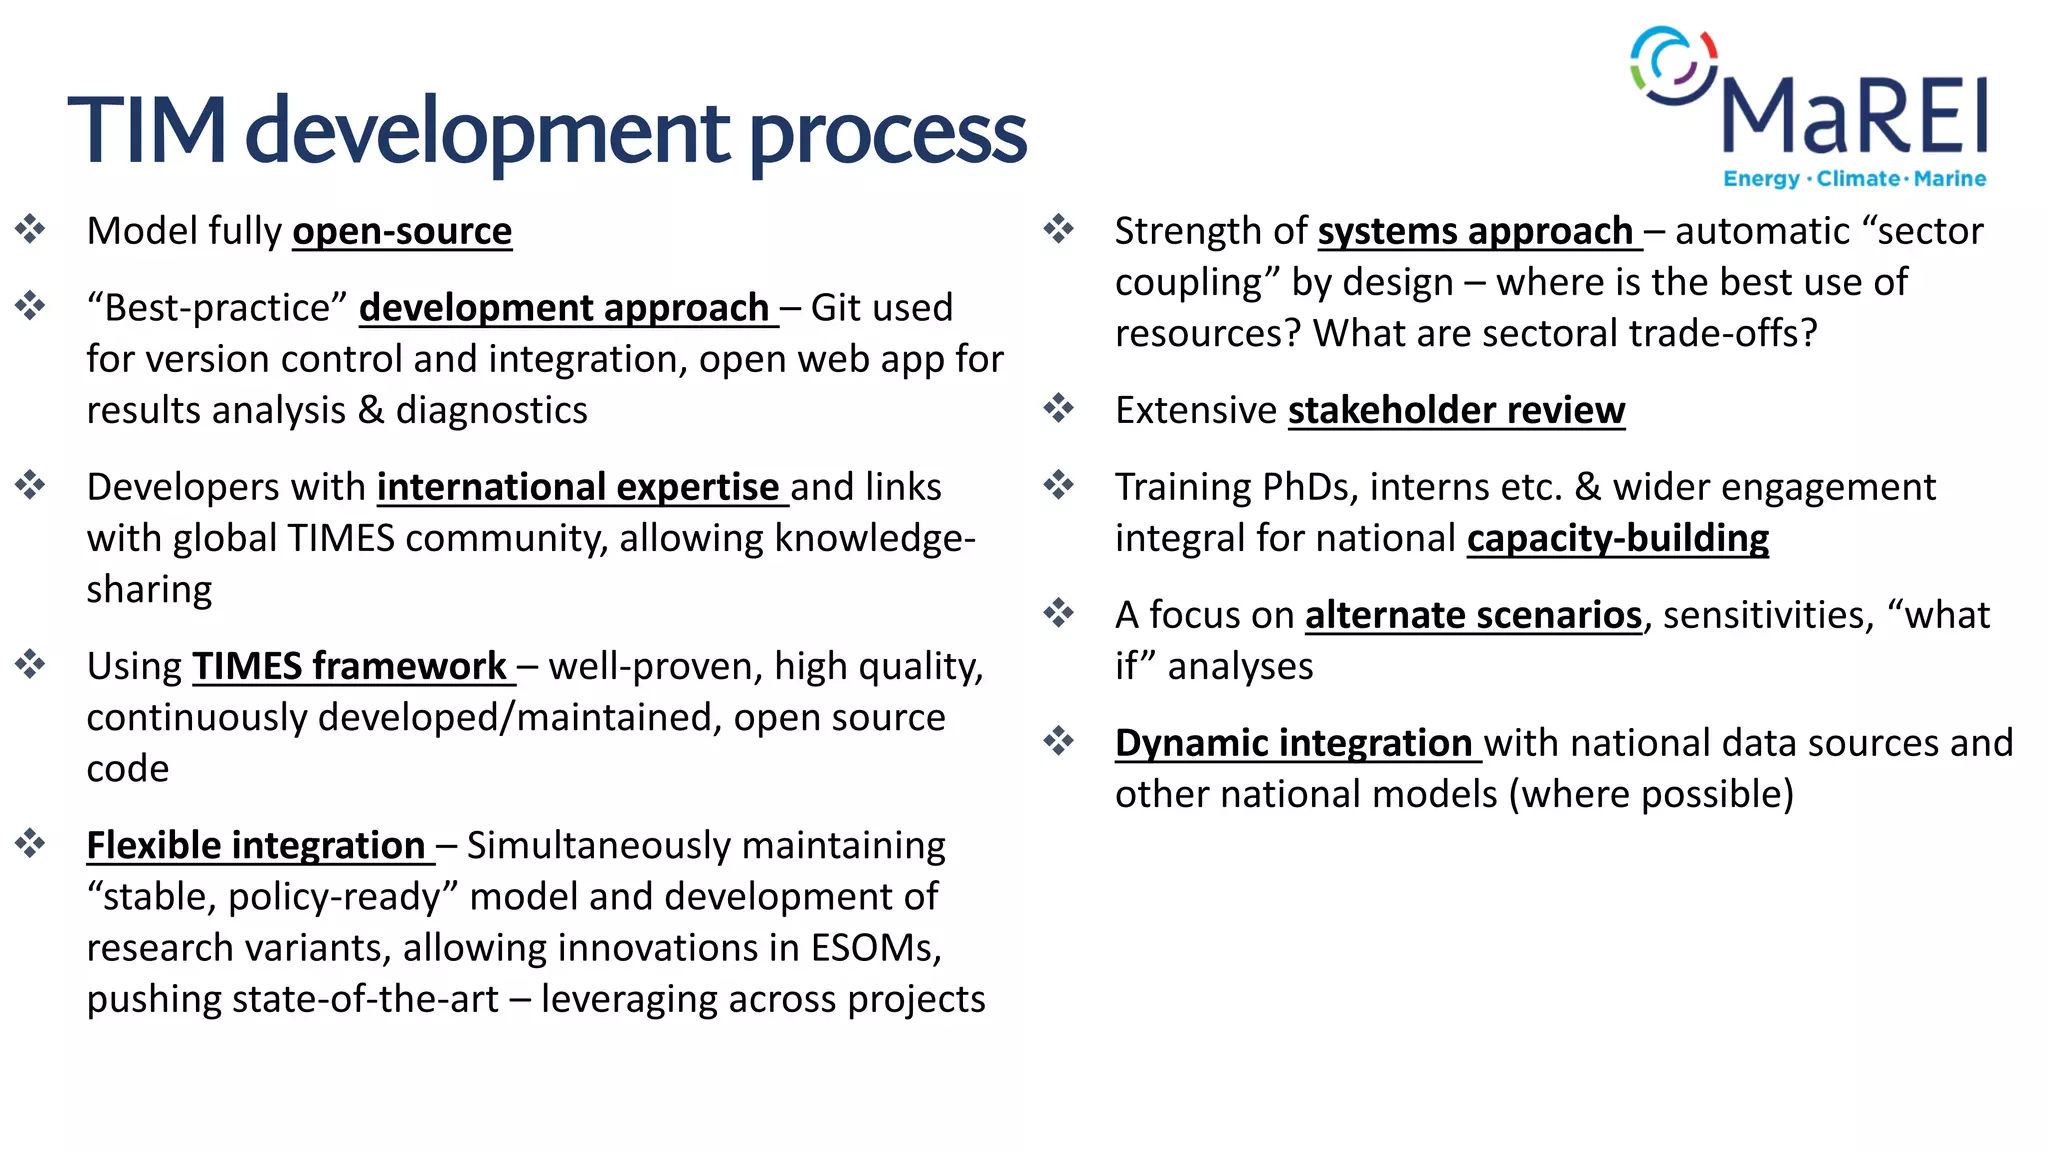
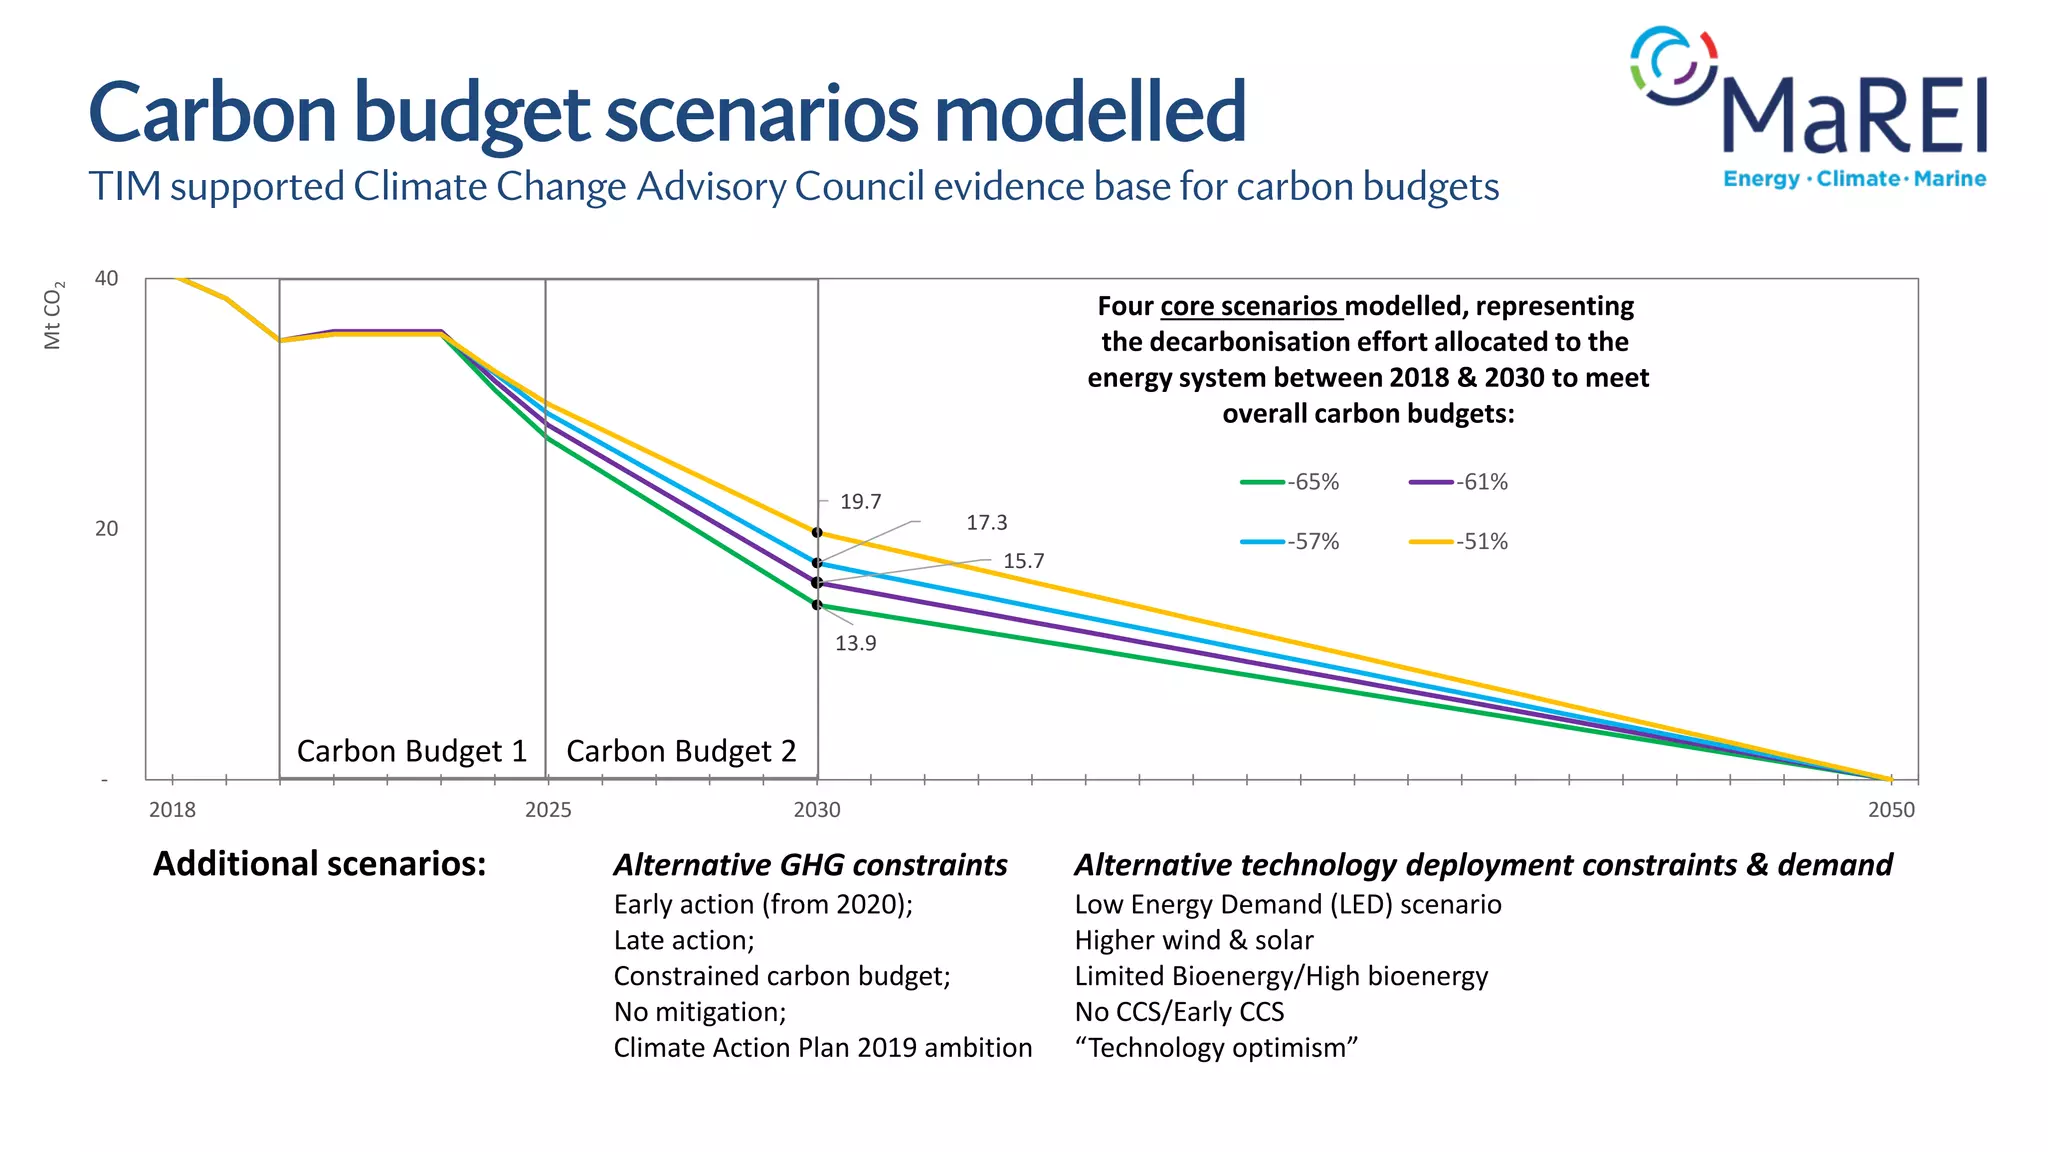
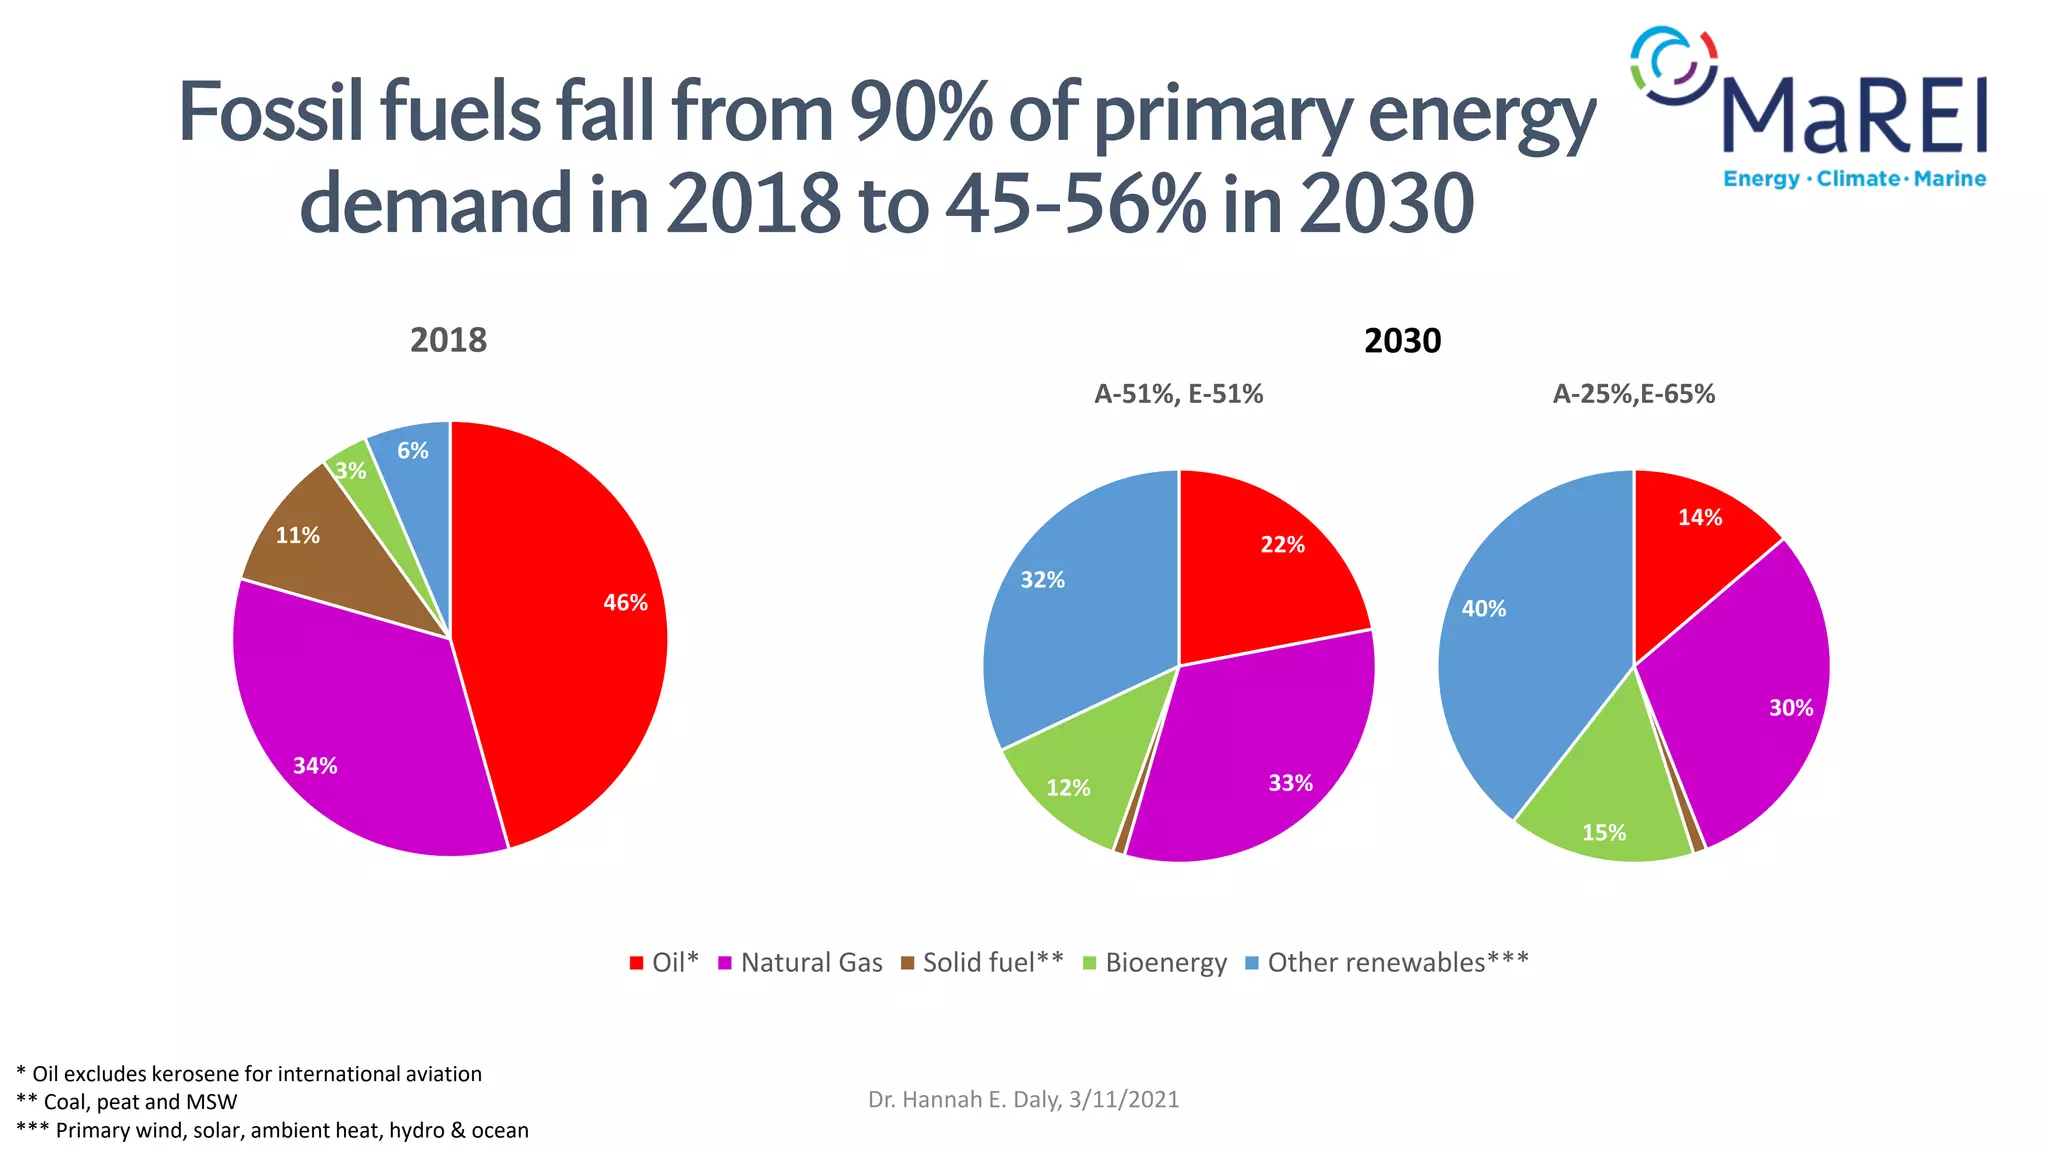
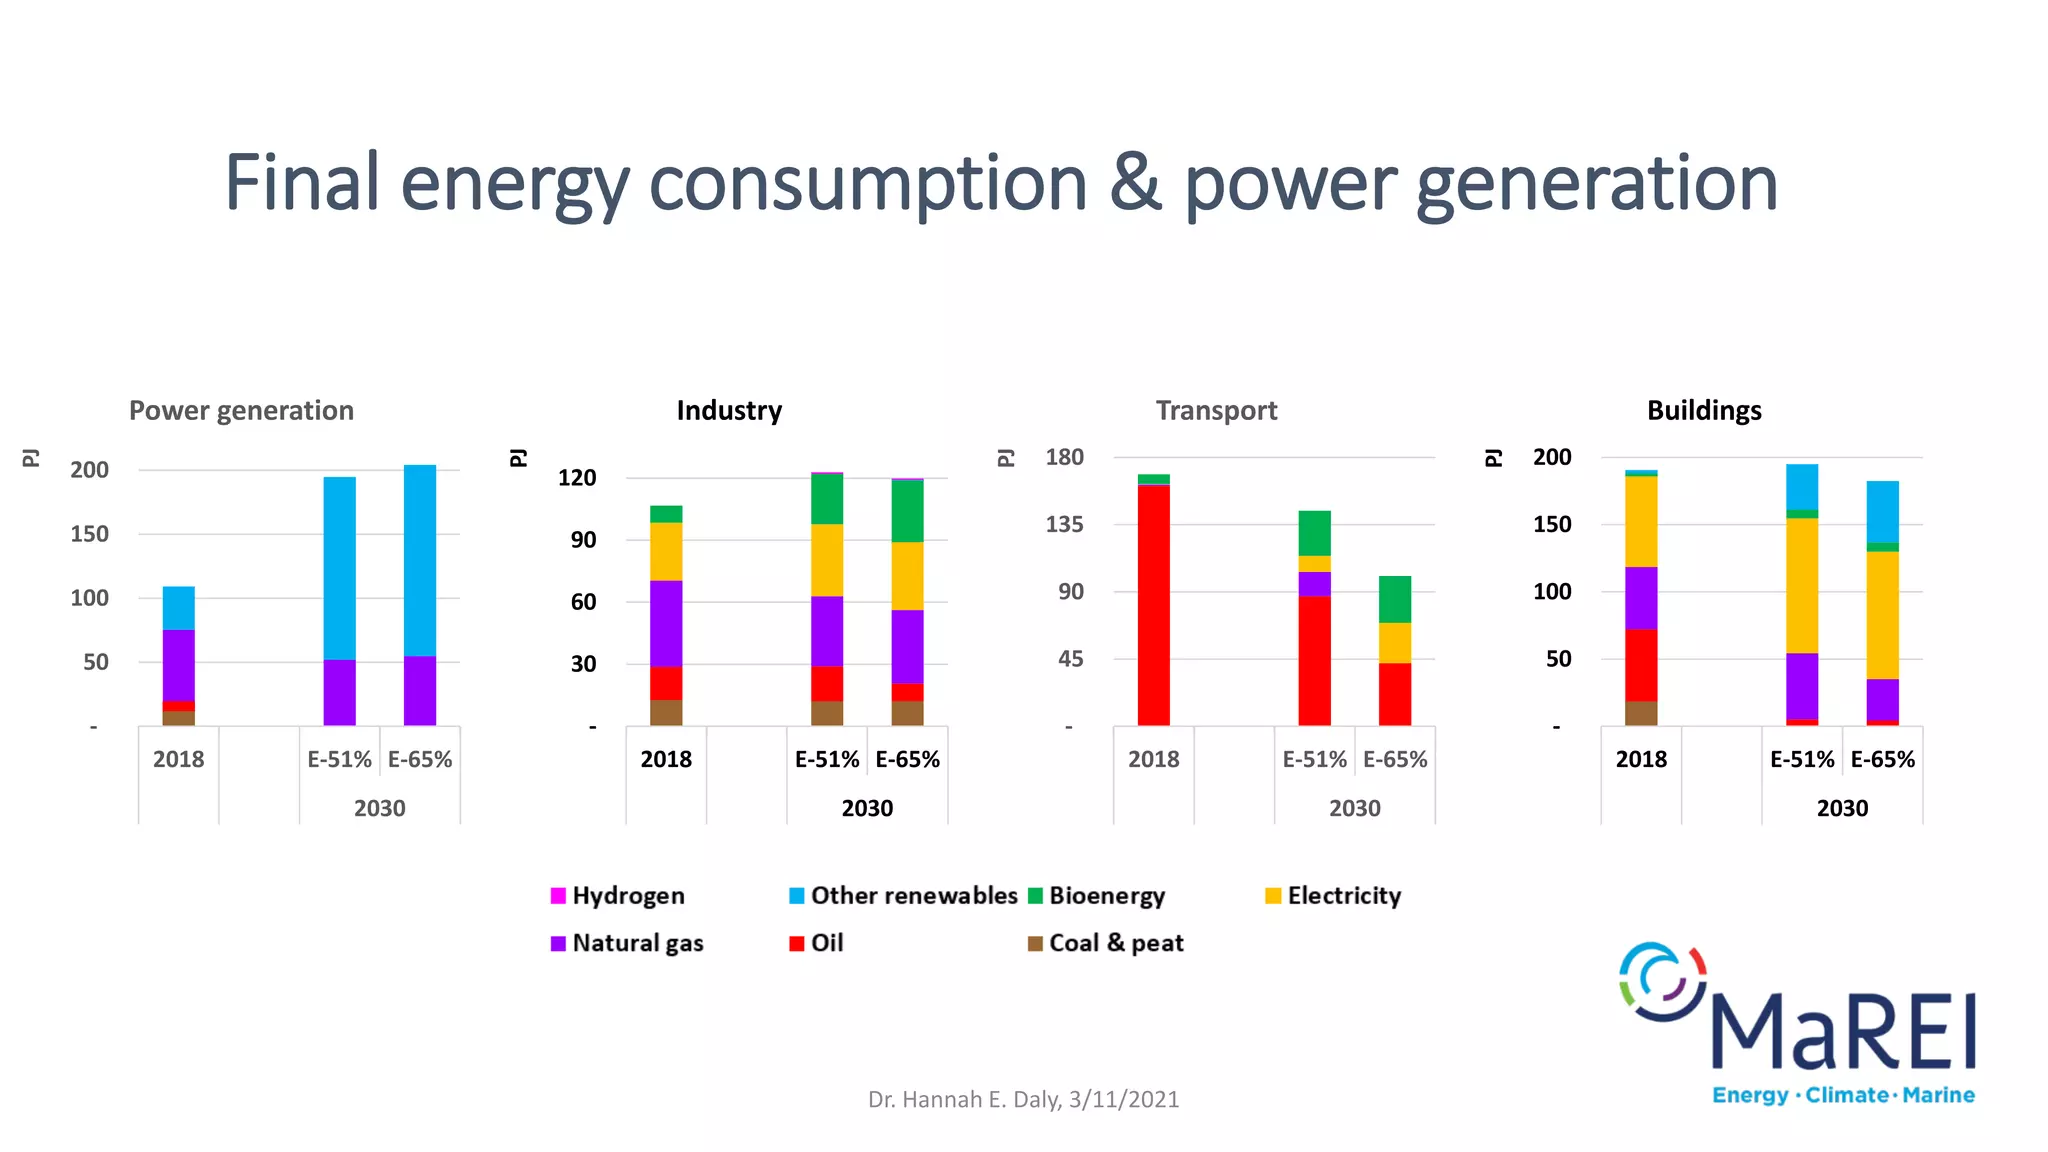
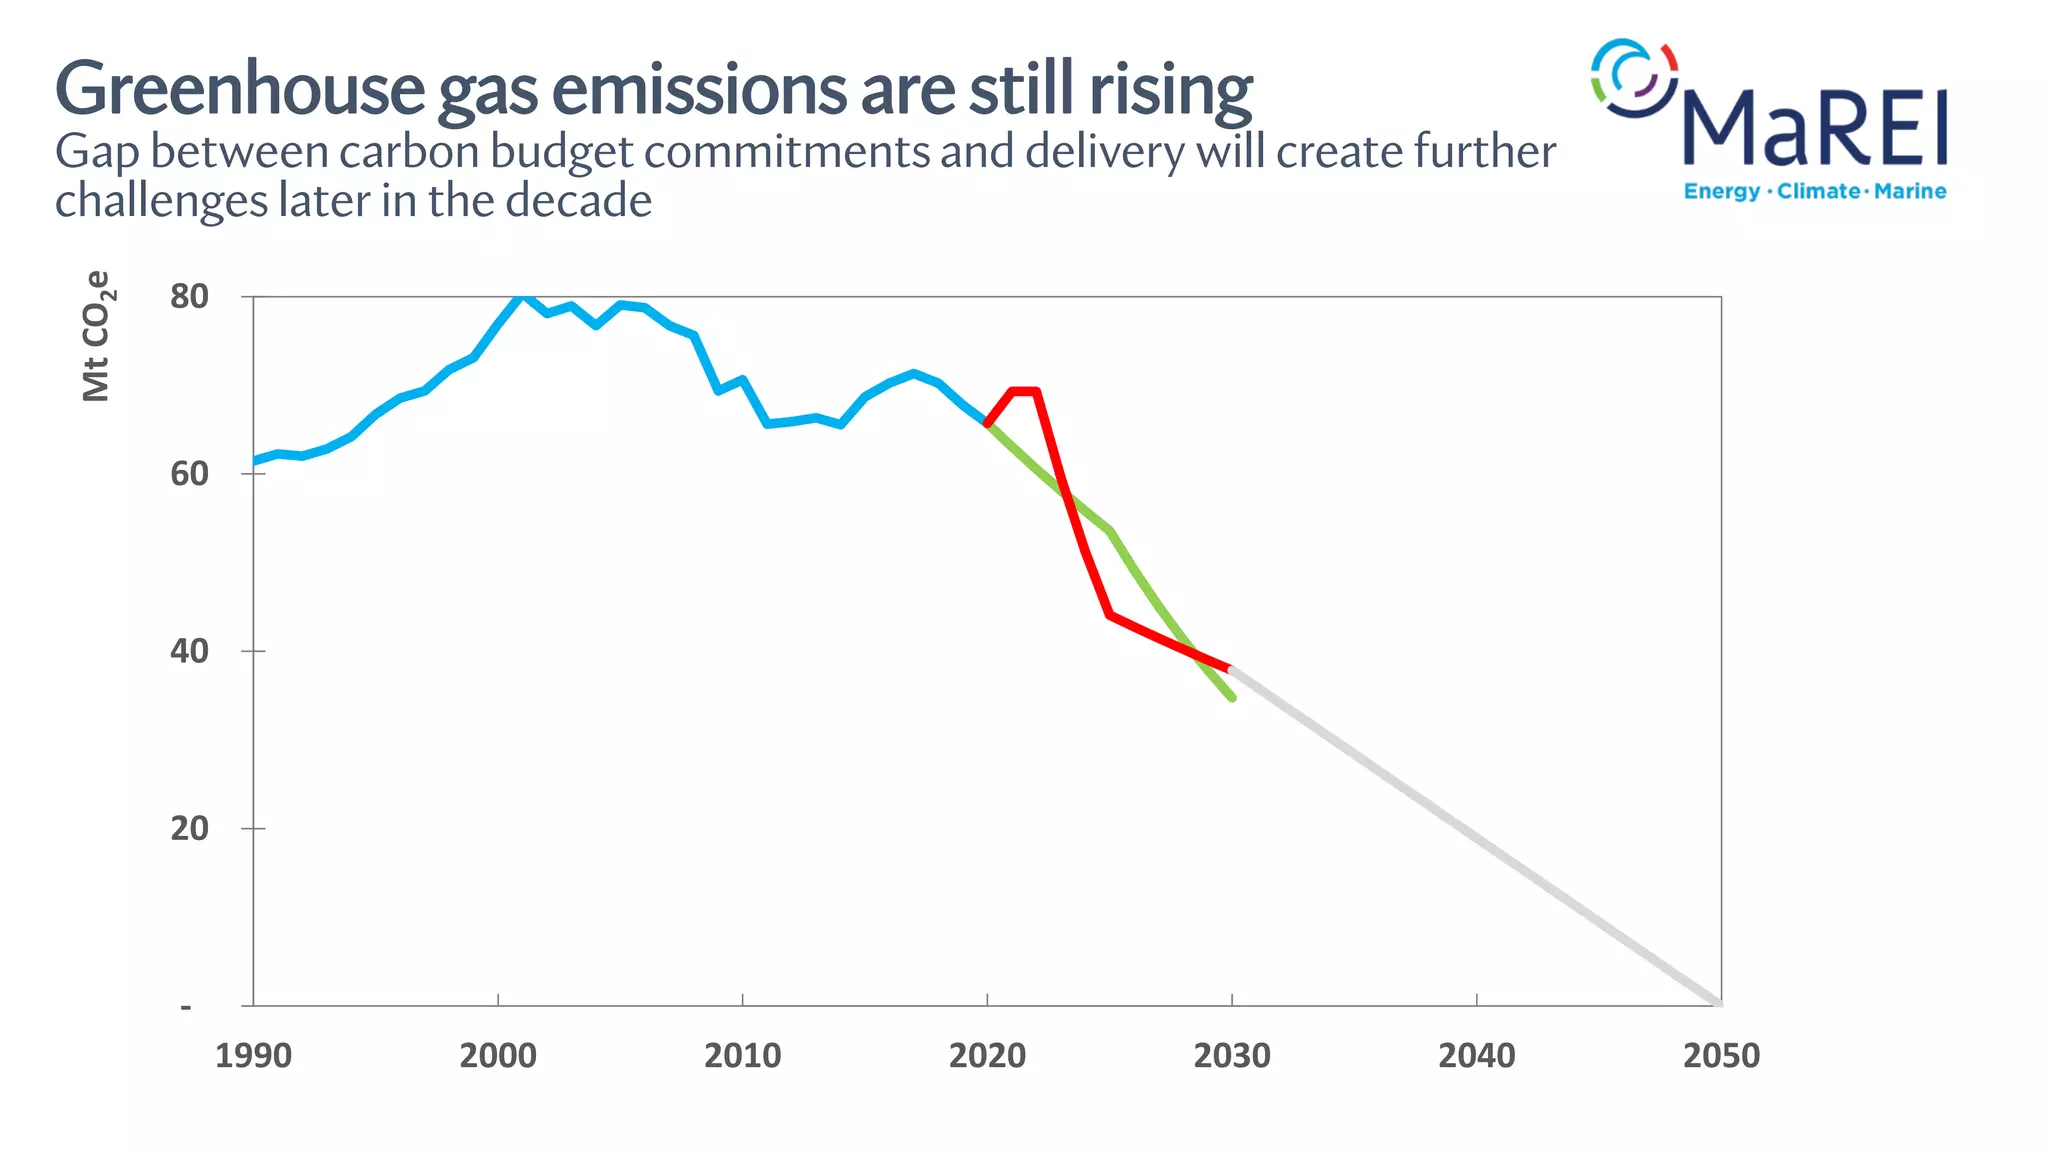
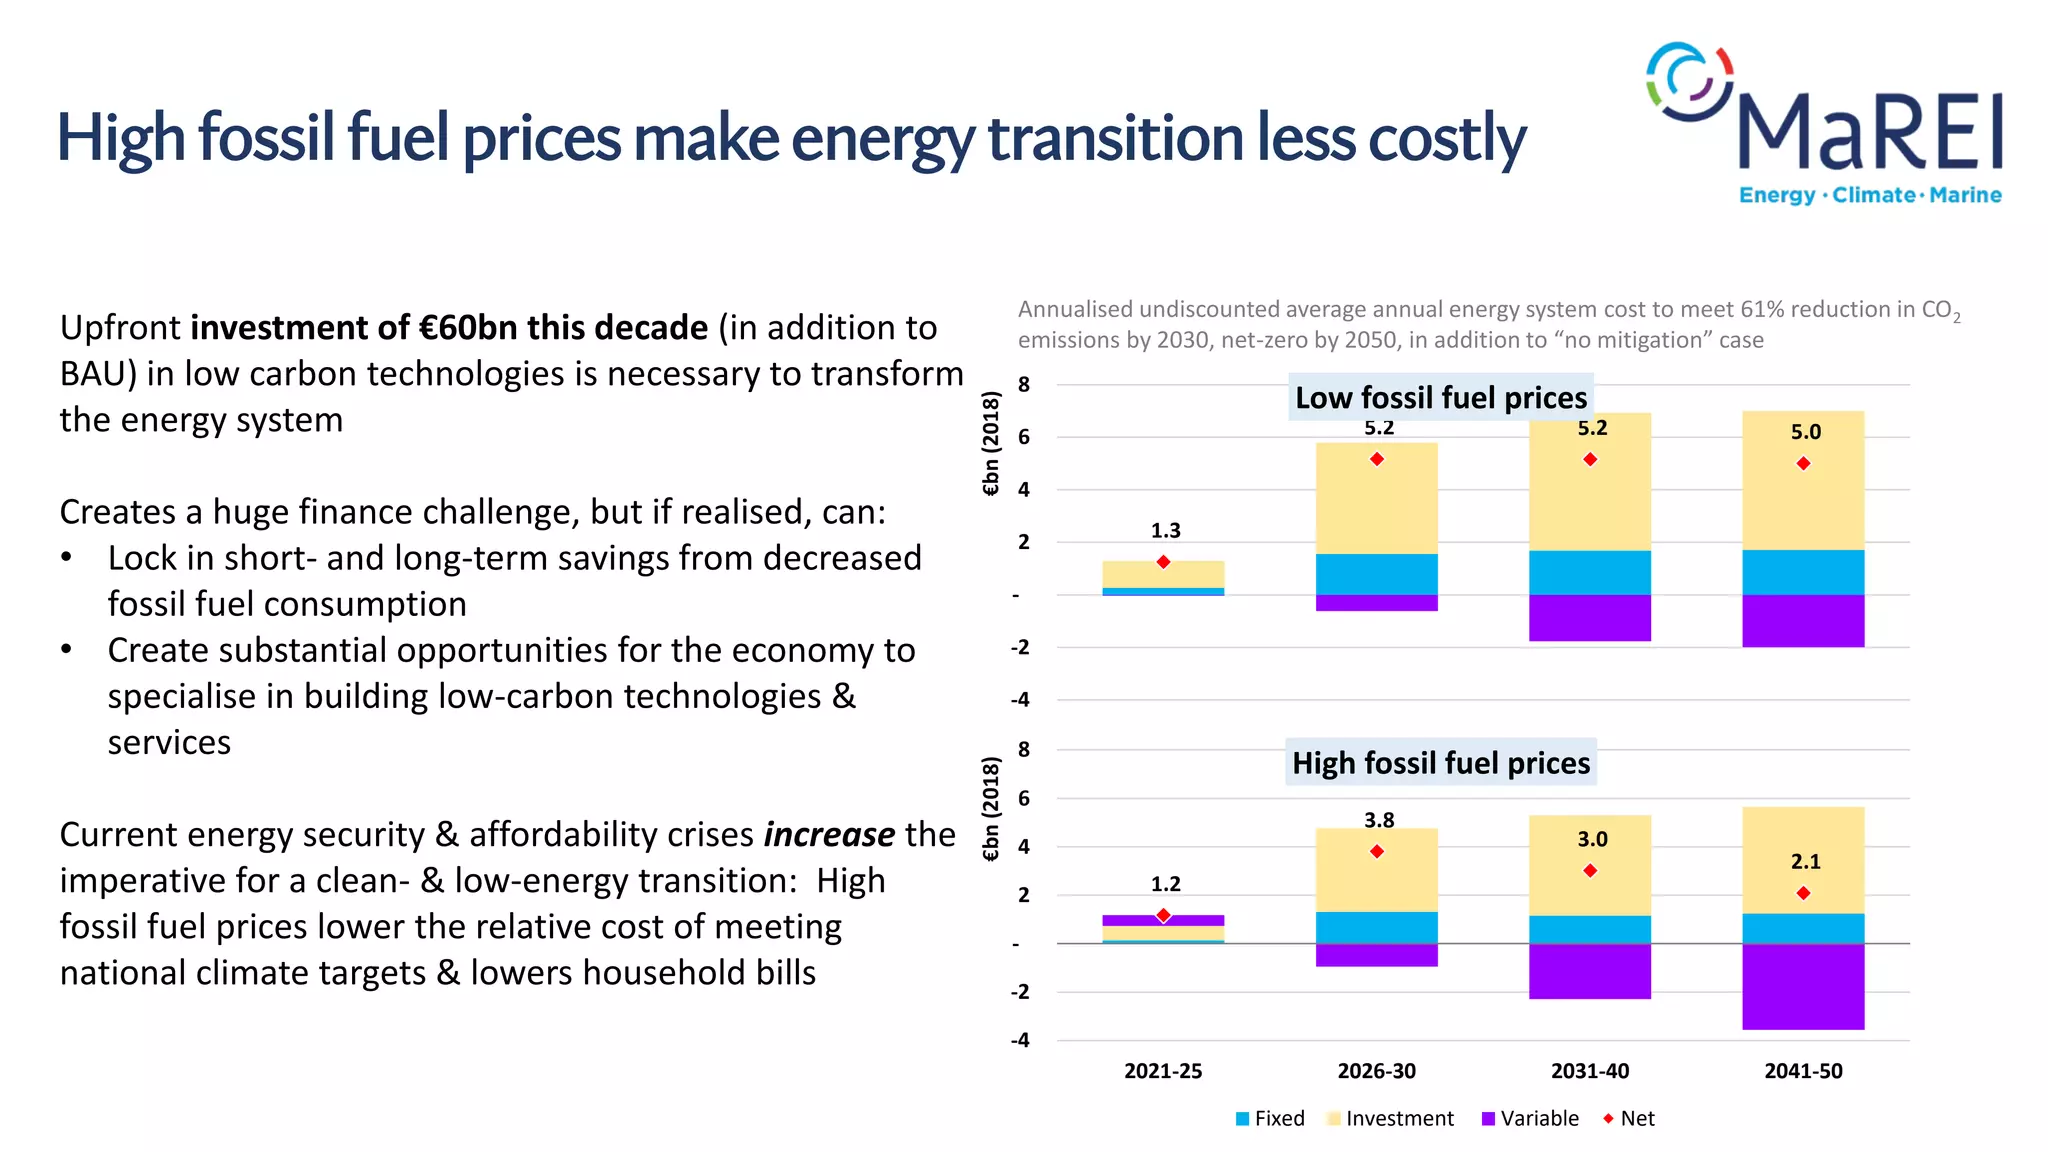
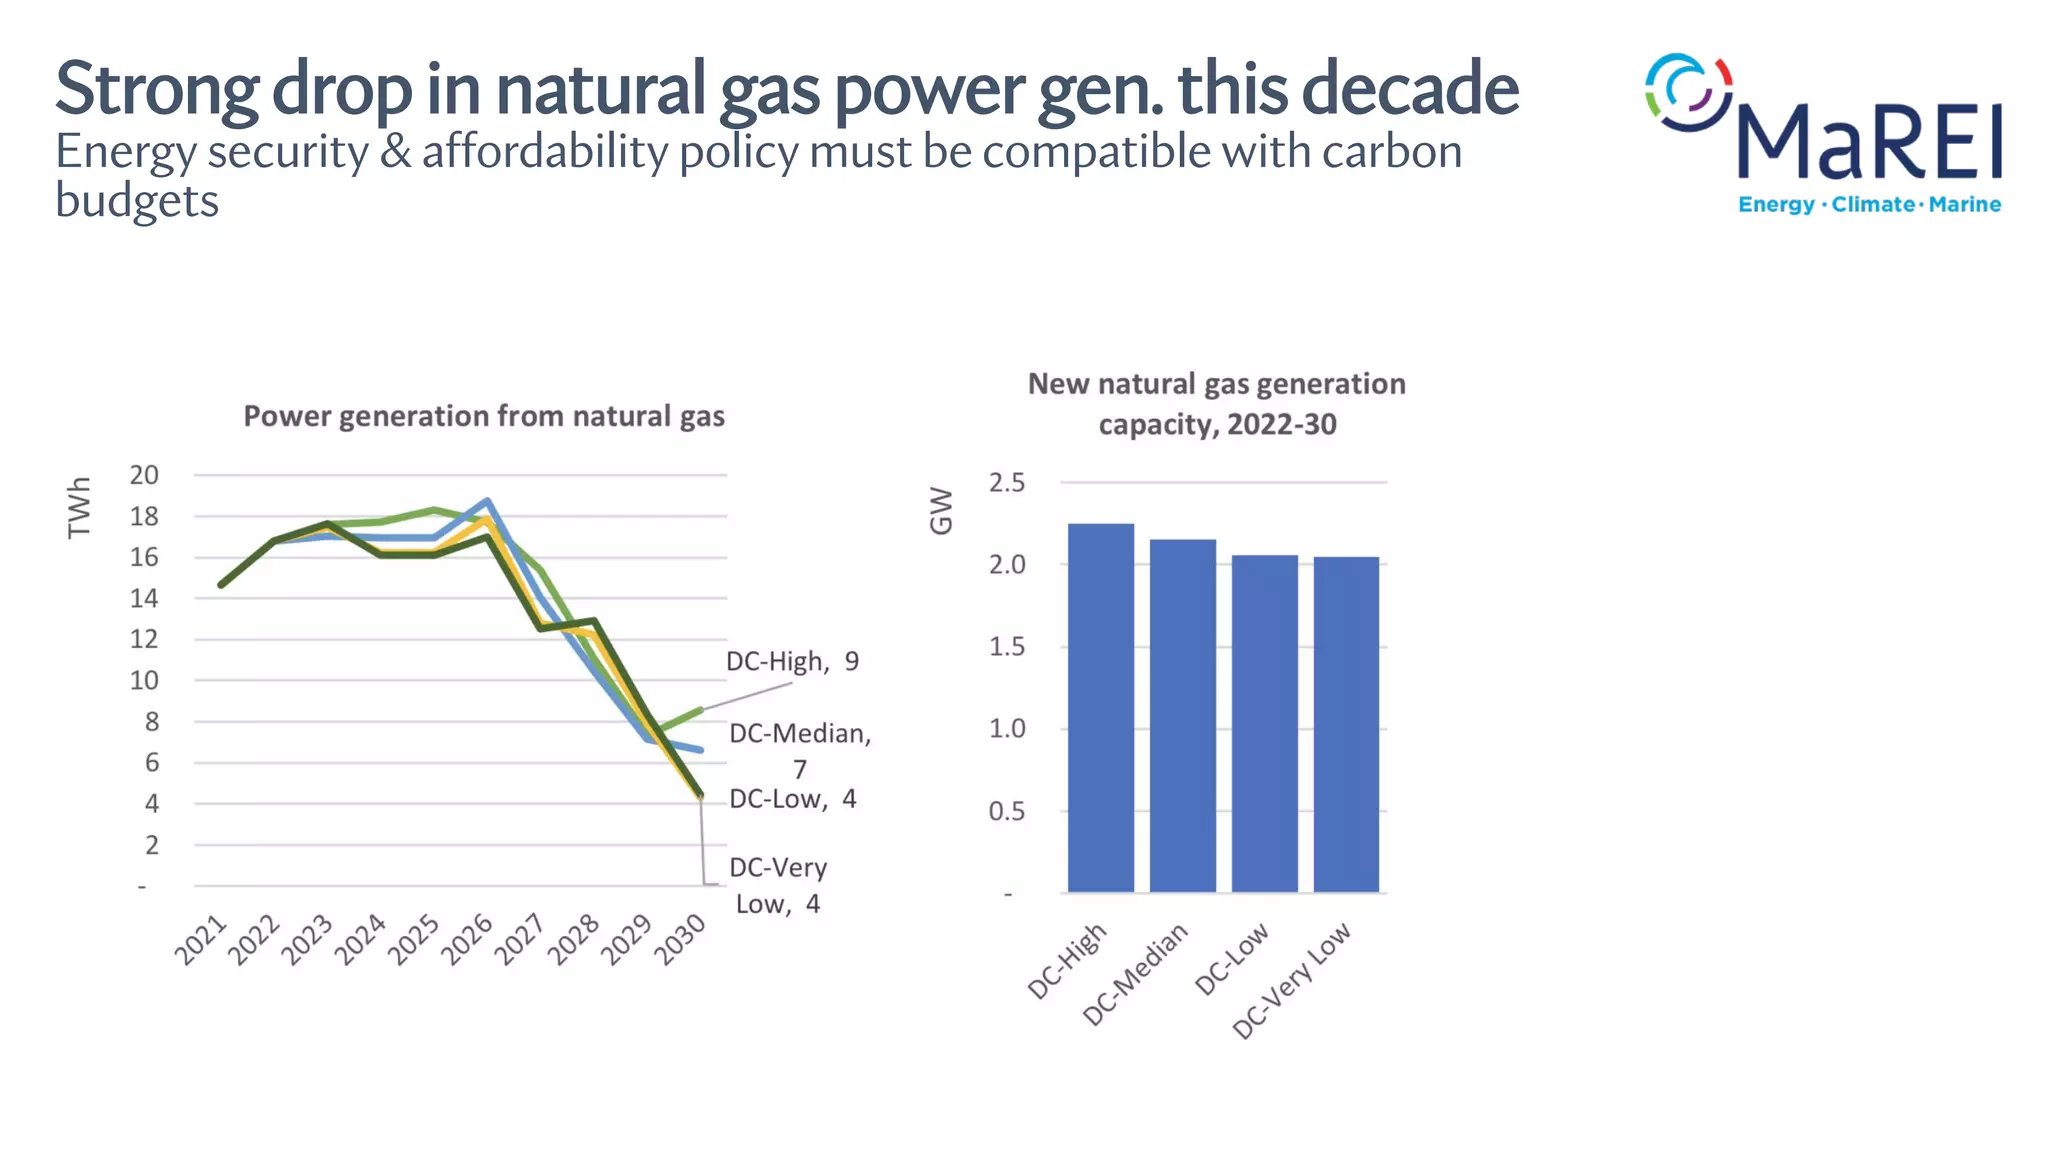
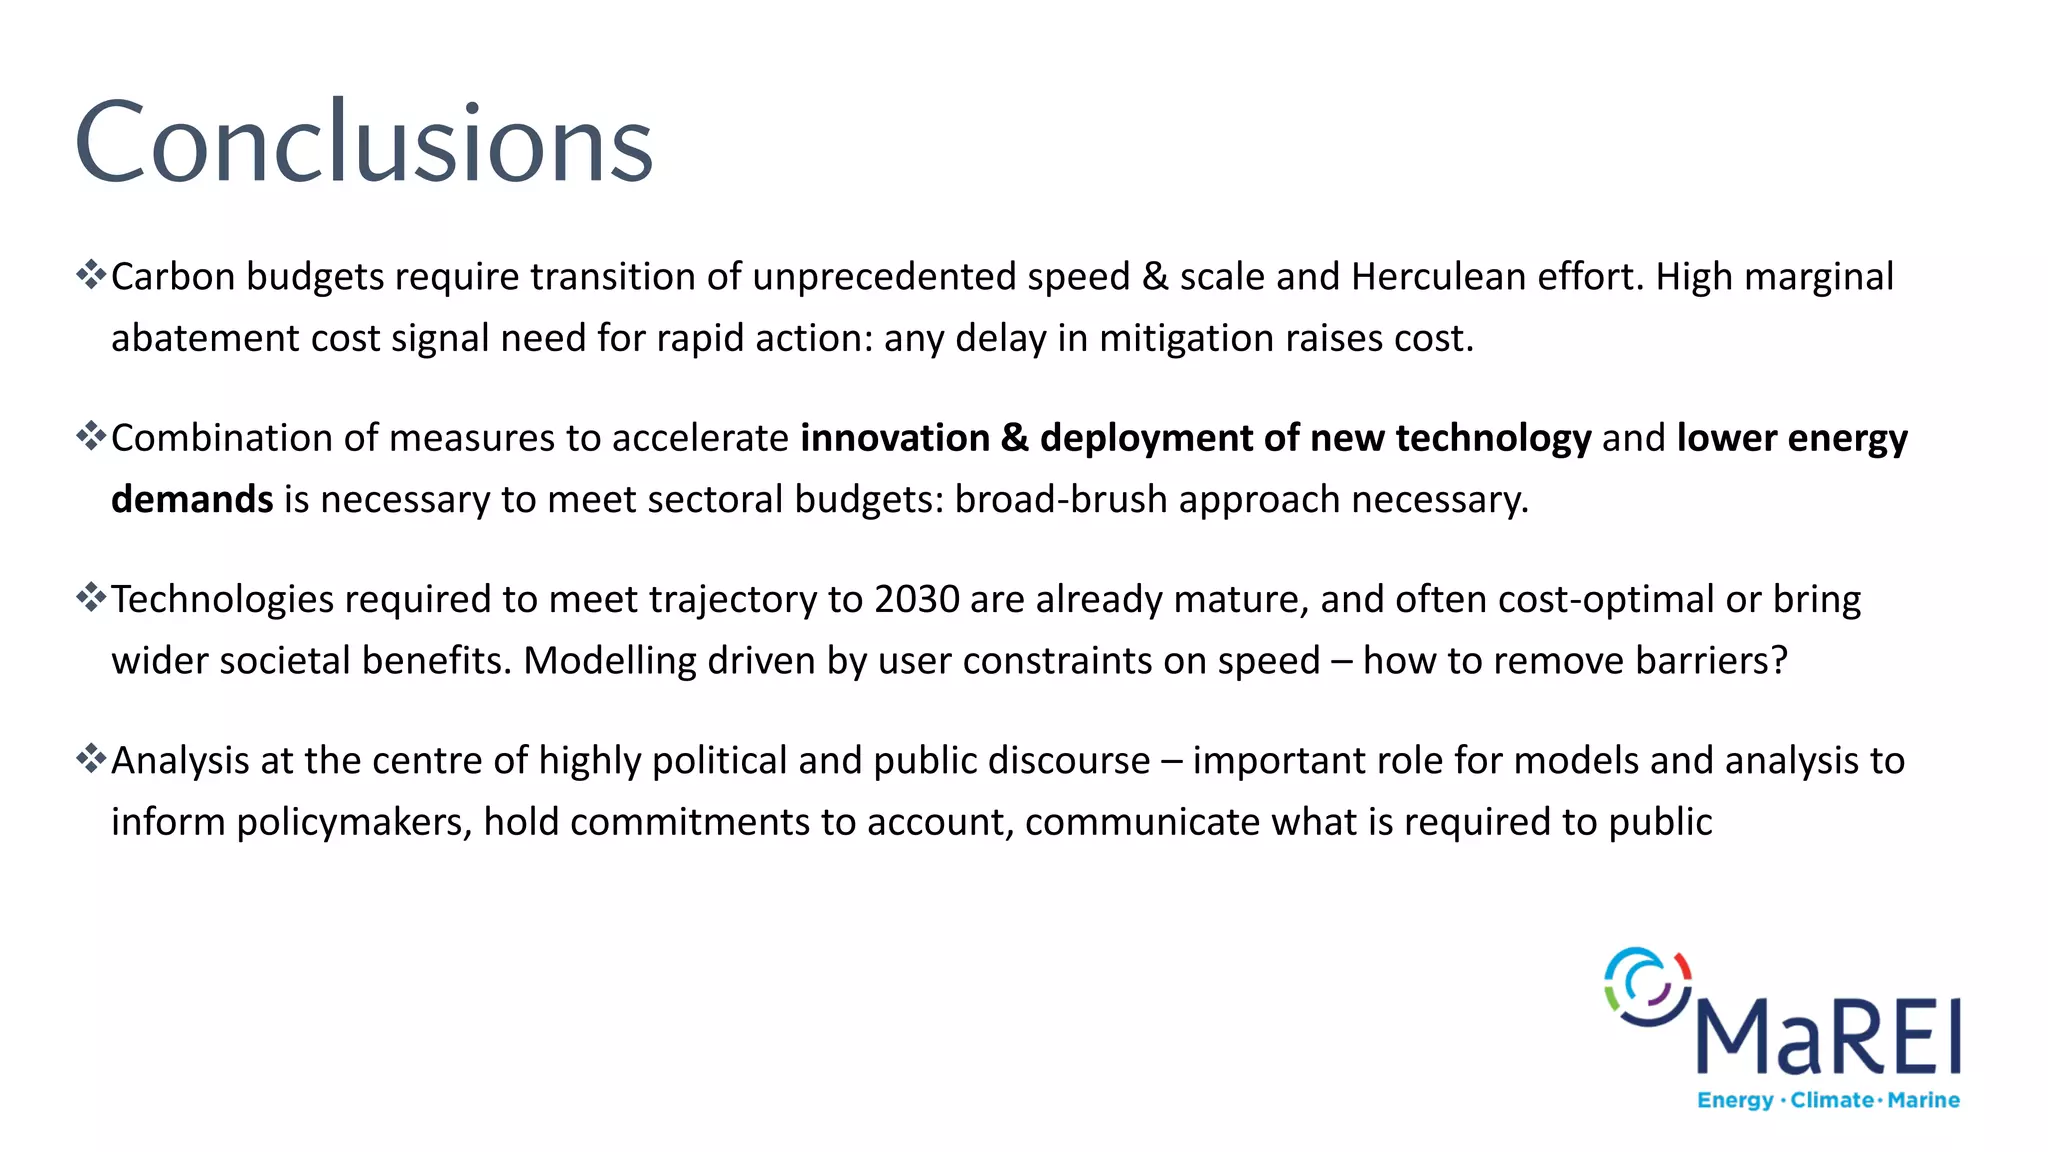

This document summarizes the use of the TIMES-Ireland Model (TIM) to analyze pathways for Ireland's energy transition and meet its climate targets. TIM is an open-source energy systems model that calculates optimal energy flows, investments, costs and emissions trajectories given policy constraints. Scenarios analyzed with TIM show that large investments in low-carbon technologies are needed this decade, but could lower costs over time. Meeting carbon budgets will require unprecedented transition speed across sectors. While technologies to meet 2030 targets are mature, barriers to deployment must be removed. TIM analysis aims to inform policy and hold Ireland accountable


