
Recommended
Recommended
More Related Content
What's hot
What's hot (9)
Similar to ANOVA Test on Renewable Energy Adoption
Similar to ANOVA Test on Renewable Energy Adoption (20)
More from A Makwana
More from A Makwana (20)
Recently uploaded
Recently uploaded (20)
ANOVA Test on Renewable Energy Adoption
- 2. International Conference on: “Engineering: Issues, opportunities and Challenges for Development” ISBN: 978-81-929339-3-1 09th April, 2016, S.N. Patel Institute of Technology & Research Centre, Umrakh, Bardoli 114 A STUDY ON VARIOUS PARAMETERS FOR RENEWABLE ENERGY RESOURCES ADOPTION USING THE ANOVA TEST THROUGH SPSS Ashish H. Makwana1 , Dr. Jayeshkumar R. Pitroda2 , Darsh R. Belani3 Assistant Professor, Civil Engineering Dept., Marwadi Education Foundation, Rajkot, Gujarat, India1 Assistant Professor, Civil Engineering Dept., B.V.M. Engineering College, Vallabh Vidyanagar, Gujarat, India2 Planning & Monitoring Engineer, Patel Infrastructural Pvt. Ltd, Ahmedabad, Gujarat, India3 Abstract: In Recent years, a lot of emphasis has been given to renewable, sustainable and environment friendly energy sources in order to offset the dependence of mankind on conventional and non-renewable sources of energy most of which are fossil based. However, the plethora of options available today makes it difficult for the users, policy makers as well as the researchers in this area to identify the right source for a specific situation as the usage and implementation depends on a variety of factors such as availability, ease of transportation, maintenance and end of-life options. Energy and environment are closely interlinked and therefore any alternative energy option brings with it a certain impact on the environment. Several terms such as „cradle to grave‟, „cradle to cradle‟, „cradle to gate‟ are used in this regard to denote the impacts at each stage of a product‟s life-cycle. This has led to a lack of understanding among the practitioners in this field and often leads to complicated situations where no agreement can be found over one single source of renewable energy. The integrated assessment of all environmental impacts from cradle to grave is the basis for many decisions relating to achieving improved products and services. This research paper presents an adoption of Renewable Energy Resources in current trends of Ahmedabad, Gandhinagar, Nadiad, Anand, Vadodara, and Surat. Data is collected through questionnaires and personal interviews targeting various category people. Statistical Package for the Social Sciences (SPSS) is adopted to evaluate the responses collected from the respondent by ANOVA test.
- 3. International Conference on: “Engineering: Issues, opportunities and Challenges for Development” ISBN: 978-81-929339-3-1 09th April, 2016, S.N. Patel Institute of Technology & Research Centre, Umrakh, Bardoli 115 Keywords: Researchers, Environment, Renewable Energy Component, Data, Statistical Package for the Social Sciences (SPSS) I. INTRODUCTION Renewable energy is generally defined as energy that is collected from resources which are naturally replenished on a human timescale, such as sunlight, wind, rain, tides, waves, and geothermal heat. Renewable energy often provides energy in four important areas: electricity generation, air and water heating/cooling, transportation, and rural energy services. II. TYPE OF RENEWABLE ENERGY RESOURCES (a) Solar power There are two basic categories of technologies that convert sunlight into useful forms of energy, First, solar photovoltaic (PV) modules convert sunlight directly in to electricity. Second, solar thermal power systems use focused solar radiation to produces team, which is then used to turn a turbine producing electricity. India is densely populated and has high solar insolation, an ideal combination for using solar power in India. Much of the country does not have an electrical grid, so one of the first applications of solar power has been for water pumping; to begin replacing India's four to five million diesel powered water pumps, each consuming about 3.5 kilowatts, and off-grid lighting. Some large projects have been proposed, and a 35,000 km² area of the Thar Desert has been set aside for solar power projects, sufficient to generate 700 to 2,100 gigawatts. (b) Wind power Wind has considerable potential as a global clean energy source, being both widely available, though diffuse, and producing no pollution during power generation. The development of wind power in India began in the 1990s, and has significantly increased in the last few years. Although a relative newcomer to the wind industry compared with Denmark or the US, domestic policy support for wind power has led India to become the country with the fifth largest installed wind power capacity in the world. As of December 2010 the installed capacity of wind power in India was 13,065.37 MW, mainly spread across Tamil Nadu (4132.72 MW), Maharashtra (1837.85 MW), Karnataka (1184.45 MW), Rajasthan (670.97
- 4. International Conference on: “Engineering: Issues, opportunities and Challenges for Development” ISBN: 978-81-929339-3-1 09th April, 2016, S.N. Patel Institute of Technology & Research Centre, Umrakh, Bardoli 116 MW), Gujarat (1432.71 MW), Andhra Pradesh (122.45 MW), Madhya Pradesh (187.69 MW), Kerala (23.00 MW), West Bengal (1.10 MW), other states (3.20 MW). Wind power accounts for 6% of India's total installed power capacity. (c) Biomass Energy Biomass is the term used for all organic material originating from plants (including algae), trees and crops and is essentially the collection and storage of the sun’s energy through photosynthesis. Biomass energy, or Bioenergy, is the conversion of biomass into useful forms of energy such as heat, electricity and liquid fuels. (d) Hydropower Hydropower is the largest renewable resource used for electricity. It plays an essential role in many regions of the world with more than 150 countries generating hydroelectric power. Small, mini and micro hydro plants (usually defined as plants less than 10 MW, 2 MW and100kW, respectively) also play a key role in many countries like India for rural electrification. (e) Geothermal Energy Geothermal energy, the natural heat within the earth, arises from the ancient heat remaining in the Earth's core, from friction where continental plates slide beneath each other, and from the decay of radioactive elements that occur naturally in small amounts in all rocks. The amount of geothermal energy is enormous. Scientists estimate that just 1 percent of the heat contained in just the uppermost 10 kilometers of the earth’s crust is equivalent to 500 times the energy contained in all of the earth's oil and gas resources. Yet, heat is present in practically inexhaustible quantities, it is unevenly distributed, seldom concentrated and often at depths too great to be exploited industrially and economically.
- 5. International Conference on: “Engineering: Issues, opportunities and Challenges for Development” ISBN: 978-81-929339-3-1 09th April, 2016, S.N. Patel Institute of Technology & Research Centre, Umrakh, Bardoli 117 III. STATISTICAL PACKAGE FOR THE SOCIAL SCIENCES (SPSS) (a) SPSS: Statistical Package for the Social Sciences The “Statistical Package for the Social Sciences” (SPSS) is a package of programs for manipulating, analyzing, and presenting data; the package is widely used in the social and behavioral sciences. It is developed by Norman H. Nie and C. Hadlai Hull of International Business Machines (IBM) Corporation in the year 1968. There are several forms of SPSS. The core program is called SPSS Base and there are a number of features that extend the range of data entry, statistical, or reporting capabilities. (b) Area of Application Project management Human research management Telecommunications Finance Insurance Healthcare Manufacturing Retail Higher education Government Market research (c) Features of SPSS It is easy to learn and use. It includes a full range of data, management system and editing tools. It provides in-depth statistical capabilities.
- 6. International Conference on: “Engineering: Issues, opportunities and Challenges for Development” ISBN: 978-81-929339-3-1 09th April, 2016, S.N. Patel Institute of Technology & Research Centre, Umrakh, Bardoli 118 IV. METHODOLOGY Various parameters that effect on Renewable Energy Resources are found out such as energy efficiency, renewable energy solutions, demand-supply gap, application, scope, global energy consumption. Data is collected through questionnaires and personal interviews targeting Farmers, BPL families to Rich family’s people and many other categories are considered such as Education, Job criteria, people having No Education, Primary-Secondary Education to Ph.D., people pursuing Education, Teacher, Worker, Manager and Housewife/Retired. So, opinion may not get biased approach on Renewable Resources’ adoption. Data analysis is done by ANOVA test using Microsoft Excel and Statistical Package for the Social Sciences (SPSS) software. Different regions of Gujarat state are considered in this study for survey based analysis, such as Ahmedabad, Gandhinagar, Nadiad, Anand, Vadodara, and Surat. V. OBJECTIVES To study, whether Renewable Energy Resources should be adopted OR Not. VI. HYPOTHESIS (a) Null Hypothesis (H0) There is no difference between adoptions of Renewable Energy Resource users in recent trends. [Signification level (α) ≤ 0.05] (b) Alternative Hypothesis (H1) There is difference between adoptions of Renewable Energy Resource users in recent trends. [Signification level (α) > 0.05] VII. ANOVA TEST (a) About ANOVA TEST Analysis of variance (ANOVA) tests the hypothesis that the means of two or more populations are equal. ANOVAs assess the importance of one or more factors by comparing the response variable means at the different factor levels. The null hypothesis states that all population means (factor level means) are equal while the alternative hypothesis states that at least one is different.
- 7. International Conference on: “Engineering: Issues, opportunities and Challenges for Development” ISBN: 978-81-929339-3-1 09th April, 2016, S.N. Patel Institute of Technology & Research Centre, Umrakh, Bardoli 119 To perform an ANOVA, researchers must have a continuous response variable and at least one categorical factor with two or more levels. ANOVAs require data from approximately normally distributed populations with equal variances between factor levels. However, ANOVA procedures work quite well even if the normality assumption has been violated, unless one or more of the distributions are highly skewed or if the variances are quite different. Transformations of the original dataset may correct these violations. For example, researchers design an experiment to assess the durability of four experimental carpet products. Researchers put a sample of each carpet type in ten homes and researchers measure durability after 60 days. Because researchers are examining one factor (carpet type) researchers use a one-way ANOVA. If the p-value is less than your alpha, then you conclude that at least one durability mean is different. The name “Analysis of variance” is based on the approach in which the procedure uses variances to determine whether the means are different. The procedure works by comparing the variance between group means versus the variance within groups as a way of determining whether the groups are all part of one larger population or separate populations with different characteristics. (b) Assumptions of ANOVA test The expected values of the errors are zero. The variances of all errors are equal to each other. The errors are independent. They are normally distributed. (c) Logic of ANOVA test The calculations of ANOVA can be characterized as computing a number of means and variances, dividing two variances and comparing the ratio to a handbook value to determine statistical significance. Calculating a treatment effect is then trivial, “the effect of any treatment is estimated by taking the difference between the mean of the observations which receive the treatment and the general mean.
- 8. International Conference on: “Engineering: Issues, opportunities and Challenges for Development” ISBN: 978-81-929339-3-1 09th April, 2016, S.N. Patel Institute of Technology & Research Centre, Umrakh, Bardoli 120 VIII. DATA ANALYSIS & DATA INTERPRETATION Table I ANOVA – AGE [Table I (a)] Parameters Source of variation Sum of Squares Degree of freedom Mean Square F P Between Groups 18.046 4 4.512 2.525 0.049 Within Groups 98.287 55 1.787 Total 116.333 59 a. Do you know what renewable energy is? 1. Yes, very much, 2. No, 3. Not much, 4. To a limited extent, 5. Can’t Say Aware or Not? Critical Region is F > 2.55 Table-I (a) suggests that each class of Age of people is at least aware about renewable energy. [Table I (b)] Between Groups 12.896 4 3.224 2.335 0.05 Within Groups 75.954 55 1.381 Total 88.85 59 b. Can renewable energy solutions lead to a fairer distribution of the World's richest? 1. Yes, very much, 2. No, 3. Not much, 4. To a limited extent, 5. Can’t Say Can Renewable Energy differentiate any countries Richness? Critical Region is F > 2.55 Table-I (b) suggests that each age people consider R.E.’s part in development of any countries richness. [Table I (c)] Between Groups 9.71 4 2.428 2.002 0.041 Within Groups 66.69 55 1.213 Total 76.4 59 c. Will Renewable Energy help in reduction of over dependence on other energy resources? 1. Yes, very much, 2. No, 3. Not much, 4. To a limited extent, 5. Can’t Say Reduction in Dependence on other energy sources? Critical Region is F > 2.55 Table-I (c) suggests that renewable energy will play crucial part in reduction in over dependence on energy sources like Nuclear, Coal, etc.
- 9. International Conference on: “Engineering: Issues, opportunities and Challenges for Development” ISBN: 978-81-929339-3-1 09th April, 2016, S.N. Patel Institute of Technology & Research Centre, Umrakh, Bardoli 121 [Table I (d)] Between Groups 4.107 4 1.027 2.433 0.046 Within Groups 23.226 55 0.422 Total 27.333 59 d. Will Renewable Energy provide better access of electricity to rural regions? 1. Yes, 2. Up to some extent, 3. No, 4. Can’t Say Better access to electricity by rural regions? Critical Region is F > 2.55 Table-I (d) suggests that renewable energy will provide better access to electricity to rural regions. Table II ANOVA – EDUCATION [Table II (a)] Parameters Source of variation Sum of Squares Degree of freedom Mean Square F P Between Groups 13.181 4 3.295 2.395 0.05 Within Groups 75.669 55 1.376 Total 88.85 59 a. Can renewable energy solutions lead to a fairer distribution of the World's richest? Can Renewable Energy differentiate any countries Richness? Critical Region is F > 2.55 Table-II (a) suggests that Renewable Energy can differentiate any countries richness/development up to some extent. [Table II (b)] Between Groups 0.571 4 0.143 1.014 0.049 Within Groups 7.763 55 0.141 Total 8.333 59 Application of Solar Panels in your home b. Would you consider the application of Solar Panels to utilize solar energy in power generation for your Household power needs? 1. Yes, 2. No, 3. To a limited extent, 4. Can’t Say Critical Region is F > 2.55 Table-II (b) suggests that Solar panels should be adopted at home for power generation.
- 10. International Conference on: “Engineering: Issues, opportunities and Challenges for Development” ISBN: 978-81-929339-3-1 09th April, 2016, S.N. Patel Institute of Technology & Research Centre, Umrakh, Bardoli 122 [Table II (c)] Between Groups 10.082 4 2.521 2.09 0.042 Within Groups 66.318 55 1.206 Total 76.4 59 Reduction in Dependence on other energy sources c. Will Renewable Energy help in reduction of over dependence on other energy resources? 1. Yes, very much, 2. No, 3. Not much, 4. To a limited extent, 5. Can’t Say Critical Region is F > 2.55 Table-II (c) suggests that Renewable Energy will help in reduction of over dependence on other energy resources. Table III ANOVA – GENDER [Table III (a)] Question Source of variation Sum of Squares Degree of freedom Mean Square F P Between Groups 0.533 1 0.533 0.512 0.048 Within Groups 60.45 58 1.042 Total 60.983 59 Energy Efficiency at Home a. How important do you think it is to improve the energy efficiency of your home? 1. Unimportant, 2. Important, 3. Very important, 4. Quite Important, 5. Can’t Say [Table III (b)] Between Groups 2.408 1 2.408 2.48 0.05 Within Groups 56.325 58 0.971 Total 58.733 59 Hot water source b. What is your hot water source? 1. Gas Geyser, 2. Electric Geyser, 3. Solar Heater, 4. Other
- 11. International Conference on: “Engineering: Issues, opportunities and Challenges for Development” ISBN: 978-81-929339-3-1 09th April, 2016, S.N. Patel Institute of Technology & Research Centre, Umrakh, Bardoli 123 [Table III (c)] Between Groups 0.408 1 0.408 0.439 0.05 Within Groups 53.925 58 0.93 Total 54.333 59 Cooking Source c. What do you use for cooking? 1. Electricity, 2. Gas, 3. Solid Fuel, 4. Solar Cooker with combination of allabove Critical Region is F > 4.008 Table-III (a, b, and c) states that all gender considers energy efficiency at home, Hot water source as Solar Water Heater & Cooking Source partly as Solar Cooker. Table IV ANOVA JOB FACTOR [Table IV (a)] Question Source of variation Sum of Squares Degree of freedom Mean Square F P Between Groups 3.715 4 0.929 0.69 0.05 Within Groups 74.019 55 1.346 Total 77.733 59 a. If there was a grant available, would it encourage you to improve the energy efficiency of your home? 1. Yes, 2. No, 3. Up to some extent, 4. Don’t know, 5. Can’t Say Adopt or not if Grant is Available Critical Region is F > 2.55 Table-IV (a) suggests that Renewable Energy should be adopted if grant is available. [Table IV (b)] Between Groups 6.356 4 1.589 1.822 0.05 Within Groups 47.978 55 0.872 Total 54.333 59 b. What do you use for cooking? 1. Electricity, 2. Gas, 3. Solid Fuel, 4. Solar Cooker with combination of all above Cooking Source Critical Region is F > 2.55
- 12. International Conference on: “Engineering: Issues, opportunities and Challenges for Development” ISBN: 978-81-929339-3-1 09th April, 2016, S.N. Patel Institute of Technology & Research Centre, Umrakh, Bardoli 124 Table-IV (b) suggests that Renewable Energy like Solar Cooker or Solar Powered Electric Sources may help as cooking source, which will consequently reduce the lack of gas as cooking source. [Table IV (c)] Between Groups 0.356 4 0.089 0.614 0.05 Within Groups 7.978 55 0.145 Total 8.333 59 Application of Solar Panels in your home c. Would you consider the application of Solar Panels to utilize solar energy in power generation for your Household power needs? 1. Yes, 2. No, 3. To a limited extent, 4. Can’t Say Critical Region is F > 2.55 Table-IV (c) suggests that solar panels should be adopted at home for power generation. Table IV F-RATIO VALUES
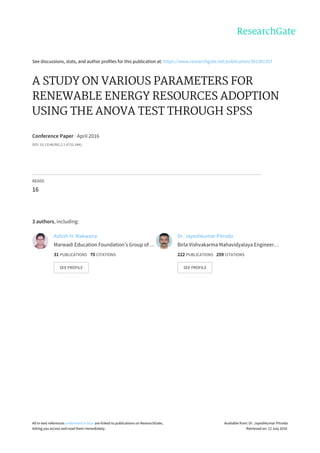
- 13. International Conference on: “Engineering: Issues, opportunities and Challenges for Development” ISBN: 978-81-929339-3-1 09th April, 2016, S.N. Patel Institute of Technology & Research Centre, Umrakh, Bardoli 125 Figure 1: Critical region IX. CONCLUSION Following conclusions are drawn after analysing the survey collected data by ANOVA test: a) ANOVA test can be used in cases where there are more than two groups. b) The F-ratio values do not lie in the critical region. Thus, there is no evidence, at the 5% significance level, to suggest no difference between adoptions of Renewable Energy Resource users in recent trends. So, Null Hypothesis cannot be rejected and renewable energy can be adopted. REFERENCES [1] A. H. Makwana, Dr. J. R. Pitroda, D. S. Chokshi, Comparative Analysis Approach towards Clay Bricks and Fly Ash Bricks by Independent Samples T-test through SPSS, 14th International Conference on Bio- technology, Civil and Chemical Engineering (ICBCCE 2016), ISBN: 978-93-85225-58-1, 10th January, 2016, pg. 1 – 6, Bangalore. [2] A. H. Makwana, Prof. J. Pitroda, A Study on Region wise Price Variation of Construction Raw Materials using Frequency Analysis through SPSS Software, International Journal of Engineering Trends and Technology (IJETT), Impact Factor 0.537, ISSN: 2231-5381, Volume 4, Issue 7, July 2013, Pg. 3233 – 3242. [3] A. H. Makwana, Prof. J. Pitroda, Ingenious Study on Region wise Price Variation of Construction Raw Materials using Chi-Square Test Through SPSS Software, Journal of International Academic Research for Multidisciplinary (JIARM, Peer Review Journal, Impact Factor - 1.393), ISSN: 2320-5083, Volume - 1, Issue - 11, December 2013, pg.: 349 - 356. F-Tabulated Critical region Reject (Ho) 5 % Accept (Ho) F0
- 14. International Conference on: “Engineering: Issues, opportunities and Challenges for Development” ISBN: 978-81-929339-3-1 09th April, 2016, S.N. Patel Institute of Technology & Research Centre, Umrakh, Bardoli 126 [4] A. H. Makwana, Prof. J. Pitroda, A Value added Study on Region wise Price Variation of Construction Raw Materials using Independent-Samples T Test through SPSS Software, Impact Factor 1.393, ISSN: 2320-5083, Volume 1, Issue 11, December 2013, Pg. 357 – 364. [5] A. M. Patel, Prof. J. Pitroda, Prof. J. J. Bhavsar, Risk Assessment in Residential Construction Projects by SPSS, International Journal of Engineering Sciences & Research Technology, Scientific Journal Impact Factor: 3.449, (ISRA), Impact Factor: 1.852, ISSN: 2277-9655, May, 2014, pg. 498-504. [6] A. Singh, D. Pant, S. I. Olsen, Life Cycle Assessment of Renewable Energy Sources, Springer, ISSN 1865- 3529, ISSN 1865-3537 (electronic), ISBN 978-1-4471-5363-4, ISBN 978-1-4471-5364-1 (eBook), DOI 10.1007/978-1-4471-5364-1, © Springer-Verlag London 2013. [7] B. G. Bhudiya, S. S. Narola, A. H. Makwana, J. Pitroda, Assessment on Autoclaved Aerated Concrete Blocks using Frequency Analysis through SPSS software in Charotar Region of Central Gujarat, Journal of International Academic Research for Multidisciplinary (JIARM), Impact Factor 1.393, ISSN: 2320-5083, Volume 1, Issue 10, November 2013, Pg. 367 – 386. [8] C. R. Parmar, A. H. Makwana, J. Pitroda, Jaydev J. Bhavsar, A Study on Ready Mixed Concrete using Independent Sample T-Test through SPSS Software in Charotar Region of Central Gujarat, Journal of International Academic Research for Multidisciplinary (JIARM), Impact Factor 1.393, ISSN: 2320-5083, Volume 1, Issue 11, December 2013, Pg. 292 – 300. [9] D. Belani, A. H. Makwana, J. Pitroda, A study of evaluation Criterias for Renewable Energy Resources using Frequency Analysis through SPSS software, Journal of International Academic Research for Multidisciplinary (JIARM), Impact Factor 1.393, ISSN: 2320-5083, Volume 1, Issue 10, November 2013, Pg. 350 – 366. [10]D. S. Chokshi, A. H. Makwana, J. Pitroda, A Preliminary Study on Importances of Fly-ash Bricks and Clay Bricks in Construction Industry through SPSS software, International Journal of Civil, Structural, Environmental and Infrastructure Engineering Research and Development (IJCSEIERD), Impact Factor 5.4829, ISSN(P): 2249-6866; ISSN(E): 2249-7978, Vol. 3, Issue 5, December 2013, 125-132, © TJPRC Pvt. Ltd. 5. [11]D. S. Chokshi, J. Pitroda, A. H. Makwana, A Competitive Assessment on Fly-Ash Bricks and Clay Bricks in Central Gujarat Region of India Using Chi-Square Test(χ2 ) through SPSS Software, International Journal of Engineering Sciences & Research Technology [IJESRT, Scientific Journal Impact Factor: 3.449, (ISRA), Impact Factor: 1.852], Volume - 3, Issue - 5, May 2014, Pg. 320 - 331. [12]G. N. Tiwari and R. K. Mishra, Advanced Renewable Energy Sources, ISBN: 978-1-84973-380-9, RCS Publishing, © 2012, Centre for Energy Studies, Indian Institute of Technology Delhi, New Delhi, India [13]H. D. Bambhava, Prof. J. Pitroda, Prof. J. J. Bhavsar, A Comparative Study on Bamboo Scaffolding and Metal Scaffolding in Construction Industry using Statistical Methods, International Journal of Engineering Trends and Technology (IJETT), Impact Factor 0.537, ISSN: 2231-5381, Volume 4, Issue 6, June 2013, Pg. 2330 – 2337.
- 15. International Conference on: “Engineering: Issues, opportunities and Challenges for Development” ISBN: 978-81-929339-3-1 09th April, 2016, S.N. Patel Institute of Technology & Research Centre, Umrakh, Bardoli 127 [14]J. Rosen, The future role of renewable energy sources in European electricity supply, ISBN: 978-3-86644- 215-3 (print), Karlsruhe, November 2007. [15]R. A Johnson, Miller & Freund’s Probability and Statistics for Engineers, Seventh Edition, Prentice-Hall of India Private Limited, New Delhi-110 001, 2005. [16]V. B. Bhatt, A. H. Makwana, J. Pitroda, Pioneering Approach for Industrial waste by Frequency Analysis through SPSS software in Charotar Region of Central Gujarat, Journal of International Academic Research for Multidisciplinary (JIARM, Peer Review Journal, Impact Factor - 1.393), ISSN: 2320-5083, Volume - 1, Issue - 11, December 2013, Pg. 301 - 324.