A picture of poverty on the north shore, 2 timothy reardon, mapc
•Download as PPTX, PDF•
0 likes•1,047 views

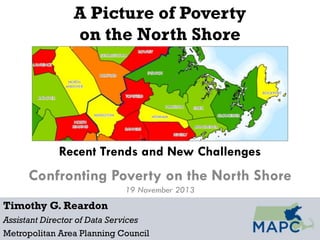
"A Picture of Poverty on the North Shore," presented by Timothy Reardon, MAPC, at MAPC's Confronting Poverty on the North Shore forum, Salem, Mass., November 19, 2013.
Report
Share
Report
Share

Recommended
A Picture of Poverty on the North Shore, a presentation at MAPC's Confronting...
A Picture of Poverty on the North Shore, a presentation at MAPC's Confronting...Metropolitan Area Planning Council
This document examines poverty trends on the North Shore of Massachusetts. It finds that poverty is concentrated in four cities - Salem, Beverly, Gloucester and Peabody - which together account for 71% of the subregion's poor residents. Poverty has increased overall since 2000 and is becoming more prevalent among non-family households and families without spouses present. However, poverty trends have diverged across municipalities, with some towns seeing rises in poverty while others have remained steady or seen declines. The document outlines challenges faced by those in suburban poverty, including lack of access to services and transportation difficulties.Seattle Demographic Trends
The document discusses recent demographic trends in Seattle and King County, Washington. It finds that while Seattle has become slightly whiter in recent years, the population growth in the county has been driven by people of color, especially Asians and Latinos. Specifically, Latinos under 18 make up a small portion of Seattle's population but nearly a quarter of the Latino population. The trends toward more multifamily housing and renting could disproportionately impact the growing Latino community.
Population Estimates, August 2015 Snapshot
The Atlanta region population grew by 60,300 people between 2014 and 2015 to a total of 4,332,600 residents in 2015. Gwinnett County had the largest growth over this period, adding 15,700 new residents. While population growth has rebounded since 2010, the annual growth rate remains below historical levels from 1990 to 2010. Residential building permits, a key indicator of future population growth, have also remained well below their 30-year average of 35,000 permits per year. Areas with high concentrations of new residential building permits, especially single family homes, correspond to areas experiencing the greatest population increases per square mile between 2010 and 2015.
12 2010 global-urban_fusion_press_release[1]
Mayor Frank G. Jackson will host Cleveland's inaugural "Global Urban Fusion - A Holiday Celebration of Cleveland's Diversity" event at City Hall on December 22nd from 6-9pm to celebrate the city's diverse cultures. The event is a collaboration between young professionals seeking to promote intercultural business relationships. Attendees will enjoy global food, drinks, and music meant to unite people and break down barriers. The goal is for the event to kick off a series celebrating Cleveland's diversity and driving the city's renaissance.
Infographic - Serbia - 2015 Annual Report on the State of Philanthropy
This report summarizes findings from research tracking philanthropy in Serbia in 2015. It provides statistics on the geographic distribution of donors, key themes for giving such as healthcare and supporting marginalized groups, and recipients of donations like people with health issues. The majority of donations (56.6%) were for one-off support, while long-term support made up 29.6% of donations. Most donations came from individuals (19.3%) and the corporate sector (26.8%), totaling over 22 million euros - a 21.8% increase from 2014.
Recruitment Flyer
The Alliance to End Homelessness in Suburban Cook County coordinates a biennial homeless count as required by the federal government. Volunteers canvass streets in groups at night to attempt to count every unsheltered homeless person in the area. The results are reported to secure federal funds for homelessness programs and track efforts to end homelessness. Volunteers participate in training before surveying individuals in designated regions to help raise awareness of homeless issues in local communities.
Fulton weavetricks
The document discusses demographic data about areas within Fulton County, Georgia. It provides statistics about population growth, density, age, income levels, education, poverty rates, health insurance coverage, employment, and population forecasts for different regions within the county. The data shows that between 2000-2010, southern Cherokee added the most new residents; Midtown Atlanta has the highest population density; North Atlanta has the highest concentration of those over 65; Southwest Atlanta has the highest concentration of those under 5; Buckhead has the highest concentration of residents with a bachelor's degree or higher; North Buckhead has the highest per capita income; Southeast Atlanta has the highest poverty rate; Roswell has the highest percentage of foreign-born and uninsured
ARC's 2013 Population Estimates
Population estimates for the major jurisdictions in the 10-county Atlanta region is one of ARC's signature products. This presents ARC's 2013 population estimates which show the region added 40,100 new residents over the past year.
Double line graphs
This double line graph compares the rates of people visiting two music websites, Music Choice and Pop Parade, from May 1st to 15th, 2014. It shows that the number of visitors to Pop Parade was highest at 120,000 on the first day, dropped to a low of 30,000 on the 7th day, and sharply increased to 170,000 by the 15th day. Meanwhile, Music Choice had 40,000 visitors on the first day, dropping to a low of 20,000 on the 7th day before rising to a high of 120,000 and ending at 75,000 by the 15th day. In conclusion, Pop Parade attracted more maximum visitors than Music Choice by the end of the
Demographic concept of transition
1. To study the Statistical Analysis of population
growth.
2. To study the various stages of demographic
transition.
3. To study the factors that lead to population
explosion.
4. To study the impact of population explosion.
5. To study the measures to control population.
18(10) birth and death rate,house rent,income and wages
The document discusses indicators such as birth rate, death rate, incomes, wages, and house rent in Pakistan. It provides definitions and current statistics. The birth rate in Pakistan in 2014 was 23.19 births per 1,000 population, while the death rate was 6.58 deaths per 1,000 population. Minimum wage was raised from Rs. 10,000 to Rs. 12,000 per month in 2014-2015 in Pakistan. Per capita income grew by 4.3% from 2013-2014 reaching $1,380. House rent is defined as periodic payments made by tenants to landlords for the use of property, with rates varying in different Pakistani cities.
Migration And Mobility Pt 5
This document discusses refugees and internally displaced persons (IDPs). It defines a refugee as someone outside their country of nationality due to fear of persecution. There are currently 11.5 million refugees worldwide. IDPs are unable to leave their country but cannot access protection services. There are 25 million IDPs facing an uncertain future. Canada accepts around 25,000 refugees per year and the US accepts around 75,000. Emerging issues impacting refugees include increasing populations, conflicts over land and resources, poverty, and tensions leading to more displacement as less developed countries become reluctant to accept refugees. Forced displacement can perpetuate political instability.
Srecko sekeljic presentation point 30
The document summarizes Serbia's response to devastating floods in 2012 and 2013. It notes that decades of poor planning and budget cuts left Serbia unprepared for the natural disaster. The government was slow to declare a state of emergency and coordinate evacuations. However, citizens organized impressive volunteer efforts, providing search and rescue, donations of supplies, and coordinating relief through websites. The volunteer-run poplave.rs site in particular grew rapidly to help thousands of people. While the government response was criticized, ordinary citizens stepped up to help each other in the crisis.
Comparison of the socio economic condition of migrants
The document compares the socioeconomic conditions of migrants in Pakistan before and after migration. It finds that:
- Rural to urban migration accounts for less than a quarter of total migration in Pakistan, with males more likely to migrate than females. Common reasons for migration include marriage, moving with family, searching for jobs, and security issues.
- Case studies of two migrants found improvements in some socioeconomic factors after migration, such as income, housing, and family status. However, negative impacts were also observed, including health issues, drug addiction, school dropout, and increased loneliness resulting from separation from family and community.
- To improve pre-migration situations pushing people to leave, actions could address poverty, hunger,
Cobb weavetricks
The document analyzes demographic data from Cobb County, Georgia between 2000-2010 and provides statistics about its neighborhoods. It finds that the area south of Kennesaw added the most new residents during that period. It also identifies that the highest population density is north of Smyrna, the highest percentage of residents aged 65+ is in Marietta, and the highest percentage of residents under age 5 is in Mableton. Additionally, it reports that Vinings has the highest percentage of residents with a bachelor's degree and the highest per capita income.
Europe's Contours
Tim Reeskens gave a presentation in Loek Halman and Arnoud-Jan Bijsterveld's course "National and Regional Identities" on the perceived normative contours of Europe, using data of the 2017 European Values Study. With the support of the Erasmus+ Programme of the European Union.
The Housing Situation
The document discusses housing issues in West Virginia and Appalachia. It provides demographic data for Wheeling, WV, showing higher poverty and lower income compared to national averages. Poverty has historically been a problem in Appalachia, though urban areas have improved while central Appalachia struggles with low jobs and high poverty. Housing problems include high homeownership rates due to low mobility, a lack of affordable housing near new jobs, and poor quality housing such as incomplete plumbing or crowding.
Lincoln Heights project
Lincoln Heights is a densely populated neighborhood in Los Angeles with over 26,000 residents. The population is predominantly Latino (70.7%) and Asian (25.2%). The median household income is $30,579, which is lower than the city and county averages. Crime rates show an average of 4.5 violent crimes and 12.5 property crimes per week, including incidents of burglary, grand theft auto, and robbery.
Rockdale weavetricks
This document discusses demographic data about different areas within Rockdale County, Georgia. It provides statistics about population growth, density, age, education levels, income, poverty rates, country of origin, health insurance coverage, jobs, and population forecasts for each area. The goal is to use this data to help decision makers understand how the county is changing and identify where resources may need to be allocated going forward based on the data.
Clayton weavetricks
This document provides demographic data and statistics about different areas within Clayton County, Georgia. It shares information about population changes between 2000 and 2010, population density, concentrations of residents by age group, education levels, income levels, poverty rates, foreign-born populations, health insurance coverage, job numbers, and population growth forecasts. The data helps analyze and compare the various neighborhoods within Clayton County.
Henry weavetricks
This document provides demographic data about different areas within Henry County, Georgia. It reveals that Hampton added the most new residents between 2000-2010, while the area west of McDonough has the highest population density. McDonough has the highest concentrations of residents over 65 and under 5 years old, as well as the highest poverty rate. The area north of McDonough has the highest percentage of residents with a bachelor's degree or higher and is forecast to add the most new residents by 2040.
Part I Chinatown Then and Now
The document analyzes gentrification trends in Boston, New York, and Philadelphia Chinatowns between 1990 and 2010. It finds that while Asians remain the largest ethnic group, their share of the population has decreased in all three Chinatowns as the white population grows faster than in the overall cities. The share of foreign-born residents and family households has also declined in the Chinatowns. Housing values and rents have risen substantially in the Chinatowns, surpassing or approaching city-wide averages, indicating gentrification.
Homeless2013 santa cruz_standaloneexecsumm
The document summarizes data from the 2013 Santa Cruz County Point-in-Time Count of the homeless population. It found that 3,536 individuals were experiencing homelessness in Santa Cruz County on January 22, 2013, with 2,895 (82%) being unsheltered and 641 (18%) being sheltered. The majority were men, white or Hispanic, between 25-64 years old, and had experienced homelessness for over one year. The most common causes of homelessness were lack of affordable housing and lack of income or employment.
Dekalb weavetricks
This document discusses key demographic data and trends in DeKalb County, Georgia. It provides statistics on population growth, density, age, income levels, education levels, poverty rates, health insurance coverage, employment, and population forecasts for different areas within the county. The data shows, for example, that the area south of Lithonia added almost 10,000 new residents between 2000-2010, while the area north of Tucker has the highest population density at around 13,000 people per square mile.
B8 utilize data to advocate tim parker- usda ers
One’s position is only as strong as the information one uses to support it, no matter how worthwhile the endeavor. Making the case for housing assistance in rural America is no different. Understanding and presenting housing data effectively is a key element of advocating for families, seniors, and veterans in need. The ability to access and use data, such as the Census Bureau’s American Community Survey, is a powerful tool. This workshop will help familiarize participants with accessing data and will present ways data can be used to most effectively advocate for rural housing needs.
Housing Virginia Rural Report - Nov 2016
This document provides an overview of housing needs in rural Virginia. It finds that while rural populations are growing more slowly than urban areas, the rural population is aging significantly. Many young adults are moving away from rural communities for jobs while the senior population remains. As a result, poverty and unemployment rates are higher in rural areas, especially in the Mountain and Southside regions. The report also notes that affordable housing is lacking, with nearly a third of rural households paying over 30% of their income on housing costs. Direct feedback from rural housing providers identified additional needs around housing for seniors, rental options, homeownership, and improving existing housing stock. The report concludes with policy recommendations in these areas.
RS June 2021: Neighborhood Change Dynamics Updated
The document analyzes demographic shifts in census tracts in the 20-county Atlanta region from 2000 to 2019. It finds that 53% of census tracts experienced some form of change over this period. 12% saw significant population growth, with higher incomes and more racial/ethnic diversity. 28% saw increased poverty concentration, with lower incomes and more diversity. The regions saw the most population growth in outer suburbs and northern Atlanta, while population declined mostly in southern Atlanta. Areas of poverty concentration were widespread in the inner suburbs, while poverty displacement was concentrated in central Atlanta.
All background
The document provides data on housing affordability and demographics in Seattle. It shows that Seattle's population is growing rapidly and housing construction has increased but not kept pace with demand, driving up rents. Average rents in Seattle are now unaffordable for many working households and disproportionately burden low-income residents and communities of color. The gap between affordable housing supply and demand is most severe for lowest-income renters.
Exploring Dallas Poverty in Local, Regional, and National Contexts
This document examines poverty in Dallas, Texas from 2000-2014. It finds that poverty rates increased much more sharply than population growth over this period. The number of children and Hispanic individuals living in poverty grew by 59% and 53% respectively, outpacing the city's overall population increase of 8%. Dallas had one of the highest child poverty and Hispanic poverty rates among major U.S. cities in 2014. The document also analyzes how poverty affects brain development and civic participation, and discusses the changing geographic concentration of poverty within Dallas over time.
Atlanta Regional Change: Census Tract Dynamics 2000-2019
The document analyzes demographic shifts at the census tract level in the 20-county Atlanta region between 2000-2019. Key findings include:
- 53% of tracts experienced some change, with 12% seeing population growth and 28% experiencing increased poverty concentration.
- Population growth tracts saw higher incomes and education levels and became wealthier and more racially diverse. Poverty concentration tracts saw lower incomes, declining home values, and increased percentages of low-income residents of color.
- Population growth occurred in outer suburbs and parts of Atlanta, while poverty concentrated in the southern suburbs and parts of Atlanta. The analysis examines changes in demographics, income, housing costs, and education across different types of tracts
More Related Content
What's hot
Double line graphs
This double line graph compares the rates of people visiting two music websites, Music Choice and Pop Parade, from May 1st to 15th, 2014. It shows that the number of visitors to Pop Parade was highest at 120,000 on the first day, dropped to a low of 30,000 on the 7th day, and sharply increased to 170,000 by the 15th day. Meanwhile, Music Choice had 40,000 visitors on the first day, dropping to a low of 20,000 on the 7th day before rising to a high of 120,000 and ending at 75,000 by the 15th day. In conclusion, Pop Parade attracted more maximum visitors than Music Choice by the end of the
Demographic concept of transition
1. To study the Statistical Analysis of population
growth.
2. To study the various stages of demographic
transition.
3. To study the factors that lead to population
explosion.
4. To study the impact of population explosion.
5. To study the measures to control population.
18(10) birth and death rate,house rent,income and wages
The document discusses indicators such as birth rate, death rate, incomes, wages, and house rent in Pakistan. It provides definitions and current statistics. The birth rate in Pakistan in 2014 was 23.19 births per 1,000 population, while the death rate was 6.58 deaths per 1,000 population. Minimum wage was raised from Rs. 10,000 to Rs. 12,000 per month in 2014-2015 in Pakistan. Per capita income grew by 4.3% from 2013-2014 reaching $1,380. House rent is defined as periodic payments made by tenants to landlords for the use of property, with rates varying in different Pakistani cities.
Migration And Mobility Pt 5
This document discusses refugees and internally displaced persons (IDPs). It defines a refugee as someone outside their country of nationality due to fear of persecution. There are currently 11.5 million refugees worldwide. IDPs are unable to leave their country but cannot access protection services. There are 25 million IDPs facing an uncertain future. Canada accepts around 25,000 refugees per year and the US accepts around 75,000. Emerging issues impacting refugees include increasing populations, conflicts over land and resources, poverty, and tensions leading to more displacement as less developed countries become reluctant to accept refugees. Forced displacement can perpetuate political instability.
Srecko sekeljic presentation point 30
The document summarizes Serbia's response to devastating floods in 2012 and 2013. It notes that decades of poor planning and budget cuts left Serbia unprepared for the natural disaster. The government was slow to declare a state of emergency and coordinate evacuations. However, citizens organized impressive volunteer efforts, providing search and rescue, donations of supplies, and coordinating relief through websites. The volunteer-run poplave.rs site in particular grew rapidly to help thousands of people. While the government response was criticized, ordinary citizens stepped up to help each other in the crisis.
Comparison of the socio economic condition of migrants
The document compares the socioeconomic conditions of migrants in Pakistan before and after migration. It finds that:
- Rural to urban migration accounts for less than a quarter of total migration in Pakistan, with males more likely to migrate than females. Common reasons for migration include marriage, moving with family, searching for jobs, and security issues.
- Case studies of two migrants found improvements in some socioeconomic factors after migration, such as income, housing, and family status. However, negative impacts were also observed, including health issues, drug addiction, school dropout, and increased loneliness resulting from separation from family and community.
- To improve pre-migration situations pushing people to leave, actions could address poverty, hunger,
Cobb weavetricks
The document analyzes demographic data from Cobb County, Georgia between 2000-2010 and provides statistics about its neighborhoods. It finds that the area south of Kennesaw added the most new residents during that period. It also identifies that the highest population density is north of Smyrna, the highest percentage of residents aged 65+ is in Marietta, and the highest percentage of residents under age 5 is in Mableton. Additionally, it reports that Vinings has the highest percentage of residents with a bachelor's degree and the highest per capita income.
Europe's Contours
Tim Reeskens gave a presentation in Loek Halman and Arnoud-Jan Bijsterveld's course "National and Regional Identities" on the perceived normative contours of Europe, using data of the 2017 European Values Study. With the support of the Erasmus+ Programme of the European Union.
The Housing Situation
The document discusses housing issues in West Virginia and Appalachia. It provides demographic data for Wheeling, WV, showing higher poverty and lower income compared to national averages. Poverty has historically been a problem in Appalachia, though urban areas have improved while central Appalachia struggles with low jobs and high poverty. Housing problems include high homeownership rates due to low mobility, a lack of affordable housing near new jobs, and poor quality housing such as incomplete plumbing or crowding.
Lincoln Heights project
Lincoln Heights is a densely populated neighborhood in Los Angeles with over 26,000 residents. The population is predominantly Latino (70.7%) and Asian (25.2%). The median household income is $30,579, which is lower than the city and county averages. Crime rates show an average of 4.5 violent crimes and 12.5 property crimes per week, including incidents of burglary, grand theft auto, and robbery.
Rockdale weavetricks
This document discusses demographic data about different areas within Rockdale County, Georgia. It provides statistics about population growth, density, age, education levels, income, poverty rates, country of origin, health insurance coverage, jobs, and population forecasts for each area. The goal is to use this data to help decision makers understand how the county is changing and identify where resources may need to be allocated going forward based on the data.
Clayton weavetricks
This document provides demographic data and statistics about different areas within Clayton County, Georgia. It shares information about population changes between 2000 and 2010, population density, concentrations of residents by age group, education levels, income levels, poverty rates, foreign-born populations, health insurance coverage, job numbers, and population growth forecasts. The data helps analyze and compare the various neighborhoods within Clayton County.
Henry weavetricks
This document provides demographic data about different areas within Henry County, Georgia. It reveals that Hampton added the most new residents between 2000-2010, while the area west of McDonough has the highest population density. McDonough has the highest concentrations of residents over 65 and under 5 years old, as well as the highest poverty rate. The area north of McDonough has the highest percentage of residents with a bachelor's degree or higher and is forecast to add the most new residents by 2040.
Part I Chinatown Then and Now
The document analyzes gentrification trends in Boston, New York, and Philadelphia Chinatowns between 1990 and 2010. It finds that while Asians remain the largest ethnic group, their share of the population has decreased in all three Chinatowns as the white population grows faster than in the overall cities. The share of foreign-born residents and family households has also declined in the Chinatowns. Housing values and rents have risen substantially in the Chinatowns, surpassing or approaching city-wide averages, indicating gentrification.
Homeless2013 santa cruz_standaloneexecsumm
The document summarizes data from the 2013 Santa Cruz County Point-in-Time Count of the homeless population. It found that 3,536 individuals were experiencing homelessness in Santa Cruz County on January 22, 2013, with 2,895 (82%) being unsheltered and 641 (18%) being sheltered. The majority were men, white or Hispanic, between 25-64 years old, and had experienced homelessness for over one year. The most common causes of homelessness were lack of affordable housing and lack of income or employment.
Dekalb weavetricks
This document discusses key demographic data and trends in DeKalb County, Georgia. It provides statistics on population growth, density, age, income levels, education levels, poverty rates, health insurance coverage, employment, and population forecasts for different areas within the county. The data shows, for example, that the area south of Lithonia added almost 10,000 new residents between 2000-2010, while the area north of Tucker has the highest population density at around 13,000 people per square mile.
What's hot (16)
18(10) birth and death rate,house rent,income and wages
18(10) birth and death rate,house rent,income and wages
Comparison of the socio economic condition of migrants
Comparison of the socio economic condition of migrants
Similar to A picture of poverty on the north shore, 2 timothy reardon, mapc
B8 utilize data to advocate tim parker- usda ers
One’s position is only as strong as the information one uses to support it, no matter how worthwhile the endeavor. Making the case for housing assistance in rural America is no different. Understanding and presenting housing data effectively is a key element of advocating for families, seniors, and veterans in need. The ability to access and use data, such as the Census Bureau’s American Community Survey, is a powerful tool. This workshop will help familiarize participants with accessing data and will present ways data can be used to most effectively advocate for rural housing needs.
Housing Virginia Rural Report - Nov 2016
This document provides an overview of housing needs in rural Virginia. It finds that while rural populations are growing more slowly than urban areas, the rural population is aging significantly. Many young adults are moving away from rural communities for jobs while the senior population remains. As a result, poverty and unemployment rates are higher in rural areas, especially in the Mountain and Southside regions. The report also notes that affordable housing is lacking, with nearly a third of rural households paying over 30% of their income on housing costs. Direct feedback from rural housing providers identified additional needs around housing for seniors, rental options, homeownership, and improving existing housing stock. The report concludes with policy recommendations in these areas.
RS June 2021: Neighborhood Change Dynamics Updated
The document analyzes demographic shifts in census tracts in the 20-county Atlanta region from 2000 to 2019. It finds that 53% of census tracts experienced some form of change over this period. 12% saw significant population growth, with higher incomes and more racial/ethnic diversity. 28% saw increased poverty concentration, with lower incomes and more diversity. The regions saw the most population growth in outer suburbs and northern Atlanta, while population declined mostly in southern Atlanta. Areas of poverty concentration were widespread in the inner suburbs, while poverty displacement was concentrated in central Atlanta.
All background
The document provides data on housing affordability and demographics in Seattle. It shows that Seattle's population is growing rapidly and housing construction has increased but not kept pace with demand, driving up rents. Average rents in Seattle are now unaffordable for many working households and disproportionately burden low-income residents and communities of color. The gap between affordable housing supply and demand is most severe for lowest-income renters.
Exploring Dallas Poverty in Local, Regional, and National Contexts
This document examines poverty in Dallas, Texas from 2000-2014. It finds that poverty rates increased much more sharply than population growth over this period. The number of children and Hispanic individuals living in poverty grew by 59% and 53% respectively, outpacing the city's overall population increase of 8%. Dallas had one of the highest child poverty and Hispanic poverty rates among major U.S. cities in 2014. The document also analyzes how poverty affects brain development and civic participation, and discusses the changing geographic concentration of poverty within Dallas over time.
Atlanta Regional Change: Census Tract Dynamics 2000-2019
The document analyzes demographic shifts at the census tract level in the 20-county Atlanta region between 2000-2019. Key findings include:
- 53% of tracts experienced some change, with 12% seeing population growth and 28% experiencing increased poverty concentration.
- Population growth tracts saw higher incomes and education levels and became wealthier and more racially diverse. Poverty concentration tracts saw lower incomes, declining home values, and increased percentages of low-income residents of color.
- Population growth occurred in outer suburbs and parts of Atlanta, while poverty concentrated in the southern suburbs and parts of Atlanta. The analysis examines changes in demographics, income, housing costs, and education across different types of tracts
EBDI Community Profile
The document provides demographic data for the EBDI redevelopment project area and surrounding Greater East Baltimore neighborhood, comparing statistics from 2000 to 2010. It finds that the population in the EBDI area decreased significantly, with fewer households and children. Poverty rates increased while income levels rose slightly on average. Housing units decreased substantially, with large drops in homeownership. The neighborhood experienced income inequality and high rates of poverty, though the number of very low-income residents decreased.
Census 2020: What is at Stake for Higher Education
A presentation made to the Illinois Higher Education Civic Engagement Collaborative of Chicago on April 26 2019 at the University of Illinois-Chicago by CGS Research Assiciate Brian Harger.
Magavern report ppg
This report analyzes racial disparities in employment and earnings in Erie County, New York. It finds that people of color face significantly higher unemployment rates and lower wages compared to whites. These disparities are due in part to the spatial mismatch between where people of color primarily live in urban neighborhoods and the location of jobs, many of which are inaccessible by public transportation. The report calls for better funding of public transportation and transit-oriented development to improve access to jobs and reduce racial inequities.
Tippecanoe County SnapShot
The document provides demographic, economic, and labor market data about Tippecanoe County, Indiana from 2000-2013. Some key findings include:
- The county's population increased 21% from 2000-2013, largely due to natural increase and international migration.
- Educational attainment among adults 25+ improved, with 43% now having at least a college degree.
- The number of business establishments grew 78% from 2000-2011, primarily through new business formation rather than relocation.
- Most establishments are small, with 58% having 2-9 employees in 2011.
Are Mixed Neighborhoods Always Unstable?
David Card, Alex Mas and Jesse Rothstein's presentation for
the Penn IUR and Federal Reserve Conference, “Reinventing Older Communities: How Does Place Matter?”
Williamson County, Texas: Changing Demographics and Implications of Growth
Williamson County is growing rapidly due to migration from other areas, especially Travis County. The population is becoming more diverse, with the Hispanic population projected to be over half of new residents in the next 20 years. This presents challenges around education and income inequality but also opportunities if inclusive economic development policies are pursued. Growth represents both challenges and opportunities for Williamson County to leverage as it takes on a more prominent role in the Austin region.
The Diversity Explosion
Learn more about Diversity Explosion:
http://www.brookings.edu/research/reports2/2014/11/diversity-explosion
__________
At its optimistic best, America has embraced its identity as the world’s melting pot. Today it is on the cusp of becoming a country with no racial majority, and new minorities are poised to exert a profound impact on U.S. society, economy, and politics.
Through a compelling narrative and eye-catching charts and maps, eminent demographer William H. Frey interprets and expounds on the dramatic growth of minority populations in the United States. He finds that without these expanding groups, America could face a bleak future: this new generation of young minorities, who are having children at a faster rate than whites, is infusing our aging labor force with vitality and innovation.
Diversity Explosion shares the good news about diversity in the coming decades, and the more globalized, multiracial country that U.S. is becoming.
Anderson County, TX
The document provides demographic, economic, and labor market data for Anderson County. Some key points:
- The county's population decreased slightly from 2010-2015 due mostly to domestic out-migration.
- Educational attainment has increased while the population has gotten older and more diverse.
- The number of establishments increased slightly, with growth in medium-sized businesses. The accommodation/food services industry saw the largest growth.
- The top five industries employ 70% of workers, led by healthcare/social assistance. Construction and accommodation/food saw job gains while transportation lost jobs.
- Office/administrative and sales occupations make up the largest shares of jobs.
Lake County Snapshot
The document provides data on demographics, economic, and labor market conditions in Lake County from 2000-2012. Some key findings include:
- The population grew 2% to nearly 507,000, primarily through natural increase as out-migration exceeded in-migration. The population is aging as those under 50 declined.
- The number of establishments doubled to over 32,000, mostly through new startups. Most establishments have 1-9 employees.
- The largest industry is health care/social assistance, employing 34,000. Manufacturing and retail also employ over 25,000 each.
Lake County Data Snapshot
The document provides demographic, economic, and labor market data and analysis for Lake County. It shows that between 2000-2012 the population grew modestly due to natural increase, though many young people moved away. The population became more diverse and better educated. The economy saw strong growth in establishments, especially small businesses. Top industries like healthcare and manufacturing declined slightly while others like construction grew. Office and administrative jobs make up the largest occupation.
County Profile Template Booklet
The document provides demographic, economic, and labor market data and analysis for Lake County. It shows that between 2000-2012 the population grew modestly due to natural increase, though many young people moved out. The population is aging and becoming more diverse. The number of establishments doubled from 2000-2011 primarily through new business formation. Health care and social assistance is the largest industry, providing the most jobs. Office and administrative support and sales are the top occupations. Educational attainment among residents has increased.
Hispanic Market Presentation 2015 7.23.15
The document provides information on the Hispanic population and market in the Pacific Northwest region of the United States. It discusses:
1) The large and growing Hispanic population in the region, particularly in Washington and Oregon, with over 50% growth in Washington between 2000-2013 and 64% growth in Oregon between 2000-2010.
2) Spending power and retail spending of Hispanics in key metropolitan areas of the region, with Hispanic retail spending reaching hundreds of millions of dollars annually in Seattle, Portland, and Yakima.
3) The diverse acculturation levels of Hispanics in the region and considerations for businesses in marketing and communicating cross-culturally to the Hispanic population.
Jefferson County Data Snapshot
This document provides a summary of demographic, economic, and labor market data for Jefferson County. The population increased slightly between 2000 and 2013, driven primarily by natural growth and domestic migration. The population is aging, with fewer residents of prime working age. Educational attainment improved modestly over this period. The county saw significant growth in the number of establishments between 2000 and 2011, largely through new business formation. The largest industries are manufacturing, government, retail trade, and healthcare, although manufacturing experienced job losses since 2002.
Rural and urban issues (recovered)
The article deals with the various rural and urban issues which occurs in our day o day life due to overpopulation , large scale urbanisation etc.
Similar to A picture of poverty on the north shore, 2 timothy reardon, mapc (20)
RS June 2021: Neighborhood Change Dynamics Updated
RS June 2021: Neighborhood Change Dynamics Updated
Exploring Dallas Poverty in Local, Regional, and National Contexts
Exploring Dallas Poverty in Local, Regional, and National Contexts
Atlanta Regional Change: Census Tract Dynamics 2000-2019
Atlanta Regional Change: Census Tract Dynamics 2000-2019
Census 2020: What is at Stake for Higher Education
Census 2020: What is at Stake for Higher Education
Williamson County, Texas: Changing Demographics and Implications of Growth
Williamson County, Texas: Changing Demographics and Implications of Growth
More from Metropolitan Area Planning Council
Autonomous Vehicles
An MIT spinoff called Optimus Ride is developing self-driving vehicle technology. The company was founded by Ryan Chin, a PhD from MIT who worked on several autonomous vehicle projects there. Optimus Ride aims to provide safe, sustainable, and equitable mobility solutions through their technology, which could unlock over $1 trillion in annual savings according to a Morgan Stanley report.
EV Ride and Drive Event
The Mass Drive Clean campaign was created in 2015 using funding from the John Merck Fund to promote electric vehicles (EVs) through test drive events. The campaign was piloted in Massachusetts and San Diego in 2015 and continued in 2016 with local funding. In 2016, the John Merck Fund provided seed funding to expand the campaign into Connecticut and Rhode Island. According to post-test drive surveys, over 70% of participants were more favorably inclined towards EVs and 70% said they were more likely to purchase one after the test drive experience. The next steps of the Mass Drive Clean campaign are to reach a larger, more diverse group of state residents, continue educating about incentives and models, and provide more experiential events
Autonomous Vehicles: Boston’s approach
This document summarizes Boston's efforts to research and test autonomous vehicles. It discusses the city's goals of improving safety, access, and mobility. The mayor's office has formed research partnerships and begun testing AVs on city streets. Testing has involved different vehicles and conditions. The document also examines potential AV business models and their impacts. It outlines Boston's work in areas like workforce development and governance to help guide the integration of this new technology.
Electric Vehicles
Electric vehicles (EVs) provide environmental benefits by reducing emissions even when powered by coal-based electricity. EVs also offer lower fuel and maintenance costs compared to gas vehicles. Massachusetts currently has hundreds of EV charging stations and provides incentives for purchasing EVs and installing chargers. Upcoming events will give people test drives to experience EVs firsthand and help more drivers switch to these cleaner vehicles.
Opening Remarks and Introduction of Panelists
The document summarizes an innovative mobility panel at a MAPC Fall Council meeting. The panel discussed the rise of electric vehicles and autonomous vehicles, and how transportation is the largest source of greenhouse gases in Massachusetts. They also addressed critical areas for state and local governments to consider regarding regulatory frameworks, data, land use impacts, infrastructure and parking for new mobility technologies. The panelists represented organizations working on these issues like MAPC, DOER, Optimus Rides, the City of Boston and Reach Strategies.
State of Equity Five-Year Update
This document summarizes a presentation on equity in the Metro Boston region. It discusses goals for increasing equity, including reducing segregation, improving access to affordable housing and food, and increasing opportunities for advancement for workers of color. It then reviews trends related to equity across different life stages and demographics since 2011. Key metrics like income inequality, low birth weight, test scores, incarceration rates, labor force participation, and housing cost burden show both improvements in some disparities but also growing inequities in other areas. The presentation concludes that inequity remains significant and is growing, but that policy interventions can help advance equity, though continued work is still needed.
Presentation by Gregory Miao, Esq., Metropolitan Area Planning Council Munici...
Presentation by Gregory Miao, Esq., Metropolitan Area Planning Council Munici...Metropolitan Area Planning Council
The document provides an overview of Massachusetts' Regulation and Taxation of Marijuana Act, which legalized recreational marijuana use and sales. It discusses the history of medical marijuana in MA, the passage of ballot question 4 in 2016, and outlines the key components of the new law, including allowing personal possession and home cultivation, establishing a regulatory system under the Cannabis Control Commission, implementing licensing for marijuana establishments, and levying a state and local excise tax. A timeline is also presented detailing implementation of the new law between 2017-2019.Presentation by Jeff Bagg, Central Massachusetts Regional Planning Commission...
Presentation by Jeff Bagg, Central Massachusetts Regional Planning Commission...Metropolitan Area Planning Council
1) The document reviews local control options for regulating recreational marijuana establishments under Massachusetts law. It can adopt time, place and manner restrictions or limit numbers through a regulatory referendum.
2) A regulatory referendum requires a ballot question voted on by residents to prohibit establishments, limit retailers to 20% of liquor licenses, or limit numbers to fewer than medical marijuana facilities. However, a consumption referendum can be forced onto the ballot with 10% of voter signatures.
3) Interpretation of some provisions is unclear, such as what constitutes an "area" where medical marijuana facilities operate. Overall municipalities have some local control but face limitations, especially the risk of consumption referendums beyond their direct control.Municipal IT Collaboration
The document discusses municipal IT collaboration between local governments and school departments. It provides examples of how the Town of Foxborough, MA and Foxborough Public Schools have collaborated on their joint IT operations. They have formed a technology steering committee with stakeholders to identify common needs, prioritize projects, and oversee the shared IT department. The collaboration has allowed them to hire additional IT staff and achieve cost savings while improving services. Overcoming barriers involves managing expectations, communication, and planning for the future.
IT Strategic Planning Arlington's Approach
The document outlines Arlington's IT strategic planning process, including putting together a team, engaging stakeholders, and setting benchmarks. It discusses the core components of the plan, including establishing a vision and mission, inventorying existing IT systems, and defining action steps and measurable outcomes. The plan aims to define the role of the IT department, improve relationships with stakeholders, manage the IT workload, and analyze the network.
MassIT: Activating IT Resources at the State Level
The document summarizes the state of IT in Massachusetts government and outlines MassIT's priorities and initiatives to improve digital services. MassIT aims to drive digital transformation across state agencies and support local governments. It discusses findings from an IT review that found low citizen satisfaction with digital services and immature security practices. MassIT plans to invest in core infrastructure, partner with local governments, and facilitate regional collaboration on IT projects and shared services.
I.T. Regionalization
We have hired 1 person for IT, saving $25,000 while strengthening our dedicated fiber and adding 24/7 support. IT regionalization has allowed us to hire more staff and save money by sharing resources, making our technology infrastructure more robust with around-the-clock assistance.
Natick Center Plan Forum #2
Draft recommendations presented by Chris Kuschel of the Metropolitan Area Planning Council at the second public forum of the Natick Center Plan, February 10, 2016, Natick, MA.
Vision board
The Town of Ashland has a thriving community with engaged residents, businesses, and leaders who work together toward common goals of sustainability, regional collaboration, and excellence in schools. Ashland maintains a strong infrastructure and economy with diverse housing, retail, work, and community spaces. The town is committed to environmental stewardship and transportation options while supporting a vibrant downtown, neighborhoods, and quality of life for all ages and backgrounds.
Vision board
The Town of Ashland has a thriving community with engaged residents, businesses, and leaders who work together towards common goals of sustainability, regional collaboration, and excellence in education. Ashland maintains a strong infrastructure and economy to support its diverse population with various housing, transportation, employment, and environmental opportunities. The community aims to be sustainable, vibrant, and welcoming to all ages through coordinated efforts outlined in the Ashland Comprehensive Plan.
Feedback boards from PlanAshland December 7, 2015 Forum
The document outlines draft land use, housing, economic development, and transportation goals for Ashland. For land use, the top three priorities should be GOAL 1 (accommodate development/preservation through zoning), GOAL 2 (support mixed-use development), and GOAL 3 (consider form-based code). For housing, the top three are GOAL 1 (preserve affordability), GOAL 3 (ensure affordability throughout town), and GOAL 6 (promote diverse/affordable housing). For economic development, the top three are GOAL 1 (vibrant development along corridors/downtown), GOAL 2 (provide planning/technical assistance), and GOAL 3 (implement public facilities/utilities
PlanAshland Forum 12/7/2015
The document summarizes a community forum held in Ashland, Massachusetts to discuss updating the town's comprehensive plan. It provides an overview of the comprehensive planning process and progress made so far in developing Ashland's plan, including outreach activities and draft goals in key areas like land use, housing, economic development, and transportation. The forum included a presentation of the draft community vision statement and goals, followed by small group discussions for residents to provide input and prioritize goals to guide future growth. The next steps in the planning process were also outlined.
Natick Center Plan
The document summarizes a plan for Natick Center that incorporates previous planning efforts and public input. Some key points:
- Previous plans from 1980-2000s addressed facilities, parking, and design issues.
- Natick's population is growing and its households are shrinking, increasing demand for multi-family and smaller housing units.
- New developments have contributed students to schools, though less than single-family homes typically.
- Most people walk to the commuter rail station, and ridership has increased in recent years.
- The plan gathers public input on housing, retail, transportation, and parking preferences to develop a vision for Natick Center's future.
Natick Center Plan Forum 1 Presentation 12.8.15
Presentation given on 12.8.15 at the Natick Center Plan forum given by MAPC in partnership with the town of Natick, MA,
Presentations from the MAPC Fall Council Meeting
The document provides information from MAPC's Fall 2015 Council meeting. It includes summaries and data from several MAPC projects:
- An inventory of 169 MAPC projects from the past year that advance MetroFuture goals such as sustainable growth, housing, and transportation. Transportation and healthy environment were the most common project categories.
- A discussion of regional ballot initiatives to raise funds for transportation projects and how Massachusetts municipalities can pursue similar initiatives.
- A project to engage immigrant small business owners in downtown Framingham through outreach efforts and a business owner story tour.
- Planning work in Chelsea around housing, jobs, and health through the lens of equity and quality of life near transit infrastructure.
- A project in Quin
More from Metropolitan Area Planning Council (20)
Presentation by Gregory Miao, Esq., Metropolitan Area Planning Council Munici...
Presentation by Gregory Miao, Esq., Metropolitan Area Planning Council Munici...
Presentation by Jeff Bagg, Central Massachusetts Regional Planning Commission...
Presentation by Jeff Bagg, Central Massachusetts Regional Planning Commission...
MassIT: Activating IT Resources at the State Level
MassIT: Activating IT Resources at the State Level
Feedback boards from PlanAshland December 7, 2015 Forum
Feedback boards from PlanAshland December 7, 2015 Forum
Recently uploaded
NIMA2024 | De toegevoegde waarde van DEI en ESG in campagnes | Nathalie Lam |...
Nathalie zal delen hoe DEI en ESG een fundamentele rol kunnen spelen in je merkstrategie en je de juiste aansluiting kan creëren met je doelgroep. Door middel van voorbeelden en simpele handvatten toont ze hoe dit in jouw organisatie toegepast kan worden.
TIMES BPO: Business Plan For Startup Industry
Starting a business is like embarking on an unpredictable adventure. It’s a journey filled with highs and lows, victories and defeats. But what if I told you that those setbacks and failures could be the very stepping stones that lead you to fortune? Let’s explore how resilience, adaptability, and strategic thinking can transform adversity into opportunity.
Digital Marketing with a Focus on Sustainability
Digital Marketing best practices including influencer marketing, content creators, and omnichannel marketing for Sustainable Brands at the Sustainable Cosmetics Summit 2024 in New York
The Genesis of BriansClub.cm Famous Dark WEb Platform
BriansClub.cm, a famous platform on the dark web, has become one of the most infamous carding marketplaces, specializing in the sale of stolen credit card data.
Part 2 Deep Dive: Navigating the 2024 Slowdown
Introduction
The global retail industry has weathered numerous storms, with the financial crisis of 2008 serving as a poignant reminder of the sector's resilience and adaptability. However, as we navigate the complex landscape of 2024, retailers face a unique set of challenges that demand innovative strategies and a fundamental shift in mindset. This white paper contrasts the impact of the 2008 recession on the retail sector with the current headwinds retailers are grappling with, while offering a comprehensive roadmap for success in this new paradigm.
Satta Matka Dpboss Matka Guessing Kalyan Chart Indian Matka Kalyan panel Chart
Satta Matka Dpboss Matka Guessing Kalyan Chart Indian Matka Kalyan panel Chart➒➌➎➏➑➐➋➑➐➐Dpboss Matka Guessing Satta Matka Kalyan Chart Indian Matka
SATTA MATKA SATTA FAST RESULT KALYAN TOP MATKA RESULT KALYAN SATTA MATKA FAST RESULT MILAN RATAN RAJDHANI MAIN BAZAR MATKA FAST TIPS RESULT MATKA CHART JODI CHART PANEL CHART FREE FIX GAME SATTAMATKA ! MATKA MOBI SATTA 143 spboss.in TOP NO1 RESULT FULL RATE MATKA ONLINE GAME PLAY BY APP SPBOSSBest Forex Brokers Comparison in INDIA 2024
Navigating the world of forex trading can be challenging, especially for beginners. To help you make an informed decision, we have comprehensively compared the best forex brokers in India for 2024. This article, reviewed by Top Forex Brokers Review, will cover featured award winners, the best forex brokers, featured offers, the best copy trading platforms, the best forex brokers for beginners, the best MetaTrader brokers, and recently updated reviews. We will focus on FP Markets, Black Bull, EightCap, IC Markets, and Octa.
Best practices for project execution and delivery
A select set of project management best practices to keep your project on-track, on-cost and aligned to scope. Many firms have don't have the necessary skills, diligence, methods and oversight of their projects; this leads to slippage, higher costs and longer timeframes. Often firms have a history of projects that simply failed to move the needle. These best practices will help your firm avoid these pitfalls but they require fortitude to apply.
Profiles of Iconic Fashion Personalities.pdf
The fashion industry is dynamic and ever-changing, continuously sculpted by trailblazing visionaries who challenge norms and redefine beauty. This document delves into the profiles of some of the most iconic fashion personalities whose impact has left a lasting impression on the industry. From timeless designers to modern-day influencers, each individual has uniquely woven their thread into the rich fabric of fashion history, contributing to its ongoing evolution.
The APCO Geopolitical Radar - Q3 2024 The Global Operating Environment for Bu...
The Radar reflects input from APCO’s teams located around the world. It distils a host of interconnected events and trends into insights to inform operational and strategic decisions. Issues covered in this edition include:
3 Simple Steps To Buy Verified Payoneer Account In 2024
Buy Verified Payoneer Account: Quick and Secure Way to Receive Payments
Buy Verified Payoneer Account With 100% secure documents, [ USA, UK, CA ]. Are you looking for a reliable and safe way to receive payments online? Then you need buy verified Payoneer account ! Payoneer is a global payment platform that allows businesses and individuals to send and receive money in over 200 countries.
If You Want To More Information just Contact Now:
Skype: SEOSMMEARTH
Telegram: @seosmmearth
Gmail: seosmmearth@gmail.com
HOW TO START UP A COMPANY A STEP-BY-STEP GUIDE.pdf
How to Start Up a Company: A Step-by-Step Guide Starting a company is an exciting adventure that combines creativity, strategy, and hard work. It can seem overwhelming at first, but with the right guidance, anyone can transform a great idea into a successful business. Let's dive into how to start up a company, from the initial spark of an idea to securing funding and launching your startup.
Introduction
Have you ever dreamed of turning your innovative idea into a thriving business? Starting a company involves numerous steps and decisions, but don't worry—we're here to help. Whether you're exploring how to start a startup company or wondering how to start up a small business, this guide will walk you through the process, step by step.
Taurus Zodiac Sign: Unveiling the Traits, Dates, and Horoscope Insights of th...
Dive into the steadfast world of the Taurus Zodiac Sign. Discover the grounded, stable, and logical nature of Taurus individuals, and explore their key personality traits, important dates, and horoscope insights. Learn how the determination and patience of the Taurus sign make them the rock-steady achievers and anchors of the zodiac.
Dpboss Matka Guessing Satta Matta Matka Kalyan Chart Satta Matka
Dpboss Matka Guessing Satta Matta Matka Kalyan Chart Satta Matka➒➌➎➏➑➐➋➑➐➐Dpboss Matka Guessing Satta Matka Kalyan Chart Indian Matka
Dpboss Matka Guessing Satta Matta Matka Kalyan Chart Indian Matka Indian satta Matka Dpboss Matka Kalyan Chart Matka Boss otg matka Guessing Satta 一比一原版(QMUE毕业证书)英国爱丁堡玛格丽特女王大学毕业证文凭如何办理
永久可查学历认证【微信:A575476】【(QMUE毕业证书)英国爱丁堡玛格丽特女王大学毕业证成绩单Offer】【微信:A575476】(留信学历认证永久存档查询)采用学校原版纸张、特殊工艺完全按照原版一比一制作(包括:隐形水印,阴影底纹,钢印LOGO烫金烫银,LOGO烫金烫银复合重叠,文字图案浮雕,激光镭射,紫外荧光,温感,复印防伪)行业标杆!精益求精,诚心合作,真诚制作!多年品质 ,按需精细制作,24小时接单,全套进口原装设备,十五年致力于帮助留学生解决难题,业务范围有加拿大、英国、澳洲、韩国、美国、新加坡,新西兰等学历材料,包您满意。
【业务选择办理准则】
一、工作未确定,回国需先给父母、亲戚朋友看下文凭的情况,办理一份就读学校的毕业证【微信:A575476】文凭即可
二、回国进私企、外企、自己做生意的情况,这些单位是不查询毕业证真伪的,而且国内没有渠道去查询国外文凭的真假,也不需要提供真实教育部认证。鉴于此,办理一份毕业证【微信:A575476】即可
三、进国企,银行,事业单位,考公务员等等,这些单位是必需要提供真实教育部认证的,办理教育部认证所需资料众多且烦琐,所有材料您都必须提供原件,我们凭借丰富的经验,快捷的绿色通道帮您快速整合材料,让您少走弯路。
留信网认证的作用:
1:该专业认证可证明留学生真实身份
2:同时对留学生所学专业登记给予评定
3:国家专业人才认证中心颁发入库证书
4:这个认证书并且可以归档倒地方
5:凡事获得留信网入网的信息将会逐步更新到个人身份内,将在公安局网内查询个人身份证信息后,同步读取人才网入库信息
6:个人职称评审加20分
7:个人信誉贷款加10分
8:在国家人才网主办的国家网络招聘大会中纳入资料,供国家高端企业选择人才
→ 【关于价格问题(保证一手价格)
我们所定的价格是非常合理的,而且我们现在做得单子大多数都是代理和回头客户介绍的所以一般现在有新的单子 我给客户的都是第一手的代理价格,因为我想坦诚对待大家 不想跟大家在价格方面浪费时间
对于老客户或者被老客户介绍过来的朋友,我们都会适当给一些优惠。
选择实体注册公司办理,更放心,更安全!我们的承诺:可来公司面谈,可签订合同,会陪同客户一起到教育部认证窗口递交认证材料,客户在教育部官方认证查询网站查询到认证通过结果后付款,不成功不收费!
Business storytelling: key ingredients to a story
Storytelling is an incredibly valuable tool to share data and information. To get the most impact from stories there are a number of key ingredients. These are based on science and human nature. Using these elements in a story you can deliver information impactfully, ensure action and drive change.
❼❷⓿❺❻❷❽❷❼❽ Dpboss Matka Result Satta Matka Guessing Satta Fix jodi Kalyan Fin...
❼❷⓿❺❻❷❽❷❼❽ Dpboss Matka Result Satta Matka Guessing Satta Fix jodi Kalyan Fin...❼❷⓿❺❻❷❽❷❼❽ Dpboss Kalyan Satta Matka Guessing Matka Result Main Bazar chart
❼❷⓿❺❻❷❽❷❼❽ Dpboss Matka Result Satta Matka Guessing Satta Fix jodi Kalyan Final ank Satta Matka Dpbos Final ank Satta Matta Matka 143 Kalyan Matka Guessing Final Matka Final ank Today Matka 420 Satta Batta Satta 143 Kalyan Chart Main Bazar Chart vip Matka Guessing Dpboss 143 Guessing Kalyan night Income Tax exemption for Start up : Section 80 IAC
A presentation on the concept of Exemption of Profits of Start ups from Income Tax
Recently uploaded (20)
NIMA2024 | De toegevoegde waarde van DEI en ESG in campagnes | Nathalie Lam |...
NIMA2024 | De toegevoegde waarde van DEI en ESG in campagnes | Nathalie Lam |...
The Genesis of BriansClub.cm Famous Dark WEb Platform
The Genesis of BriansClub.cm Famous Dark WEb Platform
Satta Matka Dpboss Matka Guessing Kalyan Chart Indian Matka Kalyan panel Chart
Satta Matka Dpboss Matka Guessing Kalyan Chart Indian Matka Kalyan panel Chart
The APCO Geopolitical Radar - Q3 2024 The Global Operating Environment for Bu...
The APCO Geopolitical Radar - Q3 2024 The Global Operating Environment for Bu...
3 Simple Steps To Buy Verified Payoneer Account In 2024
3 Simple Steps To Buy Verified Payoneer Account In 2024
HOW TO START UP A COMPANY A STEP-BY-STEP GUIDE.pdf
HOW TO START UP A COMPANY A STEP-BY-STEP GUIDE.pdf
Taurus Zodiac Sign: Unveiling the Traits, Dates, and Horoscope Insights of th...
Taurus Zodiac Sign: Unveiling the Traits, Dates, and Horoscope Insights of th...
Dpboss Matka Guessing Satta Matta Matka Kalyan Chart Satta Matka
Dpboss Matka Guessing Satta Matta Matka Kalyan Chart Satta Matka
Registered-Establishment-List-in-Uttarakhand-pdf.pdf
Registered-Establishment-List-in-Uttarakhand-pdf.pdf
❼❷⓿❺❻❷❽❷❼❽ Dpboss Matka Result Satta Matka Guessing Satta Fix jodi Kalyan Fin...
❼❷⓿❺❻❷❽❷❼❽ Dpboss Matka Result Satta Matka Guessing Satta Fix jodi Kalyan Fin...
Income Tax exemption for Start up : Section 80 IAC
Income Tax exemption for Start up : Section 80 IAC
A picture of poverty on the north shore, 2 timothy reardon, mapc
- 1. A Picture of Poverty on the North Shore Recent Trends and New Challenges Confronting Poverty on the North Shore 19 November 2013 Timothy G. Reardon Assistant Director of Data Services Metropolitan Area Planning Council
- 2. North Shore Poverty by the Numbers Number of People in Poverty Population in Poverty, by Household Type, North Shore Task Force, 2007 - 2011 8,000 Non-Family Households 7,000 6,000 Family Households, No Spouse Present 5,000 4,000 3,000 Family Households, Married Couple 2,000 1,000 0 Under 25 25 - 44 45 - 64 Age of Householder 65 plus
- 4. Poverty Concentrated in Four Cities Population inin Poverty, Population Poverty, North Shore Subregion, 2007 - 2011 North Shore Subregion, 2007 - 2011 5,500 5,500 Number of Residents in Poverty Number of Residents in Poverty 5,000 5,000 Labels indicate municipal share of subregion's poverty 25% 4,500 4,500 4,000 4,000 3,500 3,500 3,000 3,000 17% 16% 2,500 2,500 13% 2,000 2,000 1,500 1,500 1,000 1,000 500 500 8% 6% 4% 3% 2% 2% 2% 2% <1% <1% <1% <1% -- 71% of total Source: American Community Survey, 2007 - 2011
- 6. The Shifting Landscape of Poverty
- 9. The Challenges of Suburban Poverty
- 10. The Challenges of Suburban Poverty
- 11. The Challenges of Suburban Poverty
- 12. The Challenges of Suburban Poverty
- 14. A Picture of Poverty on the North Shore Recent Trends and New Challenges Confronting Poverty on the North Shore 19 November 2013 Timothy G. Reardon Assistant Director of Data Services Metropolitan Area Planning Council