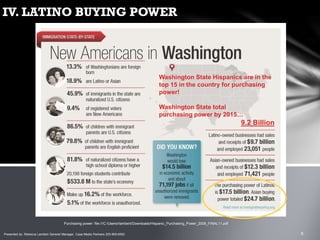
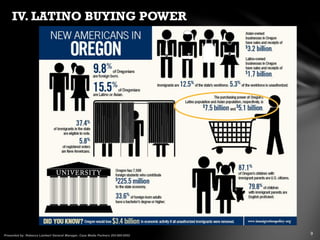
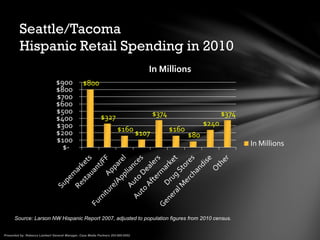
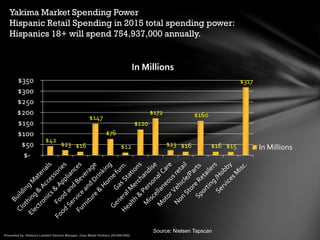
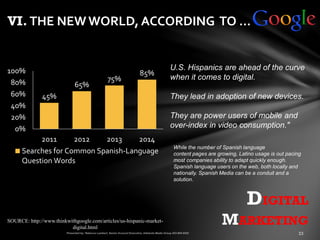
The document provides information on the Hispanic population and market in the Pacific Northwest region of the United States. It discusses:
1) The large and growing Hispanic population in the region, particularly in Washington and Oregon, with over 50% growth in Washington between 2000-2013 and 64% growth in Oregon between 2000-2010.
2) Spending power and retail spending of Hispanics in key metropolitan areas of the region, with Hispanic retail spending reaching hundreds of millions of dollars annually in Seattle, Portland, and Yakima.
3) The diverse acculturation levels of Hispanics in the region and considerations for businesses in marketing and communicating cross-culturally to the Hispanic population.
Marketing to Hispanic shoppers is rapidly changing. This deck outlines key trends for reaching the Hispanic shopper on mobile and social, as well as key demographic insights.
Hispanic marketing is delivering culturally relevant communications to a specific target audience. BARD has put together some key insights based on marketing trends to help you out when building a marketing campaign to Hispanics.
The Multicultural Customer Experience: Localizing Your Marketing Campaign for...Lionbridge
The Hispanic population is the fastest growing, most connected audience on the planet. In today’s digital world, consumers expect a consistent and well branded omni- channel experience. The Hispanic population are early digital adopters, meaning your brand needs to be ahead of the curve when targeting this population.
You will learn:
-Why you should localize your marketing campaigns
-The media mix the Hispanic population is responding to
- How to assemble a strategy for and manage a multilingual campaign
This presentation was given by Environics Research Group (www.environics.ca) Environics Analytics (www.environicsanalytics.ca) and Maple Diversity (www.maplediversity.ca) at the Direct Marketing Breakfast Seminar August 2013
An in-depth look of how online shopping habits have changed from this year to last across Hispanic, African-American, Asian, and non-Hispanic white consumers.
The report covers the following topics:
1. Find out the frequency of buying something online & in-person
2. Devices used when buying products online
3. Product categories bought online
And much more...
On the Rise: The Growing Influence of the Hispanic ShopperAlcance Media Group
The Hispanic market is a bright spot in the U.S. grocery shopping landscape. The fastest growing ethnic segment in the U.S. has massive buying power and broad influence that extends well beyond its own ethnic group.
This SlideShares discusses how to correctly market to Hispanics in the US. In this first section there's information about demographics, statistics and a market overview. This part can help marketers become more informed about this growing demographic.
"Portrait of the New America" covers the attitudes, behaviors and perspectives on life in the U.S., organized around seven themes.
Its to understand what drives the nation’s 80 million Hispanics, African Americans and Asian Americans
Portrait Background
Communications & Culture
Connectivity & Culture
Conversation & Culture
Community & Culture
Pride Factor Analysis
It’s a Small World
Census data segmented over time showing how the Hispanic populations of Orlando, Tampa/St. Petersburg and Miami/Ft. Lauderdale DMAs have become more diverse from 2000 to 2010 and into 2020. Specifically, the data shows how the share of the Cuban population is declining, even though the Cuban population continues to grow.
“imagine all the people” is a series of publications produced by
the Boston Redevelopment Authority for the Mayor’s Office of
New Bostonians, that provides a comprehensive profile of Boston’s diverse immigrant communities and their numerous contributions to the city’s social, cultural, and economic landscape. It is part of an ongoing effort to celebrate new Bostonians and gain insight into how our city is shaped by their presence.
Our Report explores the impact of culture on the Millennial consumption of media, technology, and entertainment - how Social media heavily influences entertainment consumption, how new technology & wearables are making inroads. etc.
The Changing Face of America: United States Latino Population InfographicSymrise
A useful infographic from Symrise North America on the United States Latino population. This infographic features demographics, geographic distribution, cultural values, and food and beverage implications.
Looking for more content like this? Visit http://in-sight.symrise.com
For more information contact Symrise NA (dylan.thompson@symrise.com).
A unique or creative idea for an advertisement or campaign that attracts consumers’ attention, gets a reaction, and sets the advertisers product or service apart form the competition.
Find out what’s happening on social media and what it means for your business. The quarterly trend report from The Social Lights summarizes the major social media network updates and provides recommendations for how businesses can take advantage of the new opportunities.
Social Networks included in the Q1 Social Media Trends Report:
- Facebook
- Twitter
- Instagram
- Snapchat
Want to stay informed about changes in social media? Check out The Social Lights’ blog: thesocial-lights.com/subscribe
Regional Snapshot: Metro Atlanta's Hispanic and Latino CommunityARCResearch
This month's Regional Snapshot explores the foreign born population in metro Atlanta, focusing on the largest contributor to our foreign born population growth - the Hispanic and Latino community.
Jamestown Latin America Trends + Views Urbanization Trends in Latin AmericaFerhat Guven
Our latest “Trends and Views” piece addresses the concept of urbanization in Latin America,
and its potential impact on the region’s real estate market.
Burson Latino leverages our experts, their experience and Burson-Marsteller’s strategic communications approach and innovative tools to help clients connect and engage with the dynamic and fast-growing U.S. Hispanic population. We build carefully tailored, insight-driven programming that goes beyond a simple translation of messaging.
2015 DATOS AZ OYE! Intelligence Education & Entertainment ReportOYE! Intelligence
For 19 years, the Arizona Hispanic Chamber’s DATOS: The State of the Hispanic Market report has been tracking, measuring and analyzing the ongoing economic, political and cultural transformation being driven by the state’s fast-growing Hispanic population. This year’s DATOS report is focused on education and as such OYE! endeavored to provide insights from both national and regional Latinos on their thoughts about this important topic.
Latino Buying Power - May 2024 Presentation for Latino CaucusDanay Escanaverino
Unlock the potential of Latino Buying Power with this in-depth SlideShare presentation. Explore how the Latino consumer market is transforming the American economy, driven by their significant buying power, entrepreneurial contributions, and growing influence across various sectors.
**Key Sections Covered:**
1. **Economic Impact:** Understand the profound economic impact of Latino consumers on the U.S. economy. Discover how their increasing purchasing power is fueling growth in key industries and contributing to national economic prosperity.
2. **Buying Power:** Dive into detailed analyses of Latino buying power, including its growth trends, key drivers, and projections for the future. Learn how this influential group’s spending habits are shaping market dynamics and creating opportunities for businesses.
3. **Entrepreneurial Contributions:** Explore the entrepreneurial spirit within the Latino community. Examine how Latino-owned businesses are thriving and contributing to job creation, innovation, and economic diversification.
4. **Workforce Statistics:** Gain insights into the role of Latino workers in the American labor market. Review statistics on employment rates, occupational distribution, and the economic contributions of Latino professionals across various industries.
5. **Media Consumption:** Understand the media consumption habits of Latino audiences. Discover their preferences for digital platforms, television, radio, and social media. Learn how these consumption patterns are influencing advertising strategies and media content.
6. **Education:** Examine the educational achievements and challenges within the Latino community. Review statistics on enrollment, graduation rates, and fields of study. Understand the implications of education on economic mobility and workforce readiness.
7. **Home Ownership:** Explore trends in Latino home ownership. Understand the factors driving home buying decisions, the challenges faced by Latino homeowners, and the impact of home ownership on community stability and economic growth.
This SlideShare provides valuable insights for marketers, business owners, policymakers, and anyone interested in the economic influence of the Latino community. By understanding the various facets of Latino buying power, you can effectively engage with this dynamic and growing market segment.
Equip yourself with the knowledge to leverage Latino buying power, tap into their entrepreneurial spirit, and connect with their unique cultural and consumer preferences. Drive your business success by embracing the economic potential of Latino consumers.
**Keywords:** Latino buying power, economic impact, entrepreneurial contributions, workforce statistics, media consumption, education, home ownership, Latino market, Hispanic buying power, Latino purchasing power.
Hispanic market
By 2025, U.S. Hispanics will represent
25% of the total U.S. population.
As the Hispanic population grows, so does their purchasing power.
El Club de Comerciantes can cost-effectively promote your service, product and brand to Hispanic consumers and media. The following are tools that can help you understand and target the Hispanic market.
2019 State of Hispanic Wealth Report by NAHREP GREATER LAS VEGASJesse B. Lucero
HWP has released its annual State of Hispanic Wealth Report. The report found that Latinos have experienced four consecutive years of homeownership growth, three straight years of income growth, and the lowest poverty rate since estimates were first published by the U.S. Census Bureau in 1972. Get your copy today
1. The NEW Cultural Economy in the Pacific Northwest.
2015 Hispanic Market Update
Population, Spending, and Business.
2. I.The new American reality
The estimated Hispanic population of the United States is 54,000,000 (as of July 2013),
making people of Hispanic origin the nation's largest ethnic or race minority.
Hispanics constituted 17 percent of the nation's total population. In addition, there are
3.7 million residents of Puerto Rico, a U.S. territory.
Source: 2013 Population Estimates.
SOURCE: http://www.census.gov/popest/data/national/asrh/2011/index.html> http://latino.foxnews.com/latino/news/2012/05/22/census-undercounts-minorities-by-15-
million/
The 2010 census failed
to count over 1.5 million
Minorities.
the census missed about
2.1 percent of black
Americans and 1.5 percent
of Hispanics, together
accounting for some
1.5 million people.
3. The incoming generation of consumers.
http://www.pewresearch.org/fact-tank/2014/07/08/a-view-of-the-future-through-kindergarten-demographics/
4. II. LATINOS IN WESTERNWASHINGTON
108% growth
2000-2013!
Now let’s talk about density.
Washington State: 11.7%
Total Hispanic population: 970,112
Eastern Washington:
Yakima County: 143,475 (46.3%)
Franklin County: 52,405 (50.9%)
WesternWashington:
King County: 225,815 (11.7%)
Pierce County: 93,246 (9.6%)
Snohomish County: 84,225 (9.3%)
DMA % Growth 2000-
2013
Charlotte, NC 168%
Raleigh area N.C 138.9%
Atlanta, GA 126.9%
Orlando Area, Fla. 125.1%
Ft. Myers-Naples Fla. 125.1%
Oklahoma City, Okla. 119.2%
Tampa Area, Fla. 112.2%
W. Palm Beach Area,
Fla.
110.9%
Seattle-Tacoma, WA 108.3%
Washington area, D.C 108.1%
Source: Neilsen
10 FASTEST GROWING DESIGNATED MARKET
AREAS AMONG HISPANICS (POPULATION 200,000+)
According to Geoscape, Of the 25 largest populated US markets in
2018, the three markets with the highest projected Hispanic growth
rates between 2010 and 2018 are Raleigh-Durham, NC, Seattle-
Tacoma, WA, and St. Louis, MO
http://www.nielsen.com/us/en/insights/news/2013/latino-populations-are-growing-fastest-where-we-arent-looking.html
The 2013 American Marketscape DataStream report.
Number adjustments: Census fingures + .16%
5. II. LATINOS IN EASTERN WASHINGTON
Eastern
Washington
Experienced an
average of 66% growth
from 2000-2010
http://www.nielsen.com/us/en/insights/news/2013/latino-populations-are-growing-fastest-where-we-arent-looking.html
Datas Sources http://projects.nytimes.com/census/2010/map, and http://projects.nytimes.com/census/2010/map .
Market % of
population
Growth
through 2010
Population
2015
Yakima 47% 53% 263,675
Tri-Cities
(average)
35% 108% 99,557
Wenatchee 32% 79% 22,167
Hermiston
OR
35% 23% 19,074
Numbers for Markets include surrounding marketing areas.
Tri-Cities includes Richland Kennewick, Pasco
Wentachee includes Moses Lake, Leavenworth, and Waterville.
Yakima includes all Yakima Valley including Sunnyside, Grandview, and Benton City.
Included Hermiston Oregon.
(other areas outside of “Cities” were used in compiling this data)
Anticipated growth is based on percentage of growth from 2000-2010, and adjusted to 5 years of continued average growth.
6. II. LATINOS IN OREGON
64% growth
2000-2010!
Oregon's non-Hispanic white population grew by
Only 5%!
Total Hispanic population: *594,081
TopTen Counties 2010% 2015%
Malheur 31.5 41.5
Morrow 31.3 41
Hood River 29.5 39
Marion 25.3 33
Umatilla 24 31.5
Jefferson 19.3 25
Washington 15.7 20.7
Wasco 14.8 19
Yamhill 14.7 19
Polk 12 15.8
Jackson 10.7 14
Klamath 10.4 13.7
Tillamook 9 12
7. II. LATINOS IN OREGON
• Hispanics are growing eight times faster than non-Hispanics
(63.5% vs. 7.5%) in Oregon and accounted for 43% of overall
growth in the state.
Oregon’s 11,338 Latino-owned businesses had sales
and receipts of $1.7 billion and employed 13,916
people in 2007, the last year for which data is
available, according to the U.S. Census Bureau’s
Survey of Business Owners.
8. IV. LATINO BUYING POWER
Washington State Hispanics are in the
top 15 in the country for purchasing
power!
Washington State total
purchasing power by 2015…
9.2 Billion
Purchasing power: file:///C:/Users/rlambert/Downloads/Hispanic_Purchasing_Power_2008_FINAL11.pdf
Presented by: Rebecca Lambert General Manager, Casa Media Partners 253-905-6552
10. Seattle/Tacoma
Hispanic Retail Spending in 2010
Source: Larson NW Hispanic Report 2007, adjusted to population figures from 2010 census.
$800
$327
$160 $107
$374
$160
$80
$240
$374
$-
$100
$200
$300
$400
$500
$600
$700
$800
$900
In Millions
In Millions
11. Yakima Market Spending Power
Hispanic Retail Spending in 2015 total spending power:
Hispanics 18+ will spend 754,937,000 annually.
$42
$23 $16
$147
$76
$12
$120
$172
$23 $16
$160
$16 $15
$317
$-
$50
$100
$150
$200
$250
$300
$350
In Millions
In Millions
Source: Nielsen Tapscan
12. Portland/ Oregon
Hispanic Retail Spending in 2010
Source: Larson NW Hispanic Report 2007, adjusted to population figures form 2010 census.
$768
$288
$144 $96
$336
$176
$72
$196
$324
$-
$100
$200
$300
$400
$500
$600
$700
$800
$900
In Millions
In Millions
13. Hispanics out performed in Spending
expectations!
Source: Acosta Research and Marketing
Jacksonville, FL — From spending on groceries to enjoying shopping, Hispanic consumers
outperform their total U.S. counterparts nearly every time, according to research from Acosta
Sales & Marketing and Univision Communications, Inc.
For example, Hispanic shoppers spend an average of $361 per month on groceries; the total
U.S. population spends $331 on average. Further, nearly three-quarters of Hispanic consumers
say they enjoy grocery shopping, compared with 16 percent of the total population.
In addition, nearly 80 percent of Hispanics shop with someone else, increasing the likelihood of
sharing their purchase decisions.
“The Hispanic consumer expects to be earning more and is spending more, as evidenced by
the fact that their monthly grocery spend is at the highest point in three years,” says Liz
Sanderson, Univision vice-president, strategy and insights. “Because grocery shopping
represents an opportunity to spend time with loved ones and engage with distinctive store
offerings, brands and retailers are presented with more valuable marketing opportunities.”
14. Census tract data: Lynnwood tract 515, Lakewood, 71805, Factoria 248, Everett: 41805, Tacoma 632, Puyallup South 73121, Federal Way 30006,
Oak Harbor: 9704, Bonney Lake 7031,
South Hill: 71207, Renton 262, Auburn 30801 Source: http://projects.nytimes.com/census/2010/map?ref=us Numbers: 2010 Census X 8.3% per year.
Formula: 108% /13= 8.30% X4= +33.2% for years 2010 to 2015
WHO IS IN YOUR
MARKETING AREA?
0%
10%
20%
30%
40%
50%
60%
34%
8%
55%
16%
16%
42%
12% 9%
13%
8%
22%
43%
Hispanic Density in Applebee’s 3 MILE MARKETING AREA.
23%
Presented by: Rebecca Lambert General Manager, Casa Media Partners 253-905-6552
15. The Baby Boomer Generation and
what it means to your business.
The US population age 65+ in 2010 = 40 million people.
BABY BOOMERS ARE AGEING OUT OF THE
CONSUMER POPULATION
By 2040 that number will equal 80 million people.
Source: US census data, 2010
IV. LATINO BUYING POWER
Presented by: Rebecca Lambert General Manager, Casa Media Partners 253-905-6552
16. This is WHY!
We need to be inclusive of our minority populations.
50 % of all new births are to minority families.
Hispanics now total 50 Million and
by 2037 there will be 100 million.
The "Latin Wave" is bigger than the baby boomer
generation ever was.
We need them educated, and we need them strong.
By 2047 minorities will become the majority.
Source: US Census Data, 2010
IV. LATINO BUYING POWER
Presented by: Rebecca Lambert General Manager, Casa Media Partners 253-905-6552
17. Hispanics are the only major racial or ethnic group to see a statistically
significant decline in its poverty rate, according to 2013 Census Bureau
figures released this week. The drop in the poverty rate among Hispanics –
from 25.6% in 2012 to 23.5% in 2013 – contributed to the first decline in the
nation’s overall poverty rate since 2006.
Hispanics also were the only group to see a decline in the number of
people living in poverty (the year-to-year changes in the overall U.S. number
was not statistically different.) From 2012 to 2013, the number of Hispanics in
poverty dropped from 13.6 million to 12.7 million, even as the Hispanic
population grew by 1 million over the same time period.
Hispanics only group to see its
poverty rate decline and incomes rise!
http://www.pewresearch.org/fact-tank/2014/09/19/hispanics-only-group-to-see-its-poverty-rate-decline-and-incomes-rise/
18. Hispanic Businesses & Entrepreneurs
Drive Growth in the New Economy
Number of Hispanic-
Owned Businesses in
the U.S.
‘02
‘07
‘14
1.5
Mil
2.26
Mil
3.22
Mil
White
68%
Black
9%
Latino
16%
Asian
4%
Other
3%
2003
White
62%Black
9%
Latino
20%
Asian
6%
Other
3%
2013
The most recent data
shows
the Latino share of all new
entrepreneurs is 20.4%,
compared to 16% a
decade ago.
19. PROJECTED PERCENT INCREASE IN NUMBER OF
HISPANIC-OWNED BUSINESSES FROM 2007TO 2014*
+35%
Pacific
OR 795,839.
+44%
Mountain +42% West
North Central
+32% East
North Central
+31%
New England
+29%
Middle
Atlantic
+57%
South Atlantic
+59%
East South Central
+46%
West South
Central
Presented by: Rebecca Lambert General Manager, Casa Media Partners 253-905-6552
20. Percentage of Business Owners and Self-Employed
by Hispanicity® Segment
36%
13%
15%
26%
10%
40%
14%
16%
25%
6%
35%
11%
16%
30%
9%
0%
5%
10%
15%
20%
25%
30%
35%
40%
45%
All Hispanics Hispanic Business Owners Self Employed Hispanics
Americanazado: Highly Acculturated
Nueva Latino : Advanced
Bu-Cutural: Mid level
Hispano: Lower Acculturation
Latin Americana: New immigrant
21. Among households headed by Hispanics, 46% are owner-
occupied. By comparison, among households headed by
whites, 72% are owner-occupied, as are 43% of black
households and 58% of Asian households.
Some 48% of native-born Latino households are owner-
occupied. By comparison, 44% of immigrant Latino
households are owner-occupied.
Among Hispanic immigrant household heads, the
homeownership rate is higher among those who have lived
in the U.S. longer—59% for those who arrived before 1990,
compared with 14% for those who arrived in 2006 or later.
Home Ownership
22. The biggest misconceptions
can keep your business
from prospering.
Common Stereotypes:
Only purchase at Hispanic shops.
Don’t have money for large purchases.
Keep all their money in cash,
don’t use banks or credit.
Are in the U.S.A Illegally.
Taking American jobs
Are all on Welfare and Subsidized
HealthCare.
"Talk funny" (i.e. - with an accent)
or can’t speak English
Eat only Mexican food
Very religious
Work as day laborers
Are gang members.
IV. UNDERSTANDING THE CULTURE
Presented by: Rebecca Lambert General Manager, Casa Media Partners 253-905-6552
23. THE LATINO PERSPECTIVE…
∆ Some Americans try to take advantage of Hispanics they
think we don’t know how to conduct business.
∆ Americans don’t want our business. But they do want us to
wash their dishes and mow their lawns.
∆ If I don’t have an introduction to your business, it will be
hard for you to gain my trust.
∆ I never know who I will meet when I open the door to your
business. Am I going to be welcome, or will I be judged.
This is why I usually do business where my friends and
family do.
∆ Americans speak to me either very slowly, very loudly, or
in a funny tone of voice. I’m not deaf, or incapable, I just
speak Spanish.
∆ Because I have not grown up with your brand, I am eager to
learn about it, if I like it, I’ll share it with my family and
friends.
Communicate with Latinos
IV. UNDERSTANDING THE CULTURE
24. IV. UNDERSTANDING THE CULTURE
SHOULDYOU STILL USE SPANISH?
• Even with English dominant Latinos, if asked
to choose a product that is advertised in
English or Spanglish, the product that was
advertised to them Bi-Lingually, was the
product that first captured their attention
• Spanish-language advertising is still 45
percent more effective than English
advertising in reaching this consumer
segment.
• For main message recall, commercials in
Spanish yield 56 percent higher
comprehension, and commercials in Spanish
are five times more persuasive in creating an
"intent-to-purchase" attitude.
Source: http://www.tandfonline.com/doi/abs/10.1080/10641734.1992.10504987#preview
25. Spanish use at home and English proficiency
About 12.3 million Hispanics ages 5 and older (26%) speak English at home
exclusively.That share is 39% among the U.S. born and 4% among the
foreign born.
Some 35.5 million Latinos ages 5 and older (74%) say they speak a language
other than English at home, whether or not they also speak English at home.
Among them, 35.3 million say the other language they speak is Spanish.
Among Hispanics (ages 5 and older) who speak a language other than
English at home, 56% report speaking English very well.
One-third of all Hispanics (33%) say they do not speak English very well.
Among immigrant Latinos, a language gap exists between children and
adults. Some 70% of immigrant children between ages 5 and 17 say they
speak only English or speak English very well. By comparison, just 32% of
immigrant adults say they speak only English or speak English very well.
Language use in 2015
26. IV. UNDERSTANDING THE CULTURE
Source: http://www.tandfonline.com/doi/abs/10.1080/10641734.1992.10504987#preview
http://genprogress.org/wp-content/uploads/archive/uploads/images/rally.jpg
http://blog.pureminutes.com
NEW IMMIGRANTS:
Spanish speaking.
Blue collar workers. Renters.
Service Business owners.
NEW AMERICANS &
SECOND GEN. LATINOS:
Bi-Lingual speaking. White
collar workers and Students.
Home Owners and Renters.
GEN MEX:
English Speaking.
Highly acculturated.
Professionals, Home Owners.
Credit and bank users.
Use cash and money orders. Little brand
recognition but are looking to adapt.
Rapidly adapting to wireless technology
to keep them connected back home.
Use cash, but have credit and bank
accounts. Highly brand loyal and trendy.
Fastest growing user of NEW
technologies.
Already have established brand loyalty,
very brand conscious.
Already highly adapted to technology.
HOW TO REACH THEM?
In Spanish
HOW TO REACH THEM?
Spanish, Spanglish and some
English
HOW TO REACH THEM?
English, but capture their
attention bi-lingually &
culturally
27. EVENT SIGNIFICANCE
Three Kings Day On January 6th, this event celebrates the three Kings arrival in Bethlehem. Toys are given to children, and a Rosca,
(cake-like pastry) is shared with a small baby Jesus inside. The person that gets the baby Jesus in their slice
should put the house for a party on Candlemas Day on February 2.
*IDEA* Toy sales, infant clothing sales. Rosca events.
La Quinceañera The celebration of a Latina’s 15th birthday. This is a religious as well as a social celebration.
*IDEA* Anything having to do with weddings in General Market can be adapted to Quinceañeras. Including
Tuxedo Rentals, Catering, Music, Formal Wear, Jewelry Sales.
Día de los Niños (April 30) A holiday recognizing children as the center of the Latino family.
*Idea* Children’s sales! Children’s events in stores, restaurants, etc.
Independecia de
Mexico
(16 de Septiembre)
Also known as Diez y Seis de Septiembre (September 15th), celebrating when Father Miguel Hidalgo & Costilla
made the cry for Mexico's freedom from Spain.
*Idea* Have some fun with your ads and recognize the difference between Cinco de Mayo (which isn’t celebrated
in Mexico) and Independence Day.
Day of the Dead
(Día de los
Muertos)
All Hollow's Eve and All Saints Day. A day to celebrate Ancestors and lost loved ones
*Idea* Take down the witches, leave the skeletons.
IV. UNDERSTANDING THE CULTURE
…means understanding what is important to the Hispanic community:
28. America's Corporations Can
No Longer Ignore Hispanic
Marketing Like Mitt Romney
Did… Forbes 11/12/2012
http://www.forbes.com/sites/glennllopis/2012/11/12/americas-corporations-can-no-longer-
ignore-hispanic-marketing-like-mitt-romney-did/
If pollster Matt Barreto is right, Latino voters in Washington
were one of the key factors in Gov.-elect Jay Inslee's win over
Republican candidate Rob McKenna.
Barreto estimates that about 148,000 Latinos voted in these
past elections, with another 140,000 potential voters who
remain unregistered to vote. And yet less than 5% of the total
amount spent on Campaigns and Candidates were done
through Spanish Media.
"People in Washington state have not come terms with the
potential and growth of Latino electorate," Barreto said.The
parties "still don't feel Latinos are voters."
NBC Latino and Washington Elections
V. LATINOS IN POLITICSSource: NBC Latino
http://nbclatino.com/2012/11/26/in-washington-the-latino-vote-rises-in-
importance/ http://www.followthemoney.org/database/nationalview.phtml
WHO WILL WAKE THE GIANT?
9.4% (or 310,067) of registered
voters in Washington were “New
Americans according to an analysis
of 2008 Census Bureau data by
Rob Paral & Associates.
In 2012 there were 271,000 Hispanic
eligible voters in Washington—the
12th largest Hispanic eligible voter
population nationally. 21% are
naturalized U.S. citizens.
……Pew Hispanic Center.
Of the 112,710,585 spent in
Washington in 2012, only .0002%
was spent in the Hispanic Market.
29. VI.THINKING AHEAD
MountVernon 49.5% 23.5%
Highline 31.6% 21.3%
Burlington-Edison 30.6% 0.9%
Tukwila 24.6% 34.6%
Clover Park 20% 9.8%
FederalWay 19.2% 12.8%
Auburn 18% 11.9%
Renton 17.7% 14.2%
Shelton 16.3% 6.8%
Mukilteo 14.6% 15.7%
Tacoma 14.2% 7.2%
Fife 14.2% 9.4%
Franklin Pierce 13.5% 12.4%
Kent 13% 15%
Bethel 12.7% 1.2%
Seattle 11.5% 12.1%
Ocean Beach 11.5% 2.8%
San Juan Island 10.1% 4.5%
Chehalis 10% 2.5%
Grandview School District in Eastern Washington is
87.2% Hispanic. Western Washington is already
seeing many of these students gravitating to
Western Washington searching for opportunity, or
creating it.
Transitional/Bi-lingual are students in ESL courses
Source: http://www.k12.wa.us/dataadmin/pubdocs/SchoolDistrictProfiles.pdf
% of Hispanic Children by State: http://www.pewhispanic.org/files/reports/140.pdf
* ESL Class numbers include all students who speak a language other than English.
of the total student population in our public schools, and 8% of private school enrollment
Hispanic students equal an average of 19%
School District % Latino * Students in
ESL classes
OPI 2013/2014 Data
30. • OREGON: 1st graders now represent 25% of the Public school students.
English Language Learners 2013
Source: https://www.k12.wa.us/LegisGov/2013documents/TransBilingual2013.pdf
VI.THINKING AHEAD
0
5000
10000
15000
20000
25000
30000
35000
40000
45000
2012-2013 2014-2015 2016-2017 2018-2019
1000 1000 1000 1000500 500 500 500
9500 10000 12000
15000
250 250
250
250
25000 25000
25000
25000
White
N.American
Hispanic
Black
Asian
31. Latinos are a very young community…17 years old. Connection to community
and culture are still a VERY significant part of who they are.
WHILE MANY LATINOS DO TUNE INTO ENGLISH MEDIA. WHAT
KEEPSTHEM COMING BACKTO SPANISH?
Television: Comcast, Telemundo, El Rey… All of these networks are
now freshening their offerings to reach a bi-lingual, bi-cultural audience.These
changes, no doubt, are bold and fresh alternatives meant to appeal to a new
generation of Hispanics who straddle between the American and Latino ways of
life. At the core of it all, culture, not language, is what keeps us coming back.
These networks are leveraging the idea of the cultural connection and
engagement revolution to lure these new generations of viewers.
Spanish Radio:
Spanish radios top format in the Pacific Northwest is Regional
Mexican. Many listeners may tune in to English AC, Rock, and other formats, but
cross over to Regional Mexican tells another story. For that, you would have to
understand the music. Like a Mexican Novella, Regional Mexican Music is made
up of Corridos, or Stories.These stories tell the History, and Culture of the
community. They are well loved, stories of Mexican life, love, and home that get
to the heart of the Hispanic consumer.
Coming back to Culture
VI.THINKING AHEAD
32. Which do you use?
TV
Cable: over 40 channels in Spanish with the Cable Latino package, but you can only buy one (Telemundo)
through your Cable representative Comcast Cable is not represented in the Eastern Washington and Central Oregon
Markets, so Charter is the option there. Dish Network: Over 80 channels on their DishLatino lineup. Local Station: Must
buy direct/still compete with the other larger/ network movie and sports channel lineups. . Local: All the other channels
are either Local (Univsion/Azteca, MundoFox), with only one localized show or Newscast, or Network, and outside of local
advertiser influence.
Radio:
Oregon has over 8 Spanish Radio Stations, Eastern Washington 10. and Seattle now has 8. Seattle now has
2 Spanish FM radio stati0ns, A Christian Broadcast station, and an FM Regional Mexican station, there are also multiple
AM stations in the market.
Print
With approximately 12 publications throughout the markets, it is hard to tell exactly what reach, where
they are distributed, and how many are reading them. There are currently NO daily Spanish papers in any of the
Northwest markets. Add to that the low educational achievements of many immigrants, and papers are likely not to carry
a broad enough reach on their own, though they make a good supplemental or addition to a broadcast buy.
Digital:
Spanish Digital is starting to take off, with some digital only radio stations, and even broadcast shows.
The numbers are still out on viewership.
Social:
Latinos are the fastest growing user of Social Media, fortunately, due to the lack of Spanish content on
the Web, creative Latinos are creating their own!
When you are considering advertising in any market, consider format. 70% of Latinos in the Pacific Northwest are of
Mexican origin, and the majority are NOT from Urban centers, like Mexico City. Just like you would look to a Country and
Western station to reach rural areas and people who come from those areas, consider that Regional Mexican , is the
Country and Western of the Mexican population. Radio, whether it is English or Spanish, is still sold by reach and
frequency, Seattle now is a PPM market, while the other regions in the Pacific Northwest remain diary markets.
SpanishTV, vs Radio, vs Print…..
33. DIGITAL
MARKETING
VI. THE NEWWORLD, ACCORDING TO …
SOURCE: http://www.thinkwithgoogle.com/articles/us-hispanic-market-
digital.html
45%
65%
75%
85%
0%
20%
40%
60%
80%
100%
2011 2012 2013 2014
Searches for Common Spanish-Language
Question Words
U.S. Hispanics are ahead of the curve
when it comes to digital.
They lead in adoption of new devices.
They are power users of mobile and
over-index in video consumption."
While the number of Spanish language
content pages are growing, Latino usage is out pacing
most companies ability to adapt quickly enough.
Spanish language users on the web, both locally and
nationally. Spanish Media can be a conduit and a
solution.
34. VI.THINKING AHEAD
HAVEYOU SENT
OUT THE
INVITATION?
Marketing Rules
for reaching this Segment:
Make a Commitment.
Be Open.
Be Honest.
Be Engaging.
Be Consistent.
Be Frequent.
Be Patient.