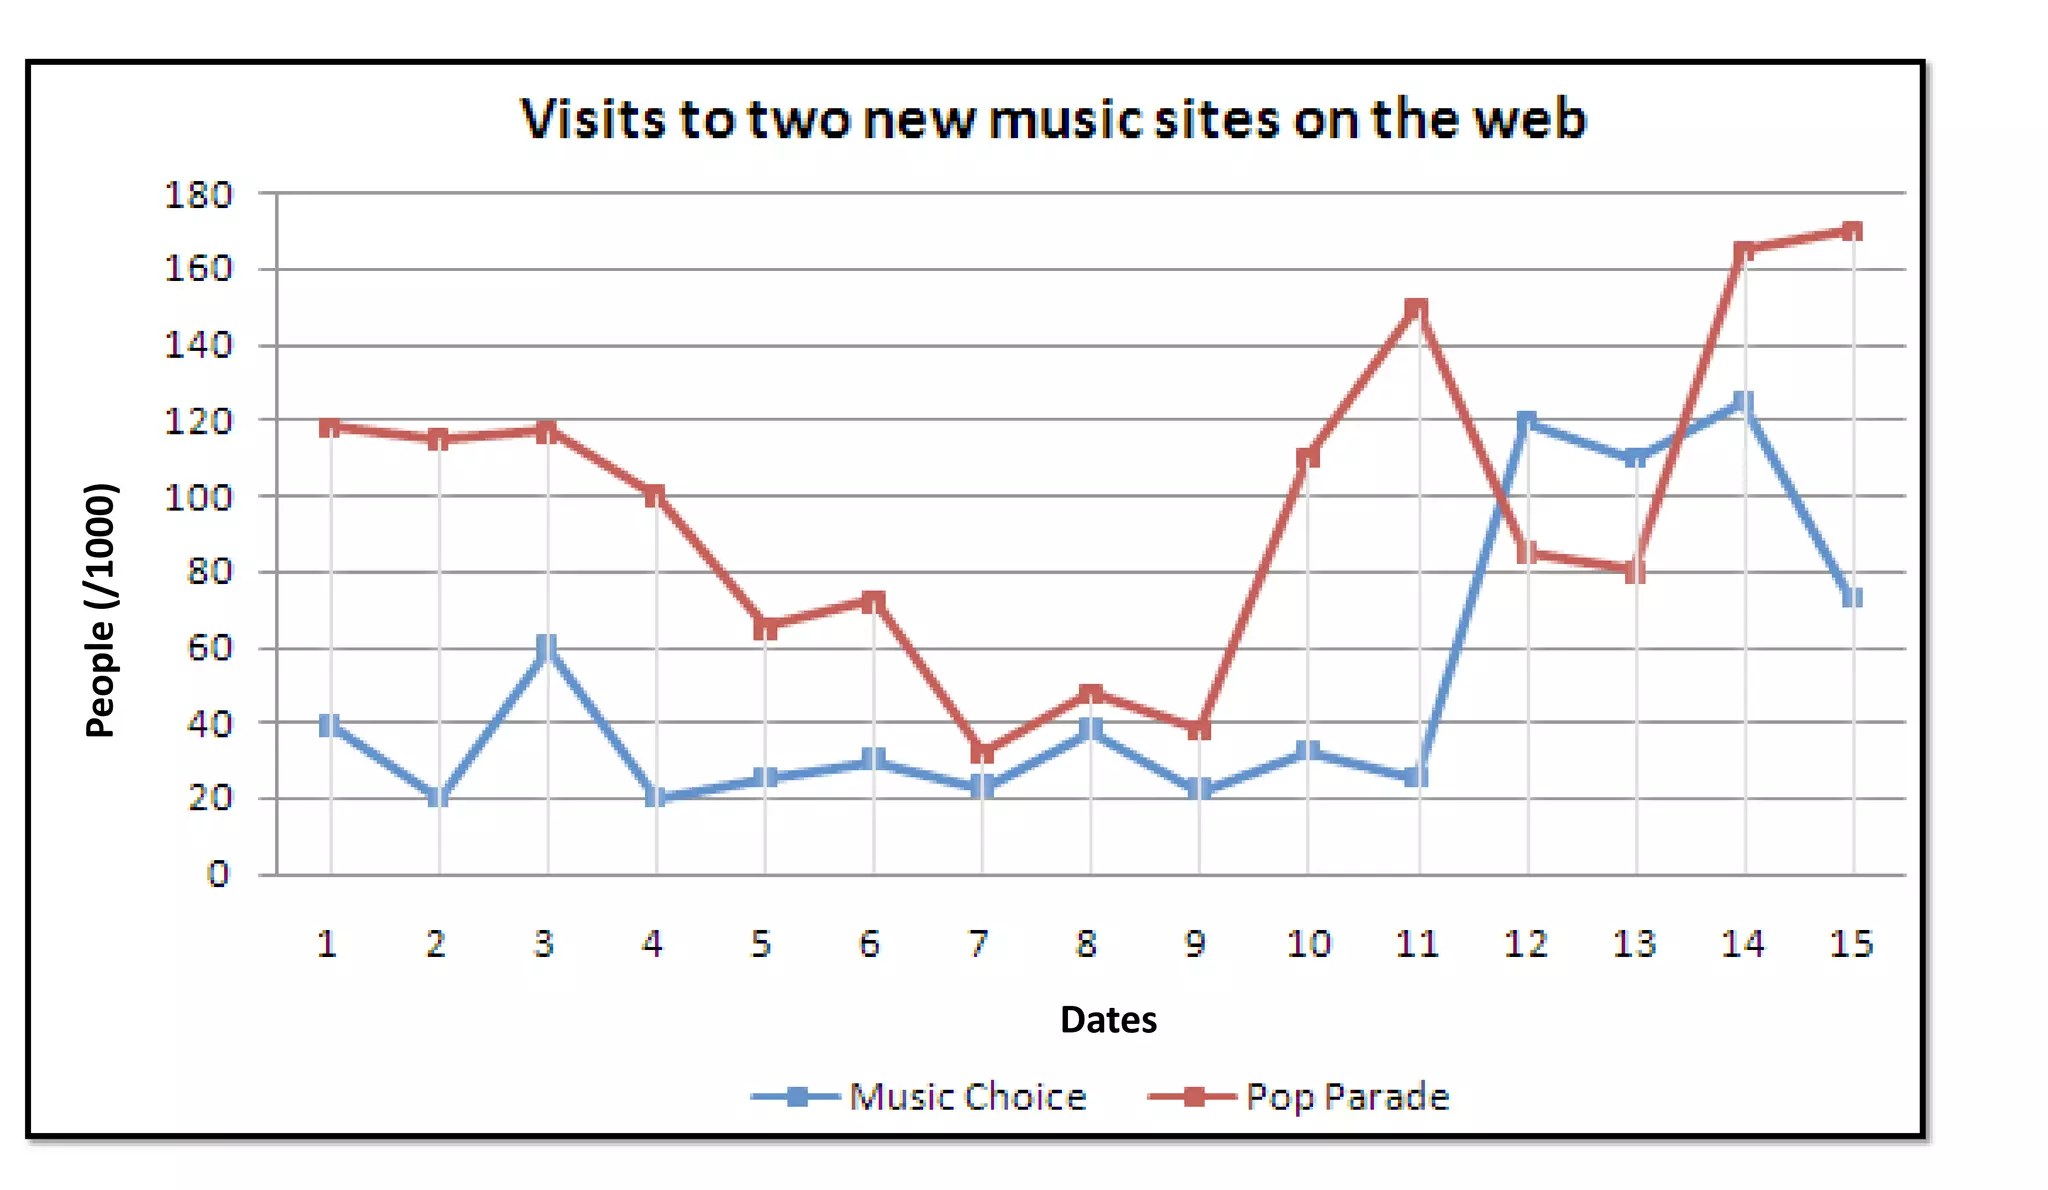
2. –Double line graphs is the
graphs compare two sets of
data overtime.
–Often they use two colors and
a code to show the set of
data
Definition
http: www.eduplace.com
4. -Must be ended with one or two
sentences
-Conclude the report
5.
6. The graph compares the rate of smoking in men and
women in Someland between the years 1960 and
2000. It can be clearly seen that the rate of smoking
for both men and women is currently declining and
that fewer women have smoked throughout the
period.
In 1960, 600 men in every 1,000 was smoking. This
number decreased gradually to 500 by 1975 and
continued to decrease but more steeply to 250 in
2000. In contrast, the rate of smoking in women in
1960 was very low at only 80 in every 1,000. By 1970
this increased to 170, and increased again but more
steeply to 320 in 1975. The rate of female smokers
then remained stable at 320 until 1980 at which
point the figures began to decline and had dropped
to 200 by 2000.
In conclusion we can see that the rate of smoking in
men dropped throughout the whole period but was
always at a higher level than the female figures. The
rate of smoking in women increased until 1975 but
then decreased for the rest of the period.
8. The graph compares the rates of people visiting new music webs between
Music Choice and Pop Parade from the first day to the fifteenth day of May
2014. The overall trend shows that the rate of visitors of both websites were
fluctuated with sharply Increase towards the end of the period.
In the first May, 120,000 people visited the web of Pop Parade, and fell
dramatically to 30,000 by the seventh day. There was a steep decrease in the
twelveth day to 85,000, and an increase happened in fifteenth day to
170,000. In contrast, the rate of people visit the web of Music Choice in the
first day was 40,000 people. This number decreased gradually to 20,000 by
the sevetn day. There was a rise in the seventh day to 120,000 people. It
continued to decline to 75,000 people by the fifteenth day..
In the end of the day, Pop Parade sites were visited by maximum viewers of
170,000 whereas sites located to Music Choice were not explored by more
than 75,000 explorers on the last day of the report.