Download to read offline
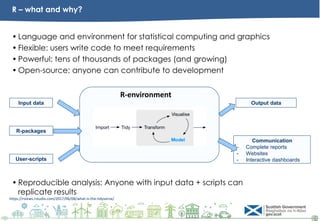
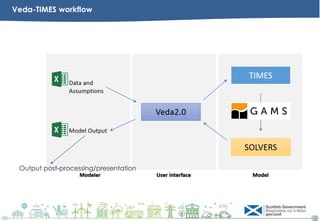
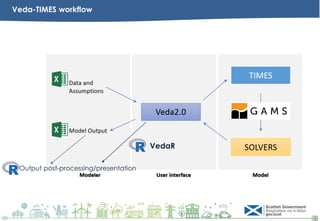
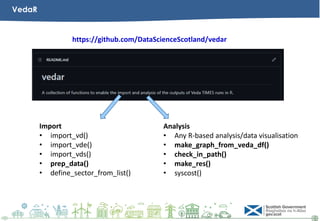
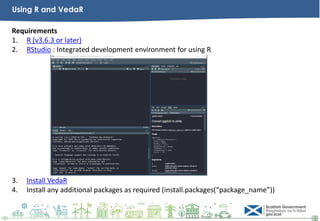

This document introduces VedaR, an R package for analyzing TIMES data. It discusses R and why it is useful for statistical computing and graphics. It then describes the VedaR workflow which allows users to import, analyze, and visualize TIMES data. Finally, it provides instructions for using R and VedaR and keeping up to date with new versions.