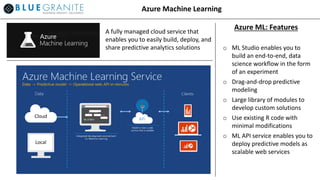
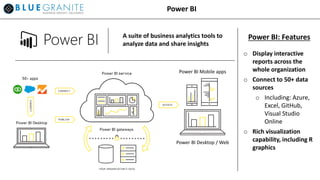
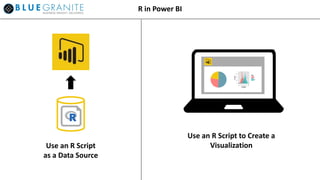
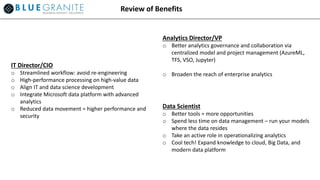
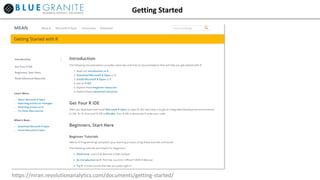
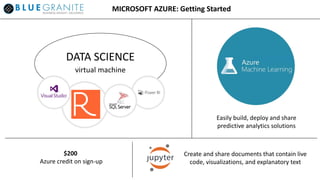
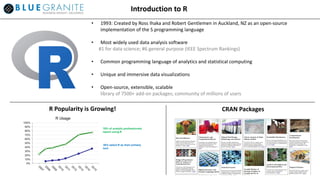
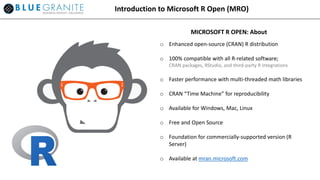
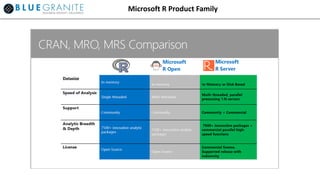
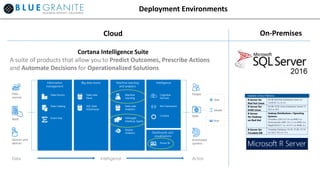
This document provides an overview of Microsoft R and its capabilities for advanced analytics. It discusses how Microsoft R can enable businesses to analyze large volumes of data across multiple environments including locally, on Azure, and with SQL Server and HDInsight. The presentation includes a demonstration of R used with SQL Server, HDInsight, Azure Machine Learning, and Power BI. It highlights how Microsoft R provides a unified platform for data science and analytics that allows users to write code once and deploy models anywhere.


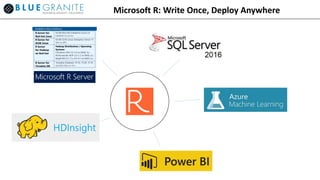
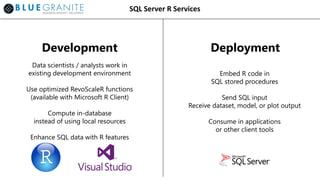
![SQL Server R Services
Development Deployment
EXEC sp_execute_external_script
@language = N’R’,
@script = N’[R code goes here]’,
@input_data_1 = N’[SQL input]’
[ , @input_data_1_name = N‘InputDataSet’ ]
[ , @output_data_1_name = N’OutputDataSet’ ]
[ , @params = N’parameter’ ]
WITH RESULT SETS (([SQL output]));
sql <- RxInSqlServer([SQL connection])
rxSetComputeContext(sql)
[…]
I/O RxSqlServerData(), etc.
Stats rxSummary(), etc.
Models rxLogit(), etc.
Plots rxRocCurve(), etc.](https://image.slidesharecdn.com/74b501f5-c4ee-490c-a179-ae439845cbff-160708081916/85/Bluegranite-AA-Webinar-FINAL-28JUN16-14-320.jpg)