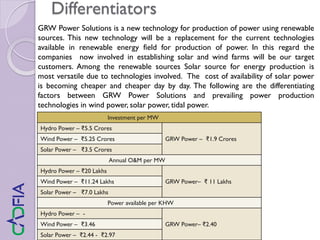
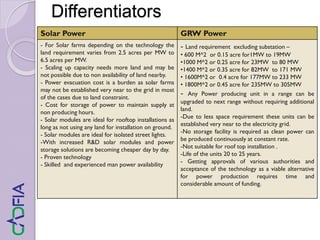
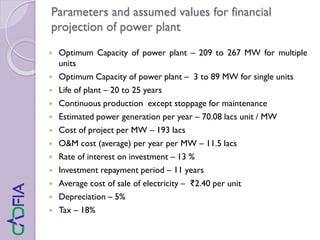
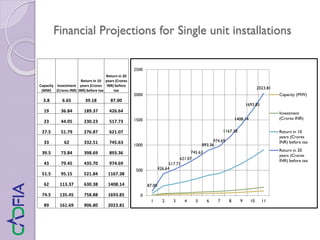
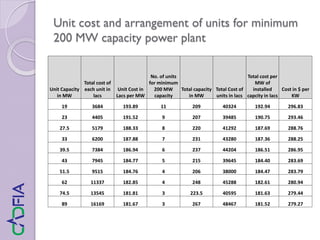
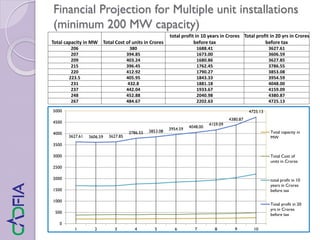
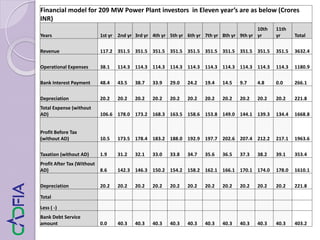
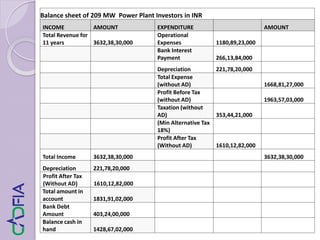
The document discusses a new clean technology for power generation in India. It provides context on India's growing power sector and energy demands. The new technology utilizes renewable energy sources to generate power and has several advantages over other renewable technologies like solar and wind such as requiring less land, providing continuous base load power, and being scalable. It then provides details on establishing a 209MW power plant using this new technology, including financial projections showing strong returns over 11 years.
ita a scheme statrted in 2009 by congress. earlier it waas known as jawahar lal nehru national solar mission bt recently its name change into national solar mission
As more & more renewables get integrated into the Indian Grid, Energy Storage will play an important role in helping with Grid Management & smoothing out the peak curve created by Renewable Energy.
It is expected that Energy Storage will be a multi GW market in the years to come.
Solar Power 2020: India On A National Solar MissionHIMADRI BANERJI
India can now make 700 megawatts of photovoltaic modules each year, according to the plan. The aim would be to make 20,000 megawatts of solar cells annually by 2017 and to establish expertise in solar thermal technologies.
Total costs would be 85,000 and 105,000 crores ($18.5 billion to $22.8 billion) over a 30-year period. To help finance the project, the plan foresees a significant tax on gasoline and diesel — fuels the government currently subsidizes.
Presentation on the status of "Achievement Under National Solar Mission (NSM)" till July'17.
The key highlight being that 13,115 MW of solar projects have been commissioned. The presentation outlays of how "100 GW" of target shall be achieved based on various schemes under progress. Also last few slides focus on Off Grid Targets under NSM.
This report on “Solar PV Sector in India: Challenges & Way ahead”, prepared by Tata Strategic Management Group, has a holistic view on the current state of solar sector in India. The key focus of the report is on identifying key challenges faced by different stakeholders in the Indian market and how a collaborative effort in the right direction could ensure the growth of the sector to realize its true potential
Solar in India have its own importance. It's the best opportunity for investors and this presentation explores it. If you need any further info please feel free to contact me. Viraj
Industrial Solar Rooftop System Installation Powerpoint Presentation SlidesSlideTeam
Introducing Industrial Solar Rooftop System Installation PowerPoint Presentation Slides. The purpose of this presentation is to reduce annual electricity bill costs by shifting to solar energy. By using this solar power plant PPT visuals, you can showcase the energy consumption analysis of the manufacturing plant. Present issues and challenges related to the solar system with the help of a ready-to-use PPT complete deck. After that, depict the solutions to counter energy issues using a content-ready solar system for industry PowerPoint layouts. Highlight the renewable technologies that the industry can adopt and cost overview of different technologies. You can also depict the application of the solar system and illustrate various solar PV integration model workflow. The slides also explain permissions and regulatory key considerations required before project implementation. Power plant details, along with project description and specifications, are also included in our PPT slideshow. Showcase decision-making checklist for the solar project by using the installation of renewable energy PPT infographics. Depict estimated cost for the solar project, implementation schedule, PV operational and maintenance plan, etc., by incorporating professionally designed solar rooftop system PPT slide deck. https://bit.ly/2SSa2bt
The presentation focuses on the investment opportunities in commercial and industrial rooftop building in India. Sensitivity analysis has been carried out for 11 states to understand the impact on project economics in terms of PIRR, EIRR, and payback periods.
This presentation highlights on the following :
Need of wind-solar hybrid systems
Indian policy support to hybrid systems - MNRE & Gujarat State
Renewable Energy integration with grid,
Cost savings in hybrid for AC-AC & DC-DC coupling systems,
Case studies
Grid Integration of Renewable Energy in India under Mitigation of High Penetration Challenges of Renewables into the Grid: Storage, Demand Response and Interconnections
Official Document of the Manipur solar policy 2014.
This document is not a work of Headway Solar (http://headwaysolar.com/) and it has been released here for the benefit of the general public.
Business Opportunities in Energy Sector. Business Ideas in Power Sector Proje...Ajjay Kumar Gupta
Business Opportunities in Energy Sector. Business Ideas in Power Sector Projects.
Power Project, Power Generation Plants, Hydroelectric Power, Gas-Fired Power Station, Coal, Thermal, Water, Hydro, Wind, Solar, Agro, Biogas Based Power Plants, Electrical Power Industry, Alternative, Renewable Power Generation, Electricity Generation
Power is one of the most critical components of infrastructure crucial for the economic growth and welfare of nations. The existence and development of adequate infrastructure is essential for sustained growth of the Indian economy.
India’s power sector is one of the most diversified in the world. Sources of power generation range from conventional sources such as coal, lignite, natural gas, oil, hydro and nuclear power to viable non-conventional sources such as wind, solar, and agricultural and domestic waste. Electricity demand in the country has increased rapidly and is expected to rise further in the years to come. In order to meet the increasing demand for electricity in the country, massive addition to the installed generating capacity is required.
See more
https://goo.gl/Kv5Gzh
https://goo.gl/oN41ge
https://goo.gl/DHt3bV
https://goo.gl/B22nrp
Contact us:
Niir Project Consultancy Services
An ISO 9001:2015 Company
106-E, Kamla Nagar, Opp. Spark Mall,
New Delhi-110007, India.
Email: npcs.ei@gmail.com , info@entrepreneurindia.co
Tel: +91-11-23843955, 23845654, 23845886, 8800733955
Mobile: +91-9811043595
Website: www.entrepreneurindia.co , www.niir.org
Tags
Co-Generation Power Plants in India, Cogeneration Plant, Bagasse & Co-generation of Renewable Energy, Cogeneration Power Plant, Bagasse Cogeneration in India, Biomass Power and Cogeneration in India, Co-Generation Power Plant Based on Bagasse, Transmission Tower & Tele Communication Tower with Galvanizing Plant, Towers and Galvanizing, Transmission Tower, Thermal Power Station, Gas Based Power Plant, Solar Power Plant, Sugar Mill, Distillery and Power Plant, Captive Power Plant, Thermal Power Plant (5 Mw), Coal Based Power Plant (500 Mw), Bagasse Based Cogeneration Power Plant, Bio Mass Gasification Power Plant, Biogas Power Plant from Cow Dung, Power Project for Glass Industry, Power Generation from Garbage, Biomass Power Generation Plant, Biogas Power Plant from Cow Dung project ideas, Projects on Small Scale Industries, Small scale industries projects ideas, Biomass Power Generation Plant Based Small Scale Industries Projects, Project profile on small scale industries, How to Start Biogas Power Plant from Cow Dung, Power Generation from Garbage Projects, New project profile on Biogas Power Plant from Cow Dung, Project Report on Power Generation from Garbage, Detailed Project Report on Power Generation from Garbage, Project Report on Co-Generation Power Plant, Pre-Investment Feasibility Study on Co-Generation Power Plant, Techno-Economic feasibility study on Biomass Power Generation Plant
Solar India - Sun Power is Solution to India's Energy Crisissolarindia
The report talks about Jawaharlal Nehru Solar Mission, Solar farms, SEZs, Solar technologies, Photovoltaics, PV trends, thin film solar panels, stocks /shares listed on Bombay stock exchange and National stock exchange in India
Optimization towards cost effective solar mini grids in bangladeshDipta Majumder
People living in remote rural areas e.g. islands of Bangladesh don’t have access to electricity due to financial and technical challenges. Solar Photovoltaic (PV)-Diesel based hybrid mini grids can be a way to electrify remote rural areas of Bangladesh. However, solar energy is costly compared to conventional energy sources. Hence, optimization is essential to ensure success of solar mini grids in remote rural areas. Optimization of mini grid plant capacity based on demand is discussed. Diesel consumption and excess electricity from plant are the key optimization parameters. A case at Paratoli, Narsingdi, Bangladesh is taken into consideration to validate the optimization. Data is further analyzed to find out the future requirements and effects after optimization.
A PROPOSAL FOR WIND-ENERGY CONVERSION FOR LOW WIND–SPEED AREAS OF INDIAIAEME Publication
This is the methodology to conversion of electricity through wind energy using convergent nozzle in low wind speed area. By the help of this process of conversion we convert low wind speed in sufficient power conversion with the use of nozzle. Then this maximizes the wind speed, that maximum wind speed rotate fan blade at useful speed level. And then sufficient amount of energy are produced
To promote the grid connected SPV rooftop and small SPV power generating plants among the residential, community, institutional, industrial and commercial establishments.
Similar to A new Clean technology for Electricity Generation (20)
Saudi Arabia stands as a titan in the global energy landscape, renowned for its abundant oil and gas resources. It's the largest exporter of petroleum and holds some of the world's most significant reserves. Let's delve into the top 10 oil and gas projects shaping Saudi Arabia's energy future in 2024.
CFD Simulation of By-pass Flow in a HRSG module by R&R Consult.pptxR&R Consult
CFD analysis is incredibly effective at solving mysteries and improving the performance of complex systems!
Here's a great example: At a large natural gas-fired power plant, where they use waste heat to generate steam and energy, they were puzzled that their boiler wasn't producing as much steam as expected.
R&R and Tetra Engineering Group Inc. were asked to solve the issue with reduced steam production.
An inspection had shown that a significant amount of hot flue gas was bypassing the boiler tubes, where the heat was supposed to be transferred.
R&R Consult conducted a CFD analysis, which revealed that 6.3% of the flue gas was bypassing the boiler tubes without transferring heat. The analysis also showed that the flue gas was instead being directed along the sides of the boiler and between the modules that were supposed to capture the heat. This was the cause of the reduced performance.
Based on our results, Tetra Engineering installed covering plates to reduce the bypass flow. This improved the boiler's performance and increased electricity production.
It is always satisfying when we can help solve complex challenges like this. Do your systems also need a check-up or optimization? Give us a call!
Work done in cooperation with James Malloy and David Moelling from Tetra Engineering.
More examples of our work https://www.r-r-consult.dk/en/cases-en/
Welcome to WIPAC Monthly the magazine brought to you by the LinkedIn Group Water Industry Process Automation & Control.
In this month's edition, along with this month's industry news to celebrate the 13 years since the group was created we have articles including
A case study of the used of Advanced Process Control at the Wastewater Treatment works at Lleida in Spain
A look back on an article on smart wastewater networks in order to see how the industry has measured up in the interim around the adoption of Digital Transformation in the Water Industry.
Industrial Training at Shahjalal Fertilizer Company Limited (SFCL)MdTanvirMahtab2
This presentation is about the working procedure of Shahjalal Fertilizer Company Limited (SFCL). A Govt. owned Company of Bangladesh Chemical Industries Corporation under Ministry of Industries.
Sachpazis:Terzaghi Bearing Capacity Estimation in simple terms with Calculati...Dr.Costas Sachpazis
Terzaghi's soil bearing capacity theory, developed by Karl Terzaghi, is a fundamental principle in geotechnical engineering used to determine the bearing capacity of shallow foundations. This theory provides a method to calculate the ultimate bearing capacity of soil, which is the maximum load per unit area that the soil can support without undergoing shear failure. The Calculation HTML Code included.
Hybrid optimization of pumped hydro system and solar- Engr. Abdul-Azeez.pdffxintegritypublishin
Advancements in technology unveil a myriad of electrical and electronic breakthroughs geared towards efficiently harnessing limited resources to meet human energy demands. The optimization of hybrid solar PV panels and pumped hydro energy supply systems plays a pivotal role in utilizing natural resources effectively. This initiative not only benefits humanity but also fosters environmental sustainability. The study investigated the design optimization of these hybrid systems, focusing on understanding solar radiation patterns, identifying geographical influences on solar radiation, formulating a mathematical model for system optimization, and determining the optimal configuration of PV panels and pumped hydro storage. Through a comparative analysis approach and eight weeks of data collection, the study addressed key research questions related to solar radiation patterns and optimal system design. The findings highlighted regions with heightened solar radiation levels, showcasing substantial potential for power generation and emphasizing the system's efficiency. Optimizing system design significantly boosted power generation, promoted renewable energy utilization, and enhanced energy storage capacity. The study underscored the benefits of optimizing hybrid solar PV panels and pumped hydro energy supply systems for sustainable energy usage. Optimizing the design of solar PV panels and pumped hydro energy supply systems as examined across diverse climatic conditions in a developing country, not only enhances power generation but also improves the integration of renewable energy sources and boosts energy storage capacities, particularly beneficial for less economically prosperous regions. Additionally, the study provides valuable insights for advancing energy research in economically viable areas. Recommendations included conducting site-specific assessments, utilizing advanced modeling tools, implementing regular maintenance protocols, and enhancing communication among system components.
Immunizing Image Classifiers Against Localized Adversary Attacksgerogepatton
This paper addresses the vulnerability of deep learning models, particularly convolutional neural networks
(CNN)s, to adversarial attacks and presents a proactive training technique designed to counter them. We
introduce a novel volumization algorithm, which transforms 2D images into 3D volumetric representations.
When combined with 3D convolution and deep curriculum learning optimization (CLO), itsignificantly improves
the immunity of models against localized universal attacks by up to 40%. We evaluate our proposed approach
using contemporary CNN architectures and the modified Canadian Institute for Advanced Research (CIFAR-10
and CIFAR-100) and ImageNet Large Scale Visual Recognition Challenge (ILSVRC12) datasets, showcasing
accuracy improvements over previous techniques. The results indicate that the combination of the volumetric
input and curriculum learning holds significant promise for mitigating adversarial attacks without necessitating
adversary training.
Water scarcity is the lack of fresh water resources to meet the standard water demand. There are two type of water scarcity. One is physical. The other is economic water scarcity.
2. Power Sector in India
Power is one of the most critical components of infrastructure crucial for the
economic growth and welfare of nations.
India’s power sector is one of the most diversified in the world. Sources of power
generation range from conventional sources such as coal, lignite, natural gas, oil, hydro
and nuclear power to viable non-conventional sources such as wind, solar, and
agricultural and domestic waste.
Electricity demand in the country has increased rapidly and is expected to rise further
in the years to come. In order to meet the increasing demand for electricity in the
country, massive addition to the installed generating capacity is required.
India ranks third among 40 countries in EY’s Renewable Energy Country Attractiveness
Index, on back of strong focus by the government on promoting renewable energy and
implementation of projects in a time bound manner.
Under the 12th FiveYear Plan, the Government has added 93.5 GW of power
generation capacity, thereby surpassing its target of 88.5 GW during the period.
The annual growth rate in renewable energy generation has been estimated to be 27
per cent and 18 per cent for conventional energy.
Around 293 global and domestic companies have committed to generate 266 GW of
solar, wind, mini-hydel and biomass-based power in India over the next 5–10 years.The
initiative would entail an investment of about US$ 310–350 billion.
The Government of India has identified power sector as a key sector of focus so as to
promote sustained industrial growth.
3. The Opportunity
The Indian power sector has an investment potential of Rs 15 trillion (US$ 225
billion) in the next 4–5 years, thereby providing immense opportunities in power
generation, distribution, transmission, and equipment, according to the Govt. of
India.
The government’s immediate goal is to generate two trillion units (kilowatt hours)
of energy by 2019. This means doubling the current production capacity to provide
24x7 electricity for residential, industrial, commercial and agriculture use.
The Government of India is taking a number of steps and initiatives like 10-year
tax exemption for solar energy projects, etc., in order to achieve India's ambitious
renewable energy targets of adding 175 GW of renewable energy, including
addition of 100 GW of solar power, by the year 2022. The government has also
sought to restart the stalled hydro power projects and increase the wind energy
production target to 60 GW by 2022 from the current 20 GW.
4. Goal and Objective
To establish an organization with like minded professionals, investors
and promoters to –
Perfect the concept and technology for all possible applications and
obtain required patents and certifications.
To undertake all functions design, development to manufacturing of
all possible products and their marketing.
To take up turnkey power plant projects with PPA with state and
central Government in India and other clients.
To work as licensor of the technology for other power project
developers
Expand to overseas market as a technology provider and power
project developer
Continue research and development in related products for use in
newer fields
5. Salient Features
The concept has many applications and already in use; so this
knowledge is in public domain. But it has never been applied
successfully for power generation.
Conventional production technology is used to produce all the
components.
This is a complete indigenous product. So can be made available
with less cost.
The simple structure and configuration facilitates easy and
affordable maintenance.
The most costly component of the module is the alternator.
Uses less land compared to other Hydro, Wind and Solar power
generation facility. For a 220 MW power plant comprising of 8 units
will require 300 square meters (1/14th of an acre) of space only
for the units.
6. Salient Features
This requires external energy to start and minimum energy to keep
it running.The rest energy input is from the renewable source.
The module uses special green energy technology to harvest the
energy from the renewable source and feeds the alternator.
With continuous production except stoppage for maintenance it is
suitable for building up base load capacity, thus can replace the
other polluting power plants.
Uses renewable energy source for power generation and there is
no lack of this resource anywhere. So there is no location
constraint for establishing power plants that use this technology.
7. Possible applications
As this module can generate torque through mechanical means
it can be used for power generation and also for prime
mover as listed below. The modules can be configured
according the required capacity.
As major power generation system in power plants
reinforcing build up of base load capacity
As single or multiple unit installations for Industries big, and
medium, Industrial estates, Hospitals big and medium,
University campus, Engineering and medical colleges,
Housing societies,Towns and cluster of villages
As prime mover for transport vehicles, earth moving
equipment, cranes, mining equipment like excavators
As prime mover for railway locomotives and ships
8. Some advantages and disadvantages
Less land requirement makes it more viable.
No storage system is necessary as these can be used to build up base load
capacity. Production can happen throughout the year. Not dependent upon,
weather, fuel availability.
The system is scalable for capacity increase within the same space.
The system is bulky, is not suitable for rooftop installation.
This is not economical for sub MW capacity, but with no fuel cost it is
advantageous in the long run.
The maintenance cost is more in comparison to solar installations but
continuous uninterrupted power production and less capital requirement
overcomes this drawback.
Can be used in railway locomotives, ships, and transport vehicles (no small cars
and utility vehicles) thus reducing consumption of fossil fuels.
9. Differentiators
GRW Power Solutions is a new technology for production of power using renewable
sources. This new technology will be a replacement for the current technologies
available in renewable energy field for production of power. In this regard the
companies now involved in establishing solar and wind farms will be our target
customers. Among the renewable sources Solar source for energy production is
most versatile due to technologies involved. The cost of availability of solar power
is becoming cheaper and cheaper day by day. The following are the differentiating
factors between GRW Power Solutions and prevailing power production
technologies in wind power, solar power, tidal power.
Investment per MW
Hydro Power – ₹5.5 Crores
GRW Power – ₹1.9 CroresWind Power – ₹5.25 Crores
Solar Power – ₹3.5 Crores
Annual O&M per MW
Hydro Power – ₹20 Lakhs
GRW Power– ₹ 11 LakhsWind Power – ₹11.24 Lakhs
Solar Power – ₹7.0 Lakhs
Power available per KHW
Hydro Power – -
GRW Power– ₹2.40Wind Power – ₹3.46
Solar Power – ₹2.44 - ₹2.97
10. Differentiators
Solar Power GRW Power
- For Solar farms depending on the technology the
land requirement varies from 2.5 acres per MW to
6.5 acres per MW.
- Scaling up capacity needs more land and may be
not possible due to non availability of land nearby.
- Power evacuation cost is a burden as solar farms
may not be established very near to the grid in most
of the cases due to land constraint.
- Cost for storage of power to maintain supply at
non producing hours.
- Solar modules are ideal for rooftop installations as
long as not using any land for installation on ground.
- Solar modules are ideal for isolated street lights.
-With increased R&D solar modules and power
storage solutions are becoming cheaper day by day.
- Proven technology
- Skilled and experienced man power availability
- Land requirement excluding substation –
• 600 M^2 or 0.15 acre for1MW to 19MW
•1000 M^2 or 0.25 acre for 23MW to 80 MW
•1400 M^2 or 0.35 acre for 82MW to 171 MW
• 1600M^2 or 0.4 acre for 177MW to 233 MW
• 1800M^2 or 0.45 acre for 235MW to 305MW
- Any Power producing unit in a range can be
upgraded to next range without requiring additional
land.
-Due to less space requirement these units can be
established very near to the electricity grid.
-No storage facility is required as clean power can
be produced continuously at constant rate.
-Not suitable for roof top installation .
-Life of the units 20 to 25 years.
- Getting approvals of various authorities and
acceptance of the technology as a viable alternative
for power production requires time and
considerable amount of funding.
11. Parameters and assumed values for financial
projection of power plant
Optimum Capacity of power plant – 209 to 267 MW for multiple
units
Optimum Capacity of power plant – 3 to 89 MW for single units
Life of plant – 20 to 25 years
Continuous production except stoppage for maintenance
Estimated power generation per year – 70.08 lacs unit / MW
Cost of project per MW – 193 lacs
O&M cost (average) per year per MW – 11.5 lacs
Rate of interest on investment – 13 %
Investment repayment period – 11 years
Average cost of sale of electricity – ₹2.40 per unit
Depreciation – 5%
Tax – 18%
12. Financial Projections for Single unit installations
Capacity
(MW)
Investment
(Crores INR)
Return in 10
years (Crores
INR) before tax
Return in 20
years (Crores
INR) before
tax
3.8 6.65 39.18 87.00
19 36.84 189.37 426.64
23 44.05 230.23 517.73
27.5 51.79 276.87 621.07
33 62 332.51 745.63
39.5 73.84 398.69 893.36
43 79.45 435.70 974.69
51.5 95.15 521.84 1167.38
62 113.37 630.38 1408.14
74.5 135.45 758.88 1693.85
89 161.69 906.80 2023.81
87.00
426.64
517.73
621.07
745.63
893.36
974.69
1167.38
1408.14
1693.85
2023.81
0
500
1000
1500
2000
2500
1 2 3 4 5 6 7 8 9 10 11
Capacity (MW)
Investment
(Crores INR)
Return in 10
years (Crores
INR) before tax
Return in 20
years (Crores
INR) before tax
13. Unit cost and arrangement of units for minimum
200 MW capacity power plant
Unit Capacity
in MW
Total cost of
each unit in
lacs
Unit Cost in
Lacs per MW
No. of units
for minimum
200 MW
capacity
Total capacity
in MW
Total Cost of
units in lacs
Total cost per
MW of
installed
capcity in lacs
Cost in $ per
KW
19 3684 193.89 11 209 40324 192.94 296.83
23 4405 191.52 9 207 39485 190.75 293.46
27.5 5179 188.33 8 220 41292 187.69 288.76
33 6200 187.88 7 231 43280 187.36 288.25
39.5 7384 186.94 6 237 44204 186.51 286.95
43 7945 184.77 5 215 39645 184.40 283.69
51.5 9515 184.76 4 206 38000 184.47 283.79
62 11337 182.85 4 248 45288 182.61 280.94
74.5 13545 181.81 3 223.5 40595 181.63 279.44
89 16169 181.67 3 267 48467 181.52 279.27
14. Financial Projection for Multiple unit installations
(minimum 200 MW capacity)
Total capacity in MW Total Cost of units in Crores
total profit in 10 years in Crores
before tax
Total profit in 20 yrs in Crores
before tax
206 380 1688.41 3627.61
207 394.85 1673.00 3606.59
209 403.24 1680.86 3627.85
215 396.45 1762.45 3786.55
220 412.92 1790.27 3853.08
223.5 405.95 1843.33 3954.59
231 432.8 1881.18 4048.00
237 442.04 1933.67 4159.09
248 452.88 2040.98 4380.87
267 484.67 2202.63 4725.13
3627.61 3606.59 3627.85
3786.55 3853.08
3954.59 4048.00
4159.09
4380.87
4725.13
0
500
1000
1500
2000
2500
3000
3500
4000
4500
5000
1 2 3 4 5 6 7 8 9 10
Total capacity in
MW
Total Cost of
units in Crores
total profit in 10
years in Crores
before tax
Total profit in 20
yrs in Crores
before tax
15. Financial model for 209 MW Power Plant investors in Eleven year’s are as below (Crores
INR)
Years 1st yr 2nd yr 3rd yr 4th yr 5th yr 6th yr 7th yr 8th yr 9th yr
10th
yr
11th
yr Total
Revenue 117.2 351.5 351.5 351.5 351.5 351.5 351.5 351.5 351.5 351.5 351.5 3632.4
Operational Expenses 38.1 114.3 114.3 114.3 114.3 114.3 114.3 114.3 114.3 114.3 114.3 1180.9
Bank Interest Payment 48.4 43.5 38.7 33.9 29.0 24.2 19.4 14.5 9.7 4.8 0.0 266.1
Depreciation 20.2 20.2 20.2 20.2 20.2 20.2 20.2 20.2 20.2 20.2 20.2 221.8
Total Expense (without
AD) 106.6 178.0 173.2 168.3 163.5 158.6 153.8 149.0 144.1 139.3 134.4 1668.8
Profit Before Tax
(without AD) 10.5 173.5 178.4 183.2 188.0 192.9 197.7 202.6 207.4 212.2 217.1 1963.6
Taxation (without AD) 1.9 31.2 32.1 33.0 33.8 34.7 35.6 36.5 37.3 38.2 39.1 353.4
Profit After Tax (Without
AD) 8.6 142.3 146.3 150.2 154.2 158.2 162.1 166.1 170.1 174.0 178.0 1610.1
Depreciation 20.2 20.2 20.2 20.2 20.2 20.2 20.2 20.2 20.2 20.2 20.2 221.8
Total
Less ( -)
Bank Debt Service
amount 0.0 40.3 40.3 40.3 40.3 40.3 40.3 40.3 40.3 40.3 40.3 403.2
16. Balance sheet of 209 MW Power Plant Investors in INR
INCOME AMOUNT EXPENDITURE AMOUNT
Total Revenue for
11 years 3632,38,30,000
Operational
Expenses 1180,89,23,000
Bank Interest
Payment 266,13,84,000
Depreciation 221,78,20,000
Total Expense
(without AD) 1668,81,27,000
Profit Before Tax
(without AD) 1963,57,03,000
Taxation (without
AD) 353,44,21,000
(Min Alternative Tax
18%)
Profit After Tax
(Without AD) 1610,12,82,000
Total Income 3632,38,30,000 3632,38,30,000
Depreciation 221,78,20,000
Profit After Tax
(Without AD) 1610,12,82,000
Total amount in
account 1831,91,02,000
Bank Debt
Amount 403,24,00,000
Balance cash in
hand 1428,67,02,000