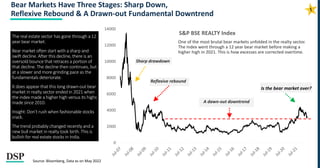
SlideShare a Scribd company logo
1 of 17
Download to read offline
Early Warning & Signals Through Charts
NETRA June 2022
Run Your Life On Principles
In this 1st anniversary edition of NETRA we present to you
Bob Farrell’s 10 Timeless Investing Rules through live data charts
Bob Farrell’s 10 Timeless Investing Rules
1. Markets tend to return to the mean, over
time
2. Excesses in one direction will lead to an
opposite excess in the other direction
3. There are no new eras - excesses are
never permanent
4. Exponential rapidly rising or falling
markets usually go further than you think,
but they do not correct by going sideways
5. The public buys the most at the top and
the least at the bottom
6. Fear and greed are stronger than long-term
resolve
7. Markets are strongest when they are broad
and weakest when they narrow to a handful
of blue-chip names
8. Bear markets have three stages - sharp
down, reflexive rebound and a drawn-out
fundamental downtrend
9. When all the experts and forecasts agree -
something else is going to happen
10.Bull markets are more fun than bear markets
Markets Tend To Return To The Mean Over Time
Source: Bloomberg, Data As of 27th May 2022
22.1
9.3
21.2
15.1
27.8
18.6
May-05 May-22
11.4
27.2
18.1 18.1
May-05 May-22
27.8
14.4
12.9
17.9
34.8
22.7
May-05 May-22
17.2
8.6
12.2
20.7
12.0
May-05 May-22
5 Yr Avg
10 Yr Avg
Nifty Index PE Ratio
Near 10 Year Average
S&P 500 Index PE Ratio
Below 10 Year Average
Nasdaq-100 Index PE Ratio
Below 5 Year Average
SOX Semiconductors Index PE Ratio
Below 10 Year & Long Term Average
Excesses In One Direction Will Lead To An Opposite Excess In The Other Direction
The NYMEX WTI Crude Oil 321 crack spread
measures the difference between the purchase
price of crude oil and the selling price of
finished products, such as gasoline and
distillate fuel (diesel), that a refinery produces
from crude oil.
Crack spreads are an indicator of the short-
term profit margin of oil refineries because
they compare the cost of the crude oil inputs
to the wholesale prices of the outputs.
The 3:2:1 crack spread approximates the
product yield at a typical U.S. refinery: For
every three barrels of crude oil the refinery
processes, it makes two barrels of gasoline and
one barrel of distillate fuel hence the ratio 3:2:1
Formula:
(2 X Gasoline + 1 X Distillate Fuel) – 3 X Crude
Oil= Crack Spread (also a proxy for GRMs)
Source: Bloomberg, Data As of May 27th, 2022
10
3
30
3
42
33
8
55
11
19
May-87 May-92 May-97 May-02 May-07 May-12 May-17 May-22
Nymex WTI Crude Oil 3:2:1 Crack Spread Gone Berserk
This spread rises when there is shortage in the petroleum
products markets. Like the one currently US and many other
countries are witnessing. Products like diesel and petrol are
hard to procure. This is leading to record profit margins for
refiners. An excess that seems to have no end. This is also
making participants talk about $150 to $200 Oil.
But we have begun to witness the reversal. Govt’s world
over have begun to put windfall tax on resource producers
who are making extreme profits.
Time for this to reverse and go to the other extreme?
Oil back to pre-conflict lows?
Long term average
Post GFC
Average
Extreme?
Isn’t it?
0
50
100
150
200
250
300
350
400
450
500
0
500
1000
1500
2000
2500
3000
3500
4000
4500
5000
Dec-06
May-07
Oct-07
Mar-08
Aug-08
Jan-09
Jun-09
Nov-09
Apr-10
Sep-10
Feb-11
Jul-11
Dec-11
May-12
Oct-12
Mar-13
Aug-13
Jan-14
Jun-14
Nov-14
Apr-15
Sep-15
Feb-16
Jul-16
Dec-16
May-17
Oct-17
Mar-18
Aug-18
Jan-19
Jun-19
Nov-19
Apr-20
Sep-20
Feb-21
Jul-21
Dec-21
May-22
Nasdaq 100 Index (From Feb-2000 to July-2015) RHS S&P Banks Index (From July-2007 to May-2022) LHS
Prior to the ‘Tech bubble’ it was believed
that technology will append everything we
know and the ‘tech sector stocks’ will
remain in a long, multi decade bull market.
Prior to the financial crisis it was believed
that by using the modern methods of
slicing and dicing of risk the financial
industry has unlocked the holy grail of
profitability and risk diversification.
Alas there are no new eras. In the last 5
years we have seen the pendulum swings
for many such themes.
Current ‘New Era’ theories are: Commodity
Supercycle, Permanently High P/E ratios…
you can add your theory to this list.
Source: CMIE, Data As On May 2022
There Are No New Eras: Excesses Are Never Permanent
Eerie similarity between two ‘New Era’ narratives of the past. Nasdaq from
2000 ‘Tech bubble’ peak & Banks Index from ‘Financials juggernaut’ peak
Bonus insight: Nasdaq went onto nearly triple after
it cracked past its previous high. Can banks do that
after 15 years of sub par returns? Think about it…
Nasdaq crash after a 400%
tech bubble rally in 2000
Banks crash during GFC 2008
after doubling in prior 3
years
Exponential Rapidly Rising Or Falling Markets Usually Go
Further Than You Think, But They Do Not Correct By Going Sideways
The biggest disruption in 2022 has been in the
energy markets in Europe. Especially the
natural gas markets has gone through a very
large supply side crunch.
The Dutch TTF Natural Gas prices went from
under 16 to 212 Eur/MWh over the last few
months. Recently the prices have begun to fall
swiftly.
There is a consensus that due to the Russia-
Ukraine issue, demand revival and long term
underinvestment the natural Gas prices in
Eurozone are likely to remain high for years.
However history tells us that prices don’t move
sideways after rising exponentially. So expect a
crack in Natural Gas prices this year. This will
be positive for energy using sectors like
industrials, transportation and automotive.
Source: Bloomberg, May 2022
11
27
16
181
212
85
May-15 May-16 May-17 May-18 May-19 May-20 May-21 May-22
Netherlands TTF Natural Gas Forward Month 1 (EUR/MWh)
13X rise in
two quarters
This is unlikely to go sideways in a
correction. Expect a steep fall this year.
15
20
25
30
35
40
45
50
55
American Association of Individual Investors - Bearish Readings
600
1100
1600
2100
2600
3100
3600
4100
4600
S&P 500 Index
The Public Buys The Most At The Top, And The Least At The Bottom
Every week, AAII asks investors a question:
Do you feel the direction of the stock
market over the next six months will be up
(bullish), no change (neutral) or down
(bearish)?
Combined with other indicators like
valuations, earnings trends, momentum
and intermarket relationships this indicator
is a very useful contrarian indicator.
It reflects, as it is doing now, that investors
are too bearish about market’s outlook over
the next 6 months. There is a wall street
saying: ‘Public is mostly right but wrong
only at the turn’.
?
GFC
???
Investors are generally most bearish at the bottom.
Source: Bloomberg, Data as on May 2022
Price Bottoms
at
Peak Bearish Sentiment
0.1
0.2
0.3
0.4
0.5
0.6
0.7
600
1100
1600
2100
2600
Nov-15 Nov-16 Nov-17 Nov-18 Nov-19 Nov-20 Nov-21
Airlines Sector Leader Stock Price (LHS) Airlines Sector Leader / MCX Crude Oil Price
Fear And Greed Are Stronger Than Long-term Resolve
Energy input is a large part of airlines cost and
impact profitability. Energy prices are volatile.
The ratio of a Indian market leader in the
airlines sector and crude oil futures price at
MCX gives an idea of how greed and fear
functions in this cyclical industry. Every time
oil prices have rallied the airlines sector stock
prices have crashed. Interestingly the majority
of selling and downgrades come close to the
turning points.
Do we know the turning points or is it just
hindsight? Over the last seven years the chart
on the right has bottomed closer to 0.2. This
is the point of maximum fear and represents a
good risk reward.
Be attentive to focus on airlines stocks. Go
bottoms up & find the best priced businesses.
Greed
Fear
Energy input is a large
part of airlines cost and
impacts profitability.
Buy Airline
stocks?
Source: Bloomberg, Data as on May 2022
0
2000
4000
6000
8000
10000
12000
14000
16000
18000
0
50
100
150
200
250
300
350
400
450
May-00
May-01
May-02
May-03
May-04
May-05
May-06
May-07
May-08
May-09
May-10
May-11
May-12
May-13
May-14
May-15
May-16
May-17
May-18
May-19
May-20
May-21
May-22
Number of Members With New 52 Week Lows Number of Members with New 52 Week Highs
NSE500 Index (RHS)
Markets Are Strongest When They Are Broad And Weakest When They Narrow
Always look for more stocks hitting new 52
week high steadily as a sign of ongoing
uptrend. If stock indices are hitting new highs
with very few stocks rising, it’s generally a
sign of weakness.
Why? When more stocks participate in the
uptrend it reflects stronger underlying risk
appetite and possibly better fundamentals if
supported by broad earrings growth.
The post pandemic rally has characterized by
more stocks rising together. Look for this sign
again in H2 of 2022. this will add to
conviction that markets have bottomed out
in May 2022.
Source: NSE, Bloomberg, Data as on May 2022
Always look for more stocks hitting new 52 week
highs steadily as a sign of ongoing uptrend. If
stock indices are hitting new highs with very few
stocks rising, it’s generally a sign of weakness.
More greens means broad
bullish market
Taller reds means more stocks are
falling hard, a weak market
0
2000
4000
6000
8000
10000
12000
14000
S&P BSE REALTY Index
Bear Markets Have Three Stages: Sharp Down,
Reflexive Rebound & A Drawn-out Fundamental Downtrend
The real estate sector has gone through a 12
year bear market.
Bear market often start with a sharp and
swift decline. After this decline, there is an
oversold bounce that retraces a portion of
that decline. The decline then continues, but
at a slower and more grinding pace as the
fundamentals deteriorate.
It does appear that this long drawn-out bear
market in realty sector ended in 2021 when
the index made a higher high versus its highs
made since 2010.
Insight: Don’t rush when fashionable stocks
crack.
The trend probably changed recently and a
new bull market in realty took birth. This is
bullish for real estate stocks in India.
Sharp drawdown
Reflexive rebound
A dawn-out downtrend
Is the bear market over?
One of the most brutal bear markets unfolded in the realty sector.
The Index went through a 12 year bear market before making a
higher high in 2021. This is how excesses are corrected overtime.
Source: Bloomberg, Data as on May 2022
70
161
67
50
70
90
110
130
150
170
Mar 18 Mar 19 Mar 20 Mar 21 Mar 22
(4qma,
rebased
to
100)
Small cars SUVs 2Ws
When All The Experts And Forecasts Agree, Something Else Is Going To Happen
India’s auto sector has been hurt quite a lot.
Semiconductor unavailability, poor rural
revival, repeated lockdowns over the last
two years and large outflows from the
sector has caused Nifty Auto Index to not
perform over the last 5 years.
The two large segments of India’s auto
sector – small cars and two wheelers – have
been under stress. Recently the
commentary has turned even more bearish
and uncertain for these two segments.
Most investors and analyst have no clear
signs of how auto sector will perform over
the next few years.
There is a good chance that something else
is doing to happen – Auto outperformance.
Source: Edelweiss Research, Data as on May 2022
Hurt by weak
MSME/rural incomes
Beneficiary of liquidity easing
Indian auto sector has seen a sharp deceleration in small
car sales and two wheeler sales. These are the mainstay
of Indian automotive sector. Is this time to bet on the
revival of Auto sector for next few years? May be yes!
-4.5
-1.5
1.5
4.5
7.5
10.5
13.5
-15.0
-10.0
-5.0
0.0
5.0
10.0
15.0
20.0
25.0
30.0
35.0
40.0
45.0
50.0
Apr-70
Apr-72
Apr-74
Apr-76
Apr-78
Apr-80
Apr-82
Apr-84
Apr-86
Apr-88
Apr-90
Apr-92
Apr-94
Apr-96
Apr-98
Apr-00
Apr-02
Apr-04
Apr-06
Apr-08
Apr-10
Apr-12
Apr-14
Apr-16
Apr-18
Apr-20
Apr-22
CPI: Used Cars and Trucks, % Chg yoy (RHS) CPI, % Chg yoy (LHS)
When All The Experts And Forecasts Agree, Something Else Is Going To Happen
Inflation is the hottest topic across the
world at this time. US consumer price
inflation (CPI) is at 8.3%, the highest level
in last 40 years.
There is a very broad consensus among
forecasters and policy makers that inflation
is headed higher.
But we have seen this in the past that
reality surprises. What seems most
apparent seldom happens.
Can inflation soften against the
consensus ?
Source: St Louis Fed, FRED Data as on May 2022
The biggest driver of inflation
in US, used cars and trucks
prices have already begun to
see deceleration
The biggest consensus in the world today is- inflation is headed higher and
will remain sticky. All forecasters agree on this today- some more, some less.
88.8%
78.0%
201.6%
148.8%
81.5%
-200%
-150%
-100%
-50%
0%
50%
100%
150%
200%
250%
0
500
1000
1500
2000
2500
3000
3500
4000
4500
5000
Dec-95
Mar-97
Jun-98
Sep-99
Dec-00
Mar-02
Jun-03
Sep-04
Dec-05
Mar-07
Jun-08
Sep-09
Dec-10
Mar-12
Jun-13
Sep-14
Dec-15
Mar-17
Jun-18
Sep-19
Dec-20
Mar-22
Bull Markets Are More Fun Than Bear Markets
The financial industry and investor
community are geared towards bullish
markets.
In bull markets most participants make
exceptionally strong profits, especially those
involved in the buying/selling of securities,
the broker dealers.
This repeats in every cycle. That’s why most
commentary is always bullish. It’s more fun
for everyone.
But what’s really important is that the
best portfolio returns are made by
navigating tough bear markets and
through systematic investments.
Source: Bloomberg; Data as May 2022
S&P 500 Index (LHS)
NYSE Broker Dealer Index
(TTM EPS yoy Change%) RHS
+/- Huge profitability
increase in bull
market
Deep cut in
profits and
survival issues in
bear market
Brokers dealers make more money in bull
markets & lose a lot more in bear markets!
Process
Set Rules,
Follow,
Achieve.
Set higher goals.
Disclaimer
In this material DSP Investment Managers Pvt. Ltd. (the AMC) has used information that is publicly available, including information
developed in-house. Information gathered and used in this material is believed to be from reliable sources. The AMC however does not
warrant the accuracy, reasonableness and / or completeness of any information. The above data/statistic are given only for illustration
purpose. The recipient(s) before acting on any information herein should make his/their own investigation and seek appropriate
professional advice. This is a generic update; it shall not constitute any offer to sell or solicitation of an offer to buy units of any of the
Schemes of the DSP Mutual Fund. The data/statistics are given to explain general market trends in the securities market, it should not be
construed as any research report/research recommendation. We have included statements / opinions / recommendations in this
document, which contain words, or phrases such as “will”, “expect”, “should”, “believe” and similar expressions or variations of such
expressions that are “forward looking statements”. Actual results may differ materially from those suggested by the forward looking
statements due to risk or uncertainties associated with our expectations with respect to, but not to, exposure to market risks, general
economic and political conditions in India and other countries globally, which have an impact on our services and / or investments, the
monetary and interest policies of India, inflation, deflation, unanticipated turbulence in interest rates, foreign exchange rates, equity
prices or other rates or prices etc.
Mutual Fund investments are subject to market risks, read all scheme related documents carefully.
#INVESTFORGOOD

More Related Content

Similar to trades book.pdf

Shamik Bhose October Crude Oil Views
Shamik Bhose  October Crude Oil ViewsShamik Bhose  October Crude Oil Views
Shamik Bhose October Crude Oil ViewsShamik Bhose
 
Paul Flood-Market-commentaryMay 18-2013
Paul Flood-Market-commentaryMay 18-2013Paul Flood-Market-commentaryMay 18-2013
Paul Flood-Market-commentaryMay 18-2013PAUL FLOOD
 
Newsletter 10052015 Final Volume 1 Issue 15
Newsletter 10052015 Final Volume 1 Issue 15Newsletter 10052015 Final Volume 1 Issue 15
Newsletter 10052015 Final Volume 1 Issue 15Jonathan M. Lamb
 
Mercer Capital's Value Focus: Energy Industry | Q1 2021 | Region Focus: Eagle...
Mercer Capital's Value Focus: Energy Industry | Q1 2021 | Region Focus: Eagle...Mercer Capital's Value Focus: Energy Industry | Q1 2021 | Region Focus: Eagle...
Mercer Capital's Value Focus: Energy Industry | Q1 2021 | Region Focus: Eagle...Mercer Capital
 
Equity Pitch Book - Jan
Equity Pitch  Book - JanEquity Pitch  Book - Jan
Equity Pitch Book - JanPOOJA BHEDA
 
Who makes money in high inflation periods
Who makes money in high inflation periodsWho makes money in high inflation periods
Who makes money in high inflation periodsAlpesh Patel
 
BMO-TCH-Mid-Q3-Update_FINAL
BMO-TCH-Mid-Q3-Update_FINALBMO-TCH-Mid-Q3-Update_FINAL
BMO-TCH-Mid-Q3-Update_FINALAdam Phillips
 
Monthly Market Outlook - September 2019
Monthly Market Outlook - September 2019Monthly Market Outlook - September 2019
Monthly Market Outlook - September 2019iciciprumf
 
Equilor Industry note_Oil and gas
Equilor Industry note_Oil and gasEquilor Industry note_Oil and gas
Equilor Industry note_Oil and gasDavid Farkas
 
Market Outlook Report - The Market & Business Cycles - Sept 2011 Issue
Market Outlook Report - The Market & Business Cycles - Sept 2011 IssueMarket Outlook Report - The Market & Business Cycles - Sept 2011 Issue
Market Outlook Report - The Market & Business Cycles - Sept 2011 IssueHBJ Capital Services Pvt. Ltd
 
Newsletter 102615 Final Volume 1 Issue 18
Newsletter 102615 Final Volume 1 Issue 18Newsletter 102615 Final Volume 1 Issue 18
Newsletter 102615 Final Volume 1 Issue 18Jonathan M. Lamb
 
Market outlook equity march 2021
Market outlook equity march 2021Market outlook equity march 2021
Market outlook equity march 2021Rahulpathak154
 
Outlook For Commodities
Outlook For CommoditiesOutlook For Commodities
Outlook For CommoditiesRusNewton
 

Similar to trades book.pdf (20)

CIO Newsletter - Jan 2016
CIO Newsletter - Jan 2016CIO Newsletter - Jan 2016
CIO Newsletter - Jan 2016
 
DSP World Gold Fund
DSP World Gold FundDSP World Gold Fund
DSP World Gold Fund
 
Shamik Bhose October Crude Oil Views
Shamik Bhose  October Crude Oil ViewsShamik Bhose  October Crude Oil Views
Shamik Bhose October Crude Oil Views
 
Paul Flood-Market-commentaryMay 18-2013
Paul Flood-Market-commentaryMay 18-2013Paul Flood-Market-commentaryMay 18-2013
Paul Flood-Market-commentaryMay 18-2013
 
Newsletter 10052015 Final Volume 1 Issue 15
Newsletter 10052015 Final Volume 1 Issue 15Newsletter 10052015 Final Volume 1 Issue 15
Newsletter 10052015 Final Volume 1 Issue 15
 
Mercer Capital's Value Focus: Energy Industry | Q1 2021 | Region Focus: Eagle...
Mercer Capital's Value Focus: Energy Industry | Q1 2021 | Region Focus: Eagle...Mercer Capital's Value Focus: Energy Industry | Q1 2021 | Region Focus: Eagle...
Mercer Capital's Value Focus: Energy Industry | Q1 2021 | Region Focus: Eagle...
 
Oei feb-16
Oei feb-16Oei feb-16
Oei feb-16
 
Equity Pitch Book - Jan
Equity Pitch  Book - JanEquity Pitch  Book - Jan
Equity Pitch Book - Jan
 
Who makes money in high inflation periods
Who makes money in high inflation periodsWho makes money in high inflation periods
Who makes money in high inflation periods
 
OECD Report on Global Financial Markets - October2022
OECD Report on Global Financial Markets - October2022OECD Report on Global Financial Markets - October2022
OECD Report on Global Financial Markets - October2022
 
Oei 2014-12
Oei 2014-12Oei 2014-12
Oei 2014-12
 
Energy trading scenario 2016
Energy trading scenario 2016Energy trading scenario 2016
Energy trading scenario 2016
 
BMO-TCH-Mid-Q3-Update_FINAL
BMO-TCH-Mid-Q3-Update_FINALBMO-TCH-Mid-Q3-Update_FINAL
BMO-TCH-Mid-Q3-Update_FINAL
 
Monthly Market Outlook - September 2019
Monthly Market Outlook - September 2019Monthly Market Outlook - September 2019
Monthly Market Outlook - September 2019
 
Equilor Industry note_Oil and gas
Equilor Industry note_Oil and gasEquilor Industry note_Oil and gas
Equilor Industry note_Oil and gas
 
Weekly Economic Update August 6 2012
Weekly Economic Update August 6 2012Weekly Economic Update August 6 2012
Weekly Economic Update August 6 2012
 
Market Outlook Report - The Market & Business Cycles - Sept 2011 Issue
Market Outlook Report - The Market & Business Cycles - Sept 2011 IssueMarket Outlook Report - The Market & Business Cycles - Sept 2011 Issue
Market Outlook Report - The Market & Business Cycles - Sept 2011 Issue
 
Newsletter 102615 Final Volume 1 Issue 18
Newsletter 102615 Final Volume 1 Issue 18Newsletter 102615 Final Volume 1 Issue 18
Newsletter 102615 Final Volume 1 Issue 18
 
Market outlook equity march 2021
Market outlook equity march 2021Market outlook equity march 2021
Market outlook equity march 2021
 
Outlook For Commodities
Outlook For CommoditiesOutlook For Commodities
Outlook For Commodities
 

Recently uploaded

Procuring digital preservation CAN be quick and painless with our new dynamic...
Procuring digital preservation CAN be quick and painless with our new dynamic...Procuring digital preservation CAN be quick and painless with our new dynamic...
Procuring digital preservation CAN be quick and painless with our new dynamic...Jisc
 
Alper Gobel In Media Res Media Component
Alper Gobel In Media Res Media ComponentAlper Gobel In Media Res Media Component
Alper Gobel In Media Res Media ComponentInMediaRes1
 
Influencing policy (training slides from Fast Track Impact)
Influencing policy (training slides from Fast Track Impact)Influencing policy (training slides from Fast Track Impact)
Influencing policy (training slides from Fast Track Impact)Mark Reed
 
Planning a health career 4th Quarter.pptx
Planning a health career 4th Quarter.pptxPlanning a health career 4th Quarter.pptx
Planning a health career 4th Quarter.pptxLigayaBacuel1
 
Proudly South Africa powerpoint Thorisha.pptx
Proudly South Africa powerpoint Thorisha.pptxProudly South Africa powerpoint Thorisha.pptx
Proudly South Africa powerpoint Thorisha.pptxthorishapillay1
 
Full Stack Web Development Course for Beginners
Full Stack Web Development Course  for BeginnersFull Stack Web Development Course  for Beginners
Full Stack Web Development Course for BeginnersSabitha Banu
 
Atmosphere science 7 quarter 4 .........
Atmosphere science 7 quarter 4 .........Atmosphere science 7 quarter 4 .........
Atmosphere science 7 quarter 4 .........LeaCamillePacle
 
AMERICAN LANGUAGE HUB_Level2_Student'sBook_Answerkey.pdf
AMERICAN LANGUAGE HUB_Level2_Student'sBook_Answerkey.pdfAMERICAN LANGUAGE HUB_Level2_Student'sBook_Answerkey.pdf
AMERICAN LANGUAGE HUB_Level2_Student'sBook_Answerkey.pdfphamnguyenenglishnb
 
What is Model Inheritance in Odoo 17 ERP
What is Model Inheritance in Odoo 17 ERPWhat is Model Inheritance in Odoo 17 ERP
What is Model Inheritance in Odoo 17 ERPCeline George
 
ECONOMIC CONTEXT - LONG FORM TV DRAMA - PPT
ECONOMIC CONTEXT - LONG FORM TV DRAMA - PPTECONOMIC CONTEXT - LONG FORM TV DRAMA - PPT
ECONOMIC CONTEXT - LONG FORM TV DRAMA - PPTiammrhaywood
 
ENGLISH 7_Q4_LESSON 2_ Employing a Variety of Strategies for Effective Interp...
ENGLISH 7_Q4_LESSON 2_ Employing a Variety of Strategies for Effective Interp...ENGLISH 7_Q4_LESSON 2_ Employing a Variety of Strategies for Effective Interp...
ENGLISH 7_Q4_LESSON 2_ Employing a Variety of Strategies for Effective Interp...JhezDiaz1
 
Types of Journalistic Writing Grade 8.pptx
Types of Journalistic Writing Grade 8.pptxTypes of Journalistic Writing Grade 8.pptx
Types of Journalistic Writing Grade 8.pptxEyham Joco
 
EPANDING THE CONTENT OF AN OUTLINE using notes.pptx
EPANDING THE CONTENT OF AN OUTLINE using notes.pptxEPANDING THE CONTENT OF AN OUTLINE using notes.pptx
EPANDING THE CONTENT OF AN OUTLINE using notes.pptxRaymartEstabillo3
 
Hierarchy of management that covers different levels of management
Hierarchy of management that covers different levels of managementHierarchy of management that covers different levels of management
Hierarchy of management that covers different levels of managementmkooblal
 
ROOT CAUSE ANALYSIS PowerPoint Presentation
ROOT CAUSE ANALYSIS PowerPoint PresentationROOT CAUSE ANALYSIS PowerPoint Presentation
ROOT CAUSE ANALYSIS PowerPoint PresentationAadityaSharma884161
 
Introduction to AI in Higher Education_draft.pptx
Introduction to AI in Higher Education_draft.pptxIntroduction to AI in Higher Education_draft.pptx
Introduction to AI in Higher Education_draft.pptxpboyjonauth
 
Quarter 4 Peace-education.pptx Catch Up Friday
Quarter 4 Peace-education.pptx Catch Up FridayQuarter 4 Peace-education.pptx Catch Up Friday
Quarter 4 Peace-education.pptx Catch Up FridayMakMakNepo
 
Introduction to ArtificiaI Intelligence in Higher Education
Introduction to ArtificiaI Intelligence in Higher EducationIntroduction to ArtificiaI Intelligence in Higher Education
Introduction to ArtificiaI Intelligence in Higher Educationpboyjonauth
 

Recently uploaded (20)

Procuring digital preservation CAN be quick and painless with our new dynamic...
Procuring digital preservation CAN be quick and painless with our new dynamic...Procuring digital preservation CAN be quick and painless with our new dynamic...
Procuring digital preservation CAN be quick and painless with our new dynamic...
 
Alper Gobel In Media Res Media Component
Alper Gobel In Media Res Media ComponentAlper Gobel In Media Res Media Component
Alper Gobel In Media Res Media Component
 
Influencing policy (training slides from Fast Track Impact)
Influencing policy (training slides from Fast Track Impact)Influencing policy (training slides from Fast Track Impact)
Influencing policy (training slides from Fast Track Impact)
 
Planning a health career 4th Quarter.pptx
Planning a health career 4th Quarter.pptxPlanning a health career 4th Quarter.pptx
Planning a health career 4th Quarter.pptx
 
Proudly South Africa powerpoint Thorisha.pptx
Proudly South Africa powerpoint Thorisha.pptxProudly South Africa powerpoint Thorisha.pptx
Proudly South Africa powerpoint Thorisha.pptx
 
Full Stack Web Development Course for Beginners
Full Stack Web Development Course  for BeginnersFull Stack Web Development Course  for Beginners
Full Stack Web Development Course for Beginners
 
Atmosphere science 7 quarter 4 .........
Atmosphere science 7 quarter 4 .........Atmosphere science 7 quarter 4 .........
Atmosphere science 7 quarter 4 .........
 
AMERICAN LANGUAGE HUB_Level2_Student'sBook_Answerkey.pdf
AMERICAN LANGUAGE HUB_Level2_Student'sBook_Answerkey.pdfAMERICAN LANGUAGE HUB_Level2_Student'sBook_Answerkey.pdf
AMERICAN LANGUAGE HUB_Level2_Student'sBook_Answerkey.pdf
 
9953330565 Low Rate Call Girls In Rohini Delhi NCR
9953330565 Low Rate Call Girls In Rohini  Delhi NCR9953330565 Low Rate Call Girls In Rohini  Delhi NCR
9953330565 Low Rate Call Girls In Rohini Delhi NCR
 
What is Model Inheritance in Odoo 17 ERP
What is Model Inheritance in Odoo 17 ERPWhat is Model Inheritance in Odoo 17 ERP
What is Model Inheritance in Odoo 17 ERP
 
ECONOMIC CONTEXT - LONG FORM TV DRAMA - PPT
ECONOMIC CONTEXT - LONG FORM TV DRAMA - PPTECONOMIC CONTEXT - LONG FORM TV DRAMA - PPT
ECONOMIC CONTEXT - LONG FORM TV DRAMA - PPT
 
ENGLISH 7_Q4_LESSON 2_ Employing a Variety of Strategies for Effective Interp...
ENGLISH 7_Q4_LESSON 2_ Employing a Variety of Strategies for Effective Interp...ENGLISH 7_Q4_LESSON 2_ Employing a Variety of Strategies for Effective Interp...
ENGLISH 7_Q4_LESSON 2_ Employing a Variety of Strategies for Effective Interp...
 
Types of Journalistic Writing Grade 8.pptx
Types of Journalistic Writing Grade 8.pptxTypes of Journalistic Writing Grade 8.pptx
Types of Journalistic Writing Grade 8.pptx
 
EPANDING THE CONTENT OF AN OUTLINE using notes.pptx
EPANDING THE CONTENT OF AN OUTLINE using notes.pptxEPANDING THE CONTENT OF AN OUTLINE using notes.pptx
EPANDING THE CONTENT OF AN OUTLINE using notes.pptx
 
Hierarchy of management that covers different levels of management
Hierarchy of management that covers different levels of managementHierarchy of management that covers different levels of management
Hierarchy of management that covers different levels of management
 
ROOT CAUSE ANALYSIS PowerPoint Presentation
ROOT CAUSE ANALYSIS PowerPoint PresentationROOT CAUSE ANALYSIS PowerPoint Presentation
ROOT CAUSE ANALYSIS PowerPoint Presentation
 
Introduction to AI in Higher Education_draft.pptx
Introduction to AI in Higher Education_draft.pptxIntroduction to AI in Higher Education_draft.pptx
Introduction to AI in Higher Education_draft.pptx
 
Model Call Girl in Bikash Puri Delhi reach out to us at 🔝9953056974🔝
Model Call Girl in Bikash Puri  Delhi reach out to us at 🔝9953056974🔝Model Call Girl in Bikash Puri  Delhi reach out to us at 🔝9953056974🔝
Model Call Girl in Bikash Puri Delhi reach out to us at 🔝9953056974🔝
 
Quarter 4 Peace-education.pptx Catch Up Friday
Quarter 4 Peace-education.pptx Catch Up FridayQuarter 4 Peace-education.pptx Catch Up Friday
Quarter 4 Peace-education.pptx Catch Up Friday
 
Introduction to ArtificiaI Intelligence in Higher Education
Introduction to ArtificiaI Intelligence in Higher EducationIntroduction to ArtificiaI Intelligence in Higher Education
Introduction to ArtificiaI Intelligence in Higher Education
 

trades book.pdf

  • 1. Early Warning & Signals Through Charts NETRA June 2022
  • 2. Run Your Life On Principles In this 1st anniversary edition of NETRA we present to you Bob Farrell’s 10 Timeless Investing Rules through live data charts
  • 3. Bob Farrell’s 10 Timeless Investing Rules 1. Markets tend to return to the mean, over time 2. Excesses in one direction will lead to an opposite excess in the other direction 3. There are no new eras - excesses are never permanent 4. Exponential rapidly rising or falling markets usually go further than you think, but they do not correct by going sideways 5. The public buys the most at the top and the least at the bottom 6. Fear and greed are stronger than long-term resolve 7. Markets are strongest when they are broad and weakest when they narrow to a handful of blue-chip names 8. Bear markets have three stages - sharp down, reflexive rebound and a drawn-out fundamental downtrend 9. When all the experts and forecasts agree - something else is going to happen 10.Bull markets are more fun than bear markets
  • 4. Markets Tend To Return To The Mean Over Time Source: Bloomberg, Data As of 27th May 2022 22.1 9.3 21.2 15.1 27.8 18.6 May-05 May-22 11.4 27.2 18.1 18.1 May-05 May-22 27.8 14.4 12.9 17.9 34.8 22.7 May-05 May-22 17.2 8.6 12.2 20.7 12.0 May-05 May-22 5 Yr Avg 10 Yr Avg Nifty Index PE Ratio Near 10 Year Average S&P 500 Index PE Ratio Below 10 Year Average Nasdaq-100 Index PE Ratio Below 5 Year Average SOX Semiconductors Index PE Ratio Below 10 Year & Long Term Average
  • 5. Excesses In One Direction Will Lead To An Opposite Excess In The Other Direction The NYMEX WTI Crude Oil 321 crack spread measures the difference between the purchase price of crude oil and the selling price of finished products, such as gasoline and distillate fuel (diesel), that a refinery produces from crude oil. Crack spreads are an indicator of the short- term profit margin of oil refineries because they compare the cost of the crude oil inputs to the wholesale prices of the outputs. The 3:2:1 crack spread approximates the product yield at a typical U.S. refinery: For every three barrels of crude oil the refinery processes, it makes two barrels of gasoline and one barrel of distillate fuel hence the ratio 3:2:1 Formula: (2 X Gasoline + 1 X Distillate Fuel) – 3 X Crude Oil= Crack Spread (also a proxy for GRMs) Source: Bloomberg, Data As of May 27th, 2022 10 3 30 3 42 33 8 55 11 19 May-87 May-92 May-97 May-02 May-07 May-12 May-17 May-22 Nymex WTI Crude Oil 3:2:1 Crack Spread Gone Berserk This spread rises when there is shortage in the petroleum products markets. Like the one currently US and many other countries are witnessing. Products like diesel and petrol are hard to procure. This is leading to record profit margins for refiners. An excess that seems to have no end. This is also making participants talk about $150 to $200 Oil. But we have begun to witness the reversal. Govt’s world over have begun to put windfall tax on resource producers who are making extreme profits. Time for this to reverse and go to the other extreme? Oil back to pre-conflict lows? Long term average Post GFC Average Extreme? Isn’t it?
  • 6. 0 50 100 150 200 250 300 350 400 450 500 0 500 1000 1500 2000 2500 3000 3500 4000 4500 5000 Dec-06 May-07 Oct-07 Mar-08 Aug-08 Jan-09 Jun-09 Nov-09 Apr-10 Sep-10 Feb-11 Jul-11 Dec-11 May-12 Oct-12 Mar-13 Aug-13 Jan-14 Jun-14 Nov-14 Apr-15 Sep-15 Feb-16 Jul-16 Dec-16 May-17 Oct-17 Mar-18 Aug-18 Jan-19 Jun-19 Nov-19 Apr-20 Sep-20 Feb-21 Jul-21 Dec-21 May-22 Nasdaq 100 Index (From Feb-2000 to July-2015) RHS S&P Banks Index (From July-2007 to May-2022) LHS Prior to the ‘Tech bubble’ it was believed that technology will append everything we know and the ‘tech sector stocks’ will remain in a long, multi decade bull market. Prior to the financial crisis it was believed that by using the modern methods of slicing and dicing of risk the financial industry has unlocked the holy grail of profitability and risk diversification. Alas there are no new eras. In the last 5 years we have seen the pendulum swings for many such themes. Current ‘New Era’ theories are: Commodity Supercycle, Permanently High P/E ratios… you can add your theory to this list. Source: CMIE, Data As On May 2022 There Are No New Eras: Excesses Are Never Permanent Eerie similarity between two ‘New Era’ narratives of the past. Nasdaq from 2000 ‘Tech bubble’ peak & Banks Index from ‘Financials juggernaut’ peak Bonus insight: Nasdaq went onto nearly triple after it cracked past its previous high. Can banks do that after 15 years of sub par returns? Think about it… Nasdaq crash after a 400% tech bubble rally in 2000 Banks crash during GFC 2008 after doubling in prior 3 years
  • 7. Exponential Rapidly Rising Or Falling Markets Usually Go Further Than You Think, But They Do Not Correct By Going Sideways The biggest disruption in 2022 has been in the energy markets in Europe. Especially the natural gas markets has gone through a very large supply side crunch. The Dutch TTF Natural Gas prices went from under 16 to 212 Eur/MWh over the last few months. Recently the prices have begun to fall swiftly. There is a consensus that due to the Russia- Ukraine issue, demand revival and long term underinvestment the natural Gas prices in Eurozone are likely to remain high for years. However history tells us that prices don’t move sideways after rising exponentially. So expect a crack in Natural Gas prices this year. This will be positive for energy using sectors like industrials, transportation and automotive. Source: Bloomberg, May 2022 11 27 16 181 212 85 May-15 May-16 May-17 May-18 May-19 May-20 May-21 May-22 Netherlands TTF Natural Gas Forward Month 1 (EUR/MWh) 13X rise in two quarters This is unlikely to go sideways in a correction. Expect a steep fall this year.
  • 8. 15 20 25 30 35 40 45 50 55 American Association of Individual Investors - Bearish Readings 600 1100 1600 2100 2600 3100 3600 4100 4600 S&P 500 Index The Public Buys The Most At The Top, And The Least At The Bottom Every week, AAII asks investors a question: Do you feel the direction of the stock market over the next six months will be up (bullish), no change (neutral) or down (bearish)? Combined with other indicators like valuations, earnings trends, momentum and intermarket relationships this indicator is a very useful contrarian indicator. It reflects, as it is doing now, that investors are too bearish about market’s outlook over the next 6 months. There is a wall street saying: ‘Public is mostly right but wrong only at the turn’. ? GFC ??? Investors are generally most bearish at the bottom. Source: Bloomberg, Data as on May 2022 Price Bottoms at Peak Bearish Sentiment
  • 9. 0.1 0.2 0.3 0.4 0.5 0.6 0.7 600 1100 1600 2100 2600 Nov-15 Nov-16 Nov-17 Nov-18 Nov-19 Nov-20 Nov-21 Airlines Sector Leader Stock Price (LHS) Airlines Sector Leader / MCX Crude Oil Price Fear And Greed Are Stronger Than Long-term Resolve Energy input is a large part of airlines cost and impact profitability. Energy prices are volatile. The ratio of a Indian market leader in the airlines sector and crude oil futures price at MCX gives an idea of how greed and fear functions in this cyclical industry. Every time oil prices have rallied the airlines sector stock prices have crashed. Interestingly the majority of selling and downgrades come close to the turning points. Do we know the turning points or is it just hindsight? Over the last seven years the chart on the right has bottomed closer to 0.2. This is the point of maximum fear and represents a good risk reward. Be attentive to focus on airlines stocks. Go bottoms up & find the best priced businesses. Greed Fear Energy input is a large part of airlines cost and impacts profitability. Buy Airline stocks? Source: Bloomberg, Data as on May 2022
  • 10. 0 2000 4000 6000 8000 10000 12000 14000 16000 18000 0 50 100 150 200 250 300 350 400 450 May-00 May-01 May-02 May-03 May-04 May-05 May-06 May-07 May-08 May-09 May-10 May-11 May-12 May-13 May-14 May-15 May-16 May-17 May-18 May-19 May-20 May-21 May-22 Number of Members With New 52 Week Lows Number of Members with New 52 Week Highs NSE500 Index (RHS) Markets Are Strongest When They Are Broad And Weakest When They Narrow Always look for more stocks hitting new 52 week high steadily as a sign of ongoing uptrend. If stock indices are hitting new highs with very few stocks rising, it’s generally a sign of weakness. Why? When more stocks participate in the uptrend it reflects stronger underlying risk appetite and possibly better fundamentals if supported by broad earrings growth. The post pandemic rally has characterized by more stocks rising together. Look for this sign again in H2 of 2022. this will add to conviction that markets have bottomed out in May 2022. Source: NSE, Bloomberg, Data as on May 2022 Always look for more stocks hitting new 52 week highs steadily as a sign of ongoing uptrend. If stock indices are hitting new highs with very few stocks rising, it’s generally a sign of weakness. More greens means broad bullish market Taller reds means more stocks are falling hard, a weak market
  • 11. 0 2000 4000 6000 8000 10000 12000 14000 S&P BSE REALTY Index Bear Markets Have Three Stages: Sharp Down, Reflexive Rebound & A Drawn-out Fundamental Downtrend The real estate sector has gone through a 12 year bear market. Bear market often start with a sharp and swift decline. After this decline, there is an oversold bounce that retraces a portion of that decline. The decline then continues, but at a slower and more grinding pace as the fundamentals deteriorate. It does appear that this long drawn-out bear market in realty sector ended in 2021 when the index made a higher high versus its highs made since 2010. Insight: Don’t rush when fashionable stocks crack. The trend probably changed recently and a new bull market in realty took birth. This is bullish for real estate stocks in India. Sharp drawdown Reflexive rebound A dawn-out downtrend Is the bear market over? One of the most brutal bear markets unfolded in the realty sector. The Index went through a 12 year bear market before making a higher high in 2021. This is how excesses are corrected overtime. Source: Bloomberg, Data as on May 2022
  • 12. 70 161 67 50 70 90 110 130 150 170 Mar 18 Mar 19 Mar 20 Mar 21 Mar 22 (4qma, rebased to 100) Small cars SUVs 2Ws When All The Experts And Forecasts Agree, Something Else Is Going To Happen India’s auto sector has been hurt quite a lot. Semiconductor unavailability, poor rural revival, repeated lockdowns over the last two years and large outflows from the sector has caused Nifty Auto Index to not perform over the last 5 years. The two large segments of India’s auto sector – small cars and two wheelers – have been under stress. Recently the commentary has turned even more bearish and uncertain for these two segments. Most investors and analyst have no clear signs of how auto sector will perform over the next few years. There is a good chance that something else is doing to happen – Auto outperformance. Source: Edelweiss Research, Data as on May 2022 Hurt by weak MSME/rural incomes Beneficiary of liquidity easing Indian auto sector has seen a sharp deceleration in small car sales and two wheeler sales. These are the mainstay of Indian automotive sector. Is this time to bet on the revival of Auto sector for next few years? May be yes!
  • 13. -4.5 -1.5 1.5 4.5 7.5 10.5 13.5 -15.0 -10.0 -5.0 0.0 5.0 10.0 15.0 20.0 25.0 30.0 35.0 40.0 45.0 50.0 Apr-70 Apr-72 Apr-74 Apr-76 Apr-78 Apr-80 Apr-82 Apr-84 Apr-86 Apr-88 Apr-90 Apr-92 Apr-94 Apr-96 Apr-98 Apr-00 Apr-02 Apr-04 Apr-06 Apr-08 Apr-10 Apr-12 Apr-14 Apr-16 Apr-18 Apr-20 Apr-22 CPI: Used Cars and Trucks, % Chg yoy (RHS) CPI, % Chg yoy (LHS) When All The Experts And Forecasts Agree, Something Else Is Going To Happen Inflation is the hottest topic across the world at this time. US consumer price inflation (CPI) is at 8.3%, the highest level in last 40 years. There is a very broad consensus among forecasters and policy makers that inflation is headed higher. But we have seen this in the past that reality surprises. What seems most apparent seldom happens. Can inflation soften against the consensus ? Source: St Louis Fed, FRED Data as on May 2022 The biggest driver of inflation in US, used cars and trucks prices have already begun to see deceleration The biggest consensus in the world today is- inflation is headed higher and will remain sticky. All forecasters agree on this today- some more, some less.
  • 14. 88.8% 78.0% 201.6% 148.8% 81.5% -200% -150% -100% -50% 0% 50% 100% 150% 200% 250% 0 500 1000 1500 2000 2500 3000 3500 4000 4500 5000 Dec-95 Mar-97 Jun-98 Sep-99 Dec-00 Mar-02 Jun-03 Sep-04 Dec-05 Mar-07 Jun-08 Sep-09 Dec-10 Mar-12 Jun-13 Sep-14 Dec-15 Mar-17 Jun-18 Sep-19 Dec-20 Mar-22 Bull Markets Are More Fun Than Bear Markets The financial industry and investor community are geared towards bullish markets. In bull markets most participants make exceptionally strong profits, especially those involved in the buying/selling of securities, the broker dealers. This repeats in every cycle. That’s why most commentary is always bullish. It’s more fun for everyone. But what’s really important is that the best portfolio returns are made by navigating tough bear markets and through systematic investments. Source: Bloomberg; Data as May 2022 S&P 500 Index (LHS) NYSE Broker Dealer Index (TTM EPS yoy Change%) RHS +/- Huge profitability increase in bull market Deep cut in profits and survival issues in bear market Brokers dealers make more money in bull markets & lose a lot more in bear markets!
  • 16. Disclaimer In this material DSP Investment Managers Pvt. Ltd. (the AMC) has used information that is publicly available, including information developed in-house. Information gathered and used in this material is believed to be from reliable sources. The AMC however does not warrant the accuracy, reasonableness and / or completeness of any information. The above data/statistic are given only for illustration purpose. The recipient(s) before acting on any information herein should make his/their own investigation and seek appropriate professional advice. This is a generic update; it shall not constitute any offer to sell or solicitation of an offer to buy units of any of the Schemes of the DSP Mutual Fund. The data/statistics are given to explain general market trends in the securities market, it should not be construed as any research report/research recommendation. We have included statements / opinions / recommendations in this document, which contain words, or phrases such as “will”, “expect”, “should”, “believe” and similar expressions or variations of such expressions that are “forward looking statements”. Actual results may differ materially from those suggested by the forward looking statements due to risk or uncertainties associated with our expectations with respect to, but not to, exposure to market risks, general economic and political conditions in India and other countries globally, which have an impact on our services and / or investments, the monetary and interest policies of India, inflation, deflation, unanticipated turbulence in interest rates, foreign exchange rates, equity prices or other rates or prices etc. Mutual Fund investments are subject to market risks, read all scheme related documents carefully.