SlideShare a Scribd company logo
Management Of Timber Under A Habitat Conservation Plan (HCP) In
The Pacific Northwest
                             Karl R. Walters, FORSight Resources, LLC, 3813 H Street, Vancouver, WA 98663 and
                             Gene McCaul, West Fork Timber Company, LLC, 3819 100th St SW, Suite 5B,
                             Lakewood, WA 98499.
                             ABSTRACT. West Fork Timber Company (WFTC) is a private timber company that manages
                             approximately 54,000 acres on the western slopes of the Cascade Mountains. West Fork's goal was to
                             develop a long-term harvest plan that would improve asset value over time, while simultaneously ensuring
                             that habitat requirements set forth in their Habitat Conservation Plan (HCP) would be realized. The
                             primary constraint set forth in the HCP is the maintenance of a unique Dispersal Landscape Index (DLI)
                             within a narrow (+/- 5%) range of pre-determined levels for the life of the HCP. The DLI is derived by
                             assigning different values to areas within specific distances of existing dispersal habitat (DH) in a complex
                             formula; the dispersal habitat (DH) values are then summed and divided by the total number of acres in the
                             forest to arrive at a DLI value for the ownership. This paper discusses DLI calculation and the challenges
                             involved in modeling this problem, including the types of constraints needed in the strategic model, the
                             spatial allocation of activities associated with existing and future stands in a Model II framework, and the
                             development of a rapid DLI calculator to facilitate the evaluation of alternatives. Overall, West Fork was
                             able to meet objective of higher returns from the forest while simultaneously demonstrating improvement in
                             dispersal habitat over the next four decades.
                             Key Words: habitat conservation plan, northern spotted owl, spatial planning, spatial restrictions, harvest
                             scheduling.

INTRODUCTION

West Fork Timber Company, LLC (WFTC) is a private timber company that manages approximately 54,000 acres
on the western slopes of the Cascade Mountains in Washington, known as the Mineral Tree Farm. In 1993, the US
Fish and Wildlife Service (USFWS) believed that continued harvest of mature forest habitat on WFTC lands
presented the risk for an incidental take of resident northern spotted owls (Strix occidentalis caurina). To minimize
and mitigate the effects of any incidental take, Murray Pacific Corporation, WFTC’s parent company and owners of
the Mineral Tree Farm, agreed to manage the tree farm under the terms and conditions of a habitat conservation plan
(HCP) for 100 years (Murray 1993). The permit provided assurance that WFTC could continue to operate the tree
farm without risk of prosecution for the take of owls. Continued operation of the tree farm provided the means for
WFTC to undertake conservation and management requirements of the HCP. And finally, the HCP provided the
USFWS assurance of long-term management consistent with recovery of the northern spotted owl.

The Mineral Tree Farm
The Mineral Tree Farm encompasses 53,818 acres on the west slope of the Cascade Mountains, and is characterized
by steep terrain, abundant precipitation and dense coniferous forest predominated by younger age classes (< 60 yr).

                                          Age Class Distribution

         9,000


         8,000

         7,000


         6,000

         5,000
 Acres


         4,000


         3,000


         2,000

         1,000


            0
                 1   3   5   7   9 11 13 15 17 19 21 23 25 27 29 31 33 35 37 39 41 43 45 47 49
                                                   Age Class (5 yr)


Figure 1. Age-class distribution of Mineral Tree Farm (2005).
Virtually all of the tree farm has been managed for commercial timber production, and most of it has been clearcut
or partially harvested at least once since 1913. Extensive logging also occurred in the mid to late 1980s with a
significant curtailment in the mid to late 1990s.


Figure 2. Forest cover and extent of the Mineral Tree Farm (2005).


Figure 3. Spatial distribution of age classes across the Mineral Tree Farm (2005).

The tree farm is surrounded by private, state and federal timberlands. The private and state timberlands are managed
for commercial timber production much like the tree farm, but the federal lands of the Gifford Pinchot National
Forest that border the Mineral Tree Farm to the east and west are largely managed as late-successional reserves with
the objective of maintaining mature and old-growth forest.
Dispersal Habitat
Dispersal has been defined as the movement an animal makes from its point of origin to the place where it
reproduces or would have reproduced if it had survived and found a mate (Howard 1960). It is distinguished from
movements made by individual animals within home ranges or seasonal migrations made between summer and
winter habitats. Juvenile dispersal best fits the definition of innate dispersal (Howard 1960), which is a spontaneous,
random movement related more to genetics than proximal environmental conditions.

Juvenile spotted owls initiate dispersal in September and October of their first year (Allen and Brewer 1985, Herter
1992). Dispersal is rapid at first, but is interrupted by a period of “settling” in the winter. Both Gutierrez et al (1985)
and Miller (1989) reported active and settled phases to dispersal. Juveniles that died during the settled phase had
considerably smaller ranges than those that survived and re-initiated dispersal (Miller 1989). The total straight-line
distance between the nest and the final point of detection (which represented the location of death for many juvenile
owls) has been reported to be more than 30 miles in some cases in Washington (Allen and Brewer 1985). Miller
(1989) noted that owls that survived until their second year had a mean straight-line dispersal distance of only 9.4
miles, which may indicate that first-year survival depends on how quickly an owl locates suitable, vacant habitat in
which to settle.

While dispersal appears to move randomly across a landscape, the spotted owl tends to show preference for roosting
in older stands. Although owls were observed roosting in a variety of habitats, Miller (1989) noted that mature and
old-growth forest were used disproportionately to their availability, closed sapling pole/sawtimber habitat 1 was used
roughly in proportion to availability, and younger forest types were avoided. From a management perspective, the
goal of an HCP should be to provide suitable roosting and foraging habitat in such a manner that an owl moving
randomly across a landscape is more likely to encounter suitable habitat than unsuitable habitat. Thus, it is
imperative that suitable habitat not be confined to a few concentrated areas and corridors but scattered over the
landscape.

HCP Rationale
Based on the scientific literature and recommendations of the Interagency Scientific Committee Report (Thomas et
al. 1990), it was decided that the Mineral Tree Farm would be managed to provide dispersal habitat and contribute to
the maintenance of a general landscape amenable to the dispersal of juvenile spotted owls. The shape of the tree
farm and its proximity to other habitat conservation areas (HCAs) nearby would allow dispersal habitat on the
ownership to function as a link connecting them. Habitat management on the tree farm was to focus on three main
areas: protection of water quality and fish habitat, growth and maintenance of mature forest habitat in designated
reserve areas (primarily along streams), and enhancement of wildlife habitats in managed commercial stands across
the tree farm. WFTC’s contributions to habitat management complement the efforts on adjacent public lands, by
interconnecting late-successional habitat on adjacent federal lands through the habitat reserves across the tree farm,
and by providing habitat for early and mid-successional species elsewhere. Protection of streamside areas along fish-
bearing streams and reduction in sediment delivery to streams also figured prominently in the HCP. The most
important element of the HCP, however, was management of the commercial timberlands.

Historically, WFTC harvested timber at an economic rotation age of 40 to 60 years. Under the HCP, this
management prescription is still permitted in areas where it does not conflict with the maintenance of dispersal
habitat. The management of stands between harvests and the size and timing of harvests were modified from
previous standard practices when necessary to create a landscape conducive to dispersal including,

    1.   avoidance of large areas of very young forest (gaps in dispersal landscape),
    2.   reducing the time stands exist in early successional conditions,
    3.   thinning stands to hasten development of suitable habitat conditions and,
    4.   retaining logs and snags after harvest to increase habitat diversity for owl prey.


1
 Defined as coniferous forest with average stand dbh between 1 and 21 inches and canopy closure exceeding 60%
(Hall et al. 1985). In all likelihood, owls select for stands of larger trees and against those of smaller trees.
Like any natural landscape, the Mineral Tree Farm is a complex mosaic of physical and biological conditions.
Management of such a mosaic over time is a dynamic and iterative process that cannot be done according to a rigid
set of rules established at a single point in time. Instead, progress toward and achievement of a dispersal landscape
would be monitored over time, allowing for deviations from guidelines on individual harvest units, so long as those
deviations fit within the overall landscape objectives.

Dispersal Landscape Index
The spatial arrangement of stands is just as important as the total area of forest in determining habitat for dispersing
spotted owls. To evaluate and monitor dispersal habitat (DH) at the landscape level, a numerical index was
developed called the dispersal landscape index (DLI). To calculate DLI, all areas within the Mineral Tree Farm were
assigned a dispersal habitat value (DHV) value based on their proximity to stands of suitable DH. As originally
developed, the process for calculating DH values involved the creation of a series of concentric buffers around
stands of suitable habitat and assigning progressively lower values to buffers more distant.


Figure 4. Defining dispersal habitat values for 3 suitable stands.

In Figure 4, there are 3 stands that are deemed suitable dispersal habitat for spotted owls. Interior portions of stands
meeting the definition of roosting and foraging habitat (beyond 200 ft from a clearcut edge) are assigned the highest
DHV of 10, and edge areas within the stand are assigned a DHV of 8. Beyond the stand boundary, forest areas that
are within ⅛ mi of the stand boundary are assigned a DHV of 7; within buffers of ¼ mi, ½ mi, ¾ mi, DHVs of 5, 3
and 1 are assigned, respectively. Forest areas greater than ¾ mi from suitable dispersal habitat are deemed to have
no dispersal habitat value. Once DHVs have been calculated for every acre of the forest, the DLI is calculated
simply by summing DHVs for each acre in the forest, and dividing the total by the total number of acres. For
example, if the total DHV for the Mineral Tree Farm was calculated to be 240,000, the DLI score would be 4.59.

The net effect of the scoring is to give higher DLI values to landscapes with greater dispersal habitat and more
uniform distribution of that habitat. Forests with comparable acres of dispersal habitat can have very different DLI
scores: clumping of the habitat does not increase scores of the stands since interior portions are already at the
maximum DHV, and if the habitat is clumped there are necessarily greater amounts of gap in the landscape. A DLI
value of 10 would place the entire tree farm in dispersal habitat, but no harvesting could take place without
increasing gap areas. Therefore, to make the tree farm economically sustainable, it was determined that the optimum
configuration of stands within a landscape managed for timber production and owl dispersal be composed of stands
5 to 120 acres in size (with an optimum size of 40 acres) spaced no more than ¼ mile apart, which yields a DLI of
7.50. At the time the HCP was signed, the Mineral Tree Farm DLI was 5.34, and the projected DLI after the first 50
years implementation of the HCP was 7.47, after which it was to remain at or above this value.

WFTC developed a geographic information system database for tracking stand conditions and a model for predicting
dispersal habitat (DH). Future dispersal habitat was initially estimated by modeling the growth of existing stands
using the Stand Projection System (SPS) growth and yield model (Arney 1986) for the first 50 years of the HCP. All
stands then considered suitable were considered to remain suitable unless harvested. Stands that were not considered
suitable initially would become suitable when they attained an average dbh of 9.2 inches and a minimum age of 27
to 53 years, depending on site class. This was considered a conservative estimate because many stands would meet
the DH criteria before they reached an average dbh of 9.2 inches, but it was used as a limit to avoid the risk of
assuming a stand being deemed DH before it actually qualified as such. By projecting stands forward through time,
and estimating harvests based on guidelines established in the HCP, WFTC was able to predict how the forest would
develop, and calculate DLI for the Mineral Tree Farm for the next 50 years.

                                                           Trend for Dispersal Landscape Index for Mineral Tree Farm


                                     8


                                    7.5
  Dispersal Landscape Index (DLI)


                                     7


                                    6.5


                                     6


                                    5.5


                                     5
                                      1988   1993   1998     2003     2008     2013     2018     2023     2028    2033   2038   2043   2048
                                                                                        Year


Figure 5. DLI trend for the Mineral Tree Farm for implementation of HCP for 50 years.

WFTC operated the tree farm for over 10 years under the HCP, using periodic re-projections of the existing
inventory (as described) to demonstrate continued improvement in dispersal habitat and dispersal landscape index
scores, while continuing to harvest timber. However, the timber markets in the Pacific Northwest had changed
significantly in the ten years that had passed since the HCP was signed. WFTC management was interested in
exploring optimization and spatial planning tools to see if the economic returns from the Mineral Tree Farm could
be simultaneously improved along with dispersal habitat. FORSight Resources, LLC (FORSight) was contracted in
2005 to develop a strategic forest management model and spatial harvest schedule for the Mineral Tree Farm.

Strategic Model

FORSight chose the Remsoft Spatial Planning Suite as the modeling environment for this project, with Spatial
Woodstock as the strategic modeling environment and Stanley as the tactical planning tool. WFTC management had
numerous objectives that required the development of a fairly sophisticated strategic planning model. The
mountainous conditions on the tree farm make stand elevation and logging season important considerations in
running a profitable logging operation and cost-effective silviculture program. The mix of steep terrain and valley
floors require controls on logging method to balance operations assigned to shovel, hi-lead and helicopter logging.
The goal of maintaining and improving dispersal habitat across the forest necessitated the inclusion of existing
suitable-habitat stands, watersheds, reserve areas, and management emphasis in the overall stratification. A tree-
based growth and yield model (Organon-SMC variant) was used to develop yield tables, based on cover type, basal
area, site and stocking/planting density. Overall, WFTC’s strategic planning model required 13 landscape themes to
fully describe the forest land base. A planning horizon of 150 years, composed of 5-year planning periods was
chosen to match the resolution of the growth and yield model, and to provide sufficient time to avoid model artifacts
within the first 10 planning periods that are attributable to the effects of the end of the planning horizon.

The silvicultural program implemented in the model included planting (2 species – Douglas-fir and noble fir, 2
planting densities each), precommercial thinning to 4 different spacings, fertilization and herbaceous competition
control, commercial thinning, pruning and clearcut harvesting. Pruning and precommercial thinning to four spacings
are not typical for commercial timberlands and many would question their economic value to timber production. In
direct terms, these treatments generally do not improve volume or value growth sufficiently to warrant the
expenditure, but WFTC was interested to know if these treatments would pay indirectly by developing suitable
foraging and roosting habitat sooner in younger stands.

Objective function
The objective function used for the strategic planning model maximized discounted revenue from timber harvesting,
net of silviculture, logging and hauling costs. Instead of a pure-stumpage model, WFTC opted for a coarse-level
delivered price model using mill-delivered prices, average hauling costs, and sophisticated logging cost functions for
each logging method that varied by stand volume.

                                             Skyline-Helicoptor - $/MBF Logging Costs


          $2,500.00


          $2,000.00


          $1,500.00
  $/MBF


          $1,000.00


           $500.00


              $-
                        5        10        15        20        25         30       35        40         45         50       55        60
            F&B       $150.00   $75.00   $50.00    $37.50    $30.00     $25.00   $21.40    $18.80    $16.70      $15.00   $13.60    $12.50
            Y&L       $2,000.0 $1,000.0 $666.70    $500.00   $400.00   $333.30   $285.70   $250.00   $222.20    $200.00   $181.80   $166.70
            Total     $2,150.0 $1,075.0 $716.70    $537.50   $430.00   $358.30   $307.10   $268.80   $238.90    $215.00   $195.40   $179.20
            Low Vol   $1,004.0 $860.50   $717.00   $573.50   $430.00
            Med Vol                                          $430.00   $376.25   $322.50   $268.75
            Hi Vol                                                                         $268.80   $246.40    $224.00   $201.60   $179.20
                                                                           MBF/Acre

                                                   F&B       Y&L       Total     Low Vol      Med Vol         Hi Vol

Figure 6. Skyline and helicopter logging cost function for Mineral Tree Farm (2005).

Constraints
WFTC management had specific objectives for improving economic efficiency. Based on their previous projections
(described earlier), they believed that they had reasonable estimates of annual harvest volumes that could be
achievable under the HCP. What they were lacking were controls on harvest volume flows, not only from year-to-
year, but on a quarterly basis. Given the mix of logging equipment available in the area, it was important for WFTC
to schedule a mix of flat and steep-terrain, as well as summer versus winter harvest blocks. Constraints were
included that required the number of acres assigned to shovel logging be greater than or equal to the acres assigned
to the more expensive helicopter logging operations. Total saw log harvests were allowed to vary by as much as
10% period-to period, provided that harvest volumes never fell below harvest goals established with WFTC’s
previous projection methods.
Because the calculation of DLI is complex and inherently non-linear, it was impossible to directly constrain it in the
strategic model. WFTC used stand age and a projected time to reach a DBH of 9.2 as a proxy for estimating time to
reach DH status. FORSight decided to try to model DH directly by tracking several stand parameters in the growth
and yield projections. Considerations in the determination of DH status are:

    •    Species. A stand must be dominated by conifer species.
    •    Density. A stand must have fewer than 300 trees/ac and basal area of at least 70 ft2/ac in trees greater than
         10” DBH.
    •    At least 20’ of clear flying space must be available.

The last requirement is difficult to model directly but we decided to include as a yield component in the model a
proxy: average height to crown base (AVHCB) - the space between the ground and lowest branches of the live
crown. The calculation of AVHCB depends not only on height growth but crown recession as well. Clear flying
space would also depend on how quickly trees shed dead limbs. Using WFTC’s experience with monitoring
dispersal habitat, an empirical relationship was developed by calculating the AVHCB for stands that already qualify
as DH. Within the strategic planning model, acres are counted as DH if they meet the species and density
requirements and exceed a threshold value for AVHCB. The higher the threshold, the longer it takes to achieve DH
status. The threshold values of AVHCB that best matched the empirical data were 35 ft for unthinned stands, 30 ft
for thinned stands and 25’ for pruned stands. Once DH acres could be calculated in the model, it was easy to
formulate floor constraints on acres of dispersal habitat that corresponded to the acres specified in the HCP.

Tactical Model

FORSight used Spatial Woodstock and Stanley in concert to block out the first 40 years of the planning horizon (8
five-year periods) that corresponded to the time remaining in the HCP to reach a maximum DLI. The process was
complicated by the need to control both activity-generated outputs (harvest volumes) and inventory outputs (DH),
and the need to spatially allocate activities on future stands. At that time, Stanley was not able to control for
inventory-based outputs, or spatially allocate activities beyond the final harvest. To get around this limitation,
FORSight developed an iterative rollover process of spatial allocation, until all 8 periods of the tactical planning
horizon were completed.

A spatial simulation (Remsoft's term for allocating activities without spatial restrictions) mapped out most
treatments well. Blocking final harvests worked so long as only stands that currently existed were harvested,
because the thematic attributes matched what was in the shapefile. Once a stand was thinned or pruned or fertilized,
its thematic attributes in Woodstock no longer matched the theme fields in the shapefile. The rollover process
involved the following steps:

    1.   Run Stanley to allocate initial harvest blocks (Schedule file attributes match shapefile). Post activities to
         Treatments field.
    2.   Use the Assign Schedule to Polygons feature to spatially allocate the mid-rotation treatments (Append to
         Treatments field).
    3.   Use the time selector to advance one period.
    4.   Copy virtual thematic attributes to temporary fields
    5.   Use time selector to revert to the previous period and copy thematic attributes from temporary fields to
         theme fields.
    6.   Repeat process iteratively until all periods are adequately allocated.

Once the activities were spatially allocated, thematic maps indicating the location of suitable DH stands had to be
produced for each of the tactical planning periods for DLI calculation. A sequence file was also generated so that
reports of the tactical harvest schedule could be produced by running the tactical harvest schedule back through
Woodstock.
Updated DLI calculation

The original process of calculating DLI using a GIS to generate iterative buffers was too slow and cumbersome for
this process. Instead, a raster-based method using ESRI software was developed by FORSight to process vectorized
versions of the maps produced after spatial allocation. A pixel size of 220 feet was chosen because all of the DLI
buffer distances were integer multiples except one: the interior space of a suitable stand would be slightly
underestimated because the required edge buffer needed to only be 200 feet. Since this would yield a conservative
estimate of DLI, it was deemed acceptable. In minutes, the new DLI calculator was able to process 9 DH maps and
produce DLI scores corresponding to the end of each planning period plus initial conditions.

The process of generating DH maps required Spatial Woodstock’s time selector to project future conditions. A
thematic map was created based on the inventory output DH. After the treatments from the Stanley allocation were
posted to the Treatments field, it was easy to use the time selector to generate maps of DH condition for current and
future planning periods. A shapefile was exported for each time period of interest, and these in turn were converted
to a raster format using ESRI’s ArcGIS software. Once rasterized, the DLI calculation was performed for each
mapped time step.

Results

In total, 12 runs of the strategic model were completed before a preferred alternative was selected. Because this was
the first time WFTC had used an optimization approach, it was important to see the effects of the various constraints
on the objective function (present net value). The first model run was completely unconstrained to serve as a
benchmark for later runs and additional constraints. Over the course of the analysis, some constraints were
eliminated; for example, the constraints on harvest season made a difference of only a few thousand dollars over the
entire planning horizon, and WFTC management considered the benefit to be minimal. The constraints on minimal
dispersal habitat were tightened in the strategic model by 2.5% in each period to facilitate tactical planning: since
there is usually some fall-down in output levels from the strategic plan in a Stanley solution, requiring more DH
than the minimum in the strategic solution would allow a fall-down in the tactical solution that still met
requirements of the HCP. Under the HCP, WFTC is restricted to clearcut no more than 10,000 acres per decade and
no more than 2,500 acres in any given year. Since the planning model uses 5 year periods, it was decided to
constrain using the more restrictive limit (1,000 ac per year), requiring no more than 5,000 acres of clear cut
harvesting in any planning period.

Strategic results
One of the motivations for WFTC to explore optimization in their planning was to determine if it was possible to
increase harvest levels while continuing to comply with the requirements of the HCP. The strategic model
demonstrated that increased harvest levels were indeed possible in the final preferred alternative. In the first three
planning periods, total saw log harvests exceeded WFTC’s previous volume goals by at least 47% and as much as
62%. The source of this additional harvest volume was attributed to the harvest of existing DH stands, which could
be harvested sooner through a form of allowable cut effect.

Allowable cut effects are usually attributable to non-declining flow constraints and improved growth of future
stands, such that an immediate increase in harvest can be attained. In the case of the Mineral Tree Farm model, it
was not a change in volume growth that allowed the increased harvest, but a shortening of the time to DH through
silviculture (thinning and pruning). WFTC management was surprised by the extent of pruning selected in the
optimal solution but quickly realized how the model was trading off the additional expense of silviculture against the
holding cost of retaining existing DH stands longer in the future. By producing suitable DH stands at a younger age
through silviculture, the model demonstrated how it was possible to shorten overall timber rotations and thus
improve economic returns from the tree farm.

Tactical results
While the results of the strategic modeling exercise were exciting, there was no guarantee that similar benefits
would accrue once the solution was allocated spatially. WFTC was interested in a spatial solution for the first 40
years of the planning horizon, but to give Stanley some extra flexibility in choosing candidate stands FORSight
decided to schedule the first 10 planning periods with Stanley. And though the objective function in the Woodstock
model maximized discounted net revenue, it seemed more prudent to set harvest volume and acre outputs as the
objectives for the Stanley runs. Six Woodstock outputs were chosen as the weighted scoring criteria: total saw log
harvest volume (weight = 2.0), Douglas-fir saw log volume (weight = 1.5), white wood saw log volume (weight =
1.5), clearcut acres (weight = 1.25), hi-lead logging acres (weight = 1.0) and shovel logging acres (weight = 1.0).

The results were remarkably good for a heavily constrained harvest schedule. Relative to the minimum volume goals
specified as constraints for the first 10 periods, the Stanley tactical solution generated 14% more volume over the
first 10 periods, using a Woodstock solution that was 21% higher than the minimum targets. The tactical solution
attained 93% of the present net value predicted in the strategic planning model.


                             Harvest Volume Comparison by Period

                   180

                   160

                   140
   Volume (MMBF)


                   120

                   100

                   80

                   60

                   40

                   20

                    0
                         1   2        3         4             5         6            7   8      9       10
                                                       Planning Period

                                                    Stanley       Woodstock   Goal

Figure 7. Projected harvest levels in Stanley and Woodstock solutions relative to WFTC goals.

Figure 7 indicates illustrates that planning periods 3, 7 and 8 are more adversely affected by spatial constraints,
exhibiting significant reductions from the predicted volumes in the corresponding Woodstock solution. Only in the
latter periods does the Stanley result fall below the goal values established by WFTC in earlier analyses, and the
shortfalls are minor.

There is also remarkably close correspondence between the Woodstock and Stanley solutions in terms of acres
allocated to mid-rotation silviculture and final harvests. No timing choice deviations on the mid-rotation silvicultural
treatments and only minimal deviations on the timing of harvests (clearcuts, commercial thins) were allowed, to
facilitate the roll-over process described earlier. In early periods, it is trivial to allocate mid-rotation silvicultural
treatments because the treated stands already exist. In later periods, where a mid-rotation treatment is applied to a
stand that does not yet exist (it was final harvested earlier), it becomes more problematic since the final harvest in
the Stanley solution that led to its creation may have deviated from the Woodstock solution. This issue could
probably be overcome by iteratively going back and forth to the Woodstock model, each time including more pre-
allocated treatment decisions from the previous Stanley solution. However, the time and effort required would be
substantial but would not yield significantly improved results.
Commercial Thinning Activity                                                                    Pruning Activity

               400                                                                                                     2,500


               350
                                                                                                                       2,000
               300

               250                                                                                                     1,500


                                                                                                               Acres
     Acres


               200

                                                                                                                       1,000
               150

               100
                                                                                                                         500
                50

                  0                                                                                                        0
                          1        2         3       4             5            6          7    8   9   10                     1   2   3     4       5        6        7   8   9   10

                                                               Planning Period                                                                   Planning Period

                                                               Stanley       Woodstock                                                           Stanley   Woodstock


                                                     PCT Activity                                                                      Final Harvest Activity

               4000                                                                                                    6,000


               3500
                                                                                                                       5,000

               3000
                                                                                                                       4,000
               2500
     Acres


                                                                                                             Acres
               2000                                                                                                    3,000

               1500
                                                                                                                       2,000
               1000

                500
                                                                                                                       1,000


                   0
                                                                                                                          0
                          1        2          3      4                 5        6          7    8   9   10
                                                                                                                               1   2   3     4      5        6         7   8   9   10
                                                               Planning Period
                                                                                                                                                 Planning Period
                                                                Stanley      Woodstock                                                           Stanley   Woodstock


Figure 8. Acres allocated in the tactical solution relative to the strategic planning model solution.

The final hurdles to declaring success in this planning effort were to demonstrate that dispersal habitat acres and
DLI scores for the Mineral Tree Farm conformed to the requirements of the HCP. For DH acres, the tactical solution
could not allow DH acres to fall below the minimum acres specified in the HCP. For DLI scores, a margin of error
of ±5% around the values specified in the HCP are permitted.

                                  Dispersal Habitat Production vs. Goal

               30,000


               25,000


               20,000
 Acres of DH


               15,000


               10,000


                5,000


                      0
                              1        2         3       4             5         6         7    8   9   10

                                                                Planning Period
                                                             Stanley       Woodstock     Goal


Figure 9. Projected dispersal habitat and DLI scores.

Because dispersal habitat was an inventory measure in the strategic model and could not be directly controlled in
Stanley, there was concern that DH acres may have varied too greatly in the tactical solution. Luckily, this was not
the case but the model was constructed to allow constraints on activities at the watershed level. If necessary,
harvests could have been concentrated in watersheds or dispersed across watersheds to bring the DLI scores closer
to desired levels. In both cases, the tactical solution met or exceeded the requirements of the HCP. Moreover, the
projected DLI scores exceeded the baseline requirements in every planning period by a substantial amount, although
still within the 5% margin of error.

Discussion

WFTC undertook this planning effort to determine if optimization and hierarchical planning tools could improve
financial returns on the Mineral Tree Farm. Based on the results, the answer was a resounding yes. Some of the
important outcomes included,

    •    An economically efficient strategic plan was devised using an optimization model with discounted net
         revenue as its objective; previous planning efforts at WFTC focused on volume production as the objective.

    •    Relative to goals established in previous WFTC planning efforts, harvest levels over the first 50 years were
         21% higher in this strategic planning solution and 14% higher in the tactical planning solution. Harvest
         levels were constrained to fluctuate within acceptable tolerances, and harvest acres were kept within
         allowable limits.

    •    The results indicated that investments in thinning and pruning, while not necessarily economically
         advantageous from a timber production standpoint, had the potential to reduce timber rotations by
         producing foraging and roosting habitat in less time, requiring less holding time for existing DH stands.

    •    Dispersal habitat creation met or exceeded targets established in the HCP and the spatial arrangement of
         harvests in the tactical solution yielded DLI scores that were well within tolerances specified in the HCP.

    •    A new DLI calculator was developed using a raster-based approach instead of the vector-based buffer
         approach used previously. The new calculator was significantly faster.

The Mineral Tree Farm HCP is unique in the State of Washington in the use of the dispersal landscape index as a
basis for evaluating management progress; the authors are aware of no other habitat conservation plans that use this
approach. Nevertheless, it could be used to supplement planning efforts on other habitat conservation areas where
the northern spotted owl is an important consideration.

Literature Cited

ALLEN, H.L. AND L.W. BREWER. 1985. A review of current northern spotted owl (Strix occidentalis caurina)
   research in Washington State. IN R.J. Gutierrez and A.B. Carey, eds. Ecology and management of the spotted
   owl in the Pacific Northwest, USDA For. Serv. Gen. Tech. Rept. PNW-185, Portland, OR.

GUTIERREZ, R.J., A.B. FRANKLIN, W. LAHAYE, V.J. MERETSKY AND J.P. WARD. 1985. Juvenile spotted owl
   dispersal in northwestern California: Preliminary results. IN R.J. Gutierrez and A.B. Carey, eds. Ecology and
   management of the spotted owl in the Pacific Northwest, USDA For. Serv. Gen. Tech. Rept. PNW-185,
   Portland, OR.

HERTER, D.R. 1992. Spotted owl monitoring reports: 15 September 1991 to 15 December 1991 and 15 December
   1991 to 15 January 1992. Reports to Plum Creek Corporation, Raedeke Assoc. Scientific Consulting, Seattle,
   WA.

HOWARD, W.E. 1960. Innate and environmental dispersal of individual vertebrates. Am. Midl. Nat. 63(1):152-161.

MILLER, G.S. 1989. Dispersal of juvenile northern spotted owls in Western Oregon. M.S. Thesis, Oregon State
   Univ., Corvallis. 139pp.
MURRAY PACIFIC CORPORATION. 1993. Habitat Conservation Plan for the Northern Spotted Owl (Strix occidentalis
   caurina) on Timberlands owned by The Murray Pacific Corporation, Lewis County, Washington. 100pp +
   appendices.

THOMAS, J.W., E.D. FORSMAN, J.B. LINT, E.C. MESLOW, B.R. NOON AND J. VERNER, 1990. A conservation strategy
   for the northern spotted owl. Interagency Scientific Committee to Address the Conservation of the Northern
   Spotted Owl, Portland, OR.

More Related Content

What's hot

IGARSS-2011.ppt
IGARSS-2011.pptIGARSS-2011.ppt
IGARSS-2011.ppt
grssieee
 
Ever crop for low rainfall areas
Ever crop for low rainfall areasEver crop for low rainfall areas
Ever crop for low rainfall areas
Greg Lawrence
 
poster version 2
poster version 2poster version 2
poster version 2
Alyssa Piper
 
4 ijfaf feb-2018-3-effect of different growth media
4 ijfaf feb-2018-3-effect of different growth media4 ijfaf feb-2018-3-effect of different growth media
4 ijfaf feb-2018-3-effect of different growth media
AI Publications
 
El futuro de los bosques y de los descortezadores?
El futuro de los bosques y de los descortezadores?El futuro de los bosques y de los descortezadores?
El futuro de los bosques y de los descortezadores?
Jorge Mendez González
 
Ecological Forestry in Douglas-Fir (Pseudotsuga menziesii) Forests of the Pac...
Ecological Forestry in Douglas-Fir (Pseudotsuga menziesii) Forests of the Pac...Ecological Forestry in Douglas-Fir (Pseudotsuga menziesii) Forests of the Pac...
Ecological Forestry in Douglas-Fir (Pseudotsuga menziesii) Forests of the Pac...
Lily Tidwell
 
EcoSummit: Ecological Complexity and Sustainability, China 2007
EcoSummit: Ecological Complexity and Sustainability, China 2007 EcoSummit: Ecological Complexity and Sustainability, China 2007
EcoSummit: Ecological Complexity and Sustainability, China 2007
Dr. Amalesh Dhar
 
Rangeland use agreement
Rangeland use agreementRangeland use agreement
Rangeland use agreement
GreengoldMongolia
 
Growth, yield and economic returns of striped catfish (Pangasianodon hypophth...
Growth, yield and economic returns of striped catfish (Pangasianodon hypophth...Growth, yield and economic returns of striped catfish (Pangasianodon hypophth...
Growth, yield and economic returns of striped catfish (Pangasianodon hypophth...
Md. Atick Chowdhury
 
Wildlife Corridors
Wildlife CorridorsWildlife Corridors
Wildlife Corridors
Simu Dulai
 
ASB Poster 2016
ASB Poster 2016ASB Poster 2016
ASB Poster 2016
Guy Stewart
 
Effect of selective logging on the flora composition in the rainforest of Ghana
Effect of selective logging on the flora composition in the rainforest of GhanaEffect of selective logging on the flora composition in the rainforest of Ghana
Effect of selective logging on the flora composition in the rainforest of Ghana
Hopeson Eli Etsra
 
PC30_Gould__Sauther_Declining_L_catta
PC30_Gould__Sauther_Declining_L_cattaPC30_Gould__Sauther_Declining_L_catta
PC30_Gould__Sauther_Declining_L_catta
Jen Miller
 
Teaching Forest Stand Dynamics
Teaching Forest Stand DynamicsTeaching Forest Stand Dynamics
Teaching Forest Stand Dynamics
Edward Wilson
 
Influence of some site factors on germinative parameters of Quercus seeds
Influence of some site factors on germinative parameters of Quercus seedsInfluence of some site factors on germinative parameters of Quercus seeds
Influence of some site factors on germinative parameters of Quercus seeds
AI Publications
 
Identifying Coastal Forest Merlin (Falco columbarius suckleyi) Breeding Habit...
Identifying Coastal Forest Merlin (Falco columbarius suckleyi) Breeding Habit...Identifying Coastal Forest Merlin (Falco columbarius suckleyi) Breeding Habit...
Identifying Coastal Forest Merlin (Falco columbarius suckleyi) Breeding Habit...
Christopher Talley
 
Wildlife Corridor and Its Importance
Wildlife Corridor and Its ImportanceWildlife Corridor and Its Importance
Wildlife Corridor and Its Importance
nikeshkathayat
 
Frugivory homegardengoulartetal2011
Frugivory homegardengoulartetal2011Frugivory homegardengoulartetal2011
Frugivory homegardengoulartetal2011
Fernando Goulart
 
Ferns
FernsFerns
Habitat Change Analysis Project
Habitat Change Analysis ProjectHabitat Change Analysis Project
Habitat Change Analysis Project
John Reiser
 

What's hot (20)

IGARSS-2011.ppt
IGARSS-2011.pptIGARSS-2011.ppt
IGARSS-2011.ppt
 
Ever crop for low rainfall areas
Ever crop for low rainfall areasEver crop for low rainfall areas
Ever crop for low rainfall areas
 
poster version 2
poster version 2poster version 2
poster version 2
 
4 ijfaf feb-2018-3-effect of different growth media
4 ijfaf feb-2018-3-effect of different growth media4 ijfaf feb-2018-3-effect of different growth media
4 ijfaf feb-2018-3-effect of different growth media
 
El futuro de los bosques y de los descortezadores?
El futuro de los bosques y de los descortezadores?El futuro de los bosques y de los descortezadores?
El futuro de los bosques y de los descortezadores?
 
Ecological Forestry in Douglas-Fir (Pseudotsuga menziesii) Forests of the Pac...
Ecological Forestry in Douglas-Fir (Pseudotsuga menziesii) Forests of the Pac...Ecological Forestry in Douglas-Fir (Pseudotsuga menziesii) Forests of the Pac...
Ecological Forestry in Douglas-Fir (Pseudotsuga menziesii) Forests of the Pac...
 
EcoSummit: Ecological Complexity and Sustainability, China 2007
EcoSummit: Ecological Complexity and Sustainability, China 2007 EcoSummit: Ecological Complexity and Sustainability, China 2007
EcoSummit: Ecological Complexity and Sustainability, China 2007
 
Rangeland use agreement
Rangeland use agreementRangeland use agreement
Rangeland use agreement
 
Growth, yield and economic returns of striped catfish (Pangasianodon hypophth...
Growth, yield and economic returns of striped catfish (Pangasianodon hypophth...Growth, yield and economic returns of striped catfish (Pangasianodon hypophth...
Growth, yield and economic returns of striped catfish (Pangasianodon hypophth...
 
Wildlife Corridors
Wildlife CorridorsWildlife Corridors
Wildlife Corridors
 
ASB Poster 2016
ASB Poster 2016ASB Poster 2016
ASB Poster 2016
 
Effect of selective logging on the flora composition in the rainforest of Ghana
Effect of selective logging on the flora composition in the rainforest of GhanaEffect of selective logging on the flora composition in the rainforest of Ghana
Effect of selective logging on the flora composition in the rainforest of Ghana
 
PC30_Gould__Sauther_Declining_L_catta
PC30_Gould__Sauther_Declining_L_cattaPC30_Gould__Sauther_Declining_L_catta
PC30_Gould__Sauther_Declining_L_catta
 
Teaching Forest Stand Dynamics
Teaching Forest Stand DynamicsTeaching Forest Stand Dynamics
Teaching Forest Stand Dynamics
 
Influence of some site factors on germinative parameters of Quercus seeds
Influence of some site factors on germinative parameters of Quercus seedsInfluence of some site factors on germinative parameters of Quercus seeds
Influence of some site factors on germinative parameters of Quercus seeds
 
Identifying Coastal Forest Merlin (Falco columbarius suckleyi) Breeding Habit...
Identifying Coastal Forest Merlin (Falco columbarius suckleyi) Breeding Habit...Identifying Coastal Forest Merlin (Falco columbarius suckleyi) Breeding Habit...
Identifying Coastal Forest Merlin (Falco columbarius suckleyi) Breeding Habit...
 
Wildlife Corridor and Its Importance
Wildlife Corridor and Its ImportanceWildlife Corridor and Its Importance
Wildlife Corridor and Its Importance
 
Frugivory homegardengoulartetal2011
Frugivory homegardengoulartetal2011Frugivory homegardengoulartetal2011
Frugivory homegardengoulartetal2011
 
Ferns
FernsFerns
Ferns
 
Habitat Change Analysis Project
Habitat Change Analysis ProjectHabitat Change Analysis Project
Habitat Change Analysis Project
 

Viewers also liked

Amazing students of gyan vihar university jaipur with social commitments ch...
Amazing students of gyan vihar university jaipur with social commitments   ch...Amazing students of gyan vihar university jaipur with social commitments   ch...
Amazing students of gyan vihar university jaipur with social commitments ch...
Dr. Trilok Kumar Jain
 
The eye of the innovator
The eye of the innovatorThe eye of the innovator
The eye of the innovator
Dr. Trilok Kumar Jain
 
The Planets, of Alejandro A.
The Planets, of Alejandro A.The Planets, of Alejandro A.
The Planets, of Alejandro A.
Adrianey Arana
 
Amazing managerial skills of students of suresh gyan vihar university jaipur
Amazing managerial skills of students of suresh gyan vihar university jaipurAmazing managerial skills of students of suresh gyan vihar university jaipur
Amazing managerial skills of students of suresh gyan vihar university jaipur
Dr. Trilok Kumar Jain
 
Revolutionary pm narendra modi introducing digital economy from cashless to t...
Revolutionary pm narendra modi introducing digital economy from cashless to t...Revolutionary pm narendra modi introducing digital economy from cashless to t...
Revolutionary pm narendra modi introducing digital economy from cashless to t...
Dr. Trilok Kumar Jain
 
Tabla grupos funcionales
Tabla grupos funcionalesTabla grupos funcionales
Tabla grupos funcionales
Quo Vadis
 

Viewers also liked (6)

Amazing students of gyan vihar university jaipur with social commitments ch...
Amazing students of gyan vihar university jaipur with social commitments   ch...Amazing students of gyan vihar university jaipur with social commitments   ch...
Amazing students of gyan vihar university jaipur with social commitments ch...
 
The eye of the innovator
The eye of the innovatorThe eye of the innovator
The eye of the innovator
 
The Planets, of Alejandro A.
The Planets, of Alejandro A.The Planets, of Alejandro A.
The Planets, of Alejandro A.
 
Amazing managerial skills of students of suresh gyan vihar university jaipur
Amazing managerial skills of students of suresh gyan vihar university jaipurAmazing managerial skills of students of suresh gyan vihar university jaipur
Amazing managerial skills of students of suresh gyan vihar university jaipur
 
Revolutionary pm narendra modi introducing digital economy from cashless to t...
Revolutionary pm narendra modi introducing digital economy from cashless to t...Revolutionary pm narendra modi introducing digital economy from cashless to t...
Revolutionary pm narendra modi introducing digital economy from cashless to t...
 
Tabla grupos funcionales
Tabla grupos funcionalesTabla grupos funcionales
Tabla grupos funcionales
 

Similar to Management of timber under a habitat conservation plan (HCP) in the Pacific Northwest

Variable Retention Harvest
Variable Retention HarvestVariable Retention Harvest
Variable Retention Harvest
Tracy Mezger
 
An Assessment of the Focal-Species Approach for Conserving Birds in Variegate...
An Assessment of the Focal-Species Approach for Conserving Birds in Variegate...An Assessment of the Focal-Species Approach for Conserving Birds in Variegate...
An Assessment of the Focal-Species Approach for Conserving Birds in Variegate...
Miranda Anderson
 
The Relationship Between the Understory Shrub Component of Coastal Redwoods
The Relationship Between the Understory Shrub Component of Coastal RedwoodsThe Relationship Between the Understory Shrub Component of Coastal Redwoods
The Relationship Between the Understory Shrub Component of Coastal Redwoods
6D45520z848622K444
 
Junger and Duong Butterfly Report 2015
Junger and Duong Butterfly Report 2015Junger and Duong Butterfly Report 2015
Junger and Duong Butterfly Report 2015
Gabrielle Duong
 
Managed Grazing in Riparian Areas
Managed Grazing in Riparian AreasManaged Grazing in Riparian Areas
Managed Grazing in Riparian Areas
ElisaMendelsohn
 
Managed Grazing in Riparian Areas
Managed Grazing in Riparian AreasManaged Grazing in Riparian Areas
Managed Grazing in Riparian Areas
ElisaMendelsohn
 
South West Habitat Guidelines
South West Habitat GuidelinesSouth West Habitat Guidelines
South West Habitat Guidelines
Pitchstone Waters
 
Restoration, Reconciliation, and Reconnecting with Nature Nearby
Restoration, Reconciliation, and Reconnecting with Nature NearbyRestoration, Reconciliation, and Reconnecting with Nature Nearby
Restoration, Reconciliation, and Reconnecting with Nature Nearby
School Vegetable Gardening - Victory Gardens
 
Theory To Practice Can We Manage Riparian Areas For More Than Big Trees
Theory To Practice  Can We Manage Riparian Areas For More Than Big TreesTheory To Practice  Can We Manage Riparian Areas For More Than Big Trees
Theory To Practice Can We Manage Riparian Areas For More Than Big Trees
Ecoshare
 
Grant_Cait_FINAL
Grant_Cait_FINALGrant_Cait_FINAL
Grant_Cait_FINAL
Caitlin Grant
 
Regrowth to Rainforest: Assessing the conservation values of Camphor Laurel
Regrowth to Rainforest: Assessing the conservation values of Camphor LaurelRegrowth to Rainforest: Assessing the conservation values of Camphor Laurel
Regrowth to Rainforest: Assessing the conservation values of Camphor Laurel
Jessica Pinder
 
Spatial distribution and species abundance area of Non Timber Forest Products...
Spatial distribution and species abundance area of Non Timber Forest Products...Spatial distribution and species abundance area of Non Timber Forest Products...
Spatial distribution and species abundance area of Non Timber Forest Products...
AI Publications
 
Forest conservation in light of climate change
Forest conservation in light of climate changeForest conservation in light of climate change
Forest conservation in light of climate change
theREDDdesk
 
Grasslands slides
Grasslands slidesGrasslands slides
Grasslands slides
neesh2
 
Komodo dragon assignment (2nd yr)
Komodo dragon assignment (2nd yr)Komodo dragon assignment (2nd yr)
Komodo dragon assignment (2nd yr)
Celise Taylor
 
Seedlings_ Substrate Preferences in a Minnesota Old Growth Thuja-
Seedlings_ Substrate Preferences in a Minnesota Old Growth Thuja-Seedlings_ Substrate Preferences in a Minnesota Old Growth Thuja-
Seedlings_ Substrate Preferences in a Minnesota Old Growth Thuja-
Stephen Rossiter
 
Losing Ground, Executive Summary
Losing Ground, Executive SummaryLosing Ground, Executive Summary
Losing Ground, Executive Summary
National Wildlife Federation
 
Capstone Project pgs 1-7
Capstone Project pgs 1-7Capstone Project pgs 1-7
Capstone Project pgs 1-7
Steven Kelley
 
Rangeland Degradation and Rehabilitation: Indigenous Ecological Knowledge and...
Rangeland Degradation and Rehabilitation: Indigenous Ecological Knowledge and...Rangeland Degradation and Rehabilitation: Indigenous Ecological Knowledge and...
Rangeland Degradation and Rehabilitation: Indigenous Ecological Knowledge and...
AI Publications
 
One stand at a time: Silvicultural options for stand-level response to clim...
One stand at a time: Silvicultural options  for stand-level response  to clim...One stand at a time: Silvicultural options  for stand-level response  to clim...
One stand at a time: Silvicultural options for stand-level response to clim...
Northern Institute of Applied Climate Science
 

Similar to Management of timber under a habitat conservation plan (HCP) in the Pacific Northwest (20)

Variable Retention Harvest
Variable Retention HarvestVariable Retention Harvest
Variable Retention Harvest
 
An Assessment of the Focal-Species Approach for Conserving Birds in Variegate...
An Assessment of the Focal-Species Approach for Conserving Birds in Variegate...An Assessment of the Focal-Species Approach for Conserving Birds in Variegate...
An Assessment of the Focal-Species Approach for Conserving Birds in Variegate...
 
The Relationship Between the Understory Shrub Component of Coastal Redwoods
The Relationship Between the Understory Shrub Component of Coastal RedwoodsThe Relationship Between the Understory Shrub Component of Coastal Redwoods
The Relationship Between the Understory Shrub Component of Coastal Redwoods
 
Junger and Duong Butterfly Report 2015
Junger and Duong Butterfly Report 2015Junger and Duong Butterfly Report 2015
Junger and Duong Butterfly Report 2015
 
Managed Grazing in Riparian Areas
Managed Grazing in Riparian AreasManaged Grazing in Riparian Areas
Managed Grazing in Riparian Areas
 
Managed Grazing in Riparian Areas
Managed Grazing in Riparian AreasManaged Grazing in Riparian Areas
Managed Grazing in Riparian Areas
 
South West Habitat Guidelines
South West Habitat GuidelinesSouth West Habitat Guidelines
South West Habitat Guidelines
 
Restoration, Reconciliation, and Reconnecting with Nature Nearby
Restoration, Reconciliation, and Reconnecting with Nature NearbyRestoration, Reconciliation, and Reconnecting with Nature Nearby
Restoration, Reconciliation, and Reconnecting with Nature Nearby
 
Theory To Practice Can We Manage Riparian Areas For More Than Big Trees
Theory To Practice  Can We Manage Riparian Areas For More Than Big TreesTheory To Practice  Can We Manage Riparian Areas For More Than Big Trees
Theory To Practice Can We Manage Riparian Areas For More Than Big Trees
 
Grant_Cait_FINAL
Grant_Cait_FINALGrant_Cait_FINAL
Grant_Cait_FINAL
 
Regrowth to Rainforest: Assessing the conservation values of Camphor Laurel
Regrowth to Rainforest: Assessing the conservation values of Camphor LaurelRegrowth to Rainforest: Assessing the conservation values of Camphor Laurel
Regrowth to Rainforest: Assessing the conservation values of Camphor Laurel
 
Spatial distribution and species abundance area of Non Timber Forest Products...
Spatial distribution and species abundance area of Non Timber Forest Products...Spatial distribution and species abundance area of Non Timber Forest Products...
Spatial distribution and species abundance area of Non Timber Forest Products...
 
Forest conservation in light of climate change
Forest conservation in light of climate changeForest conservation in light of climate change
Forest conservation in light of climate change
 
Grasslands slides
Grasslands slidesGrasslands slides
Grasslands slides
 
Komodo dragon assignment (2nd yr)
Komodo dragon assignment (2nd yr)Komodo dragon assignment (2nd yr)
Komodo dragon assignment (2nd yr)
 
Seedlings_ Substrate Preferences in a Minnesota Old Growth Thuja-
Seedlings_ Substrate Preferences in a Minnesota Old Growth Thuja-Seedlings_ Substrate Preferences in a Minnesota Old Growth Thuja-
Seedlings_ Substrate Preferences in a Minnesota Old Growth Thuja-
 
Losing Ground, Executive Summary
Losing Ground, Executive SummaryLosing Ground, Executive Summary
Losing Ground, Executive Summary
 
Capstone Project pgs 1-7
Capstone Project pgs 1-7Capstone Project pgs 1-7
Capstone Project pgs 1-7
 
Rangeland Degradation and Rehabilitation: Indigenous Ecological Knowledge and...
Rangeland Degradation and Rehabilitation: Indigenous Ecological Knowledge and...Rangeland Degradation and Rehabilitation: Indigenous Ecological Knowledge and...
Rangeland Degradation and Rehabilitation: Indigenous Ecological Knowledge and...
 
One stand at a time: Silvicultural options for stand-level response to clim...
One stand at a time: Silvicultural options  for stand-level response  to clim...One stand at a time: Silvicultural options  for stand-level response  to clim...
One stand at a time: Silvicultural options for stand-level response to clim...
 

More from KR Walters Consulting Services

SSAFR_2013_Walters_KR
SSAFR_2013_Walters_KRSSAFR_2013_Walters_KR
SSAFR_2013_Walters_KR
KR Walters Consulting Services
 
Operationalizing Analytics in Forestry
Operationalizing Analytics in ForestryOperationalizing Analytics in Forestry
Operationalizing Analytics in Forestry
KR Walters Consulting Services
 
SSAFR_2015_WaltersKR
SSAFR_2015_WaltersKRSSAFR_2015_WaltersKR
SSAFR_2015_WaltersKR
KR Walters Consulting Services
 
Barber Revisited: Aggregate Analysis in Harvest Scheduling Models
Barber Revisited: Aggregate Analysis in Harvest Scheduling ModelsBarber Revisited: Aggregate Analysis in Harvest Scheduling Models
Barber Revisited: Aggregate Analysis in Harvest Scheduling Models
KR Walters Consulting Services
 
Here’s how to decide between stumpage- or delivered price harvest scheduling ...
Here’s how to decide between stumpage- or delivered price harvest scheduling ...Here’s how to decide between stumpage- or delivered price harvest scheduling ...
Here’s how to decide between stumpage- or delivered price harvest scheduling ...
KR Walters Consulting Services
 
Subdivision of large uniform stands lacking natural bounding features
Subdivision of large uniform stands lacking natural bounding featuresSubdivision of large uniform stands lacking natural bounding features
Subdivision of large uniform stands lacking natural bounding features
KR Walters Consulting Services
 
Design and development of a generalized forest management modeling system: Wo...
Design and development of a generalized forest management modeling system: Wo...Design and development of a generalized forest management modeling system: Wo...
Design and development of a generalized forest management modeling system: Wo...
KR Walters Consulting Services
 
Spatial forest planning on industrial land: A problem in combinatorial optimi...
Spatial forest planning on industrial land: A problem in combinatorial optimi...Spatial forest planning on industrial land: A problem in combinatorial optimi...
Spatial forest planning on industrial land: A problem in combinatorial optimi...
KR Walters Consulting Services
 
An Empirical Evaluation of Spatial Restrictions in Industrial Harvest Schedul...
An Empirical Evaluation of Spatial Restrictions in Industrial Harvest Schedul...An Empirical Evaluation of Spatial Restrictions in Industrial Harvest Schedul...
An Empirical Evaluation of Spatial Restrictions in Industrial Harvest Schedul...
KR Walters Consulting Services
 
A Comparative Study Of Analytical Tools For Strategic & Tactical Forest Manag...
A Comparative Study Of Analytical Tools For Strategic & Tactical Forest Manag...A Comparative Study Of Analytical Tools For Strategic & Tactical Forest Manag...
A Comparative Study Of Analytical Tools For Strategic & Tactical Forest Manag...
KR Walters Consulting Services
 
Defining adjacency and proximity of forest stands for harvest blocking
Defining adjacency and proximity of forest stands for harvest blockingDefining adjacency and proximity of forest stands for harvest blocking
Defining adjacency and proximity of forest stands for harvest blocking
KR Walters Consulting Services
 
A system for solving spatial forest planning problems
A system for solving spatial forest planning problemsA system for solving spatial forest planning problems
A system for solving spatial forest planning problems
KR Walters Consulting Services
 
Harvest Scheduling and Policy Analysis
Harvest Scheduling and Policy AnalysisHarvest Scheduling and Policy Analysis
Harvest Scheduling and Policy Analysis
KR Walters Consulting Services
 
Barber Revisited: Aggregate Analysis in Harvest Schedule Models
Barber Revisited: Aggregate Analysis in Harvest Schedule ModelsBarber Revisited: Aggregate Analysis in Harvest Schedule Models
Barber Revisited: Aggregate Analysis in Harvest Schedule Models
KR Walters Consulting Services
 
National Forest Planning and NFMA Requirements
National Forest Planning and NFMA RequirementsNational Forest Planning and NFMA Requirements
National Forest Planning and NFMA Requirements
KR Walters Consulting Services
 
Forest Structure & Spatial Restrictions: Interactions & How They Affect Harve...
Forest Structure & Spatial Restrictions: Interactions & How They Affect Harve...Forest Structure & Spatial Restrictions: Interactions & How They Affect Harve...
Forest Structure & Spatial Restrictions: Interactions & How They Affect Harve...
KR Walters Consulting Services
 
Management of Timber Under A Habitat Conservation Plan in the Pacific Northwest
Management of Timber Under A Habitat Conservation Plan in the Pacific NorthwestManagement of Timber Under A Habitat Conservation Plan in the Pacific Northwest
Management of Timber Under A Habitat Conservation Plan in the Pacific Northwest
KR Walters Consulting Services
 
Error Propagation in Forest Planning Models
Error Propagation in Forest Planning ModelsError Propagation in Forest Planning Models
Error Propagation in Forest Planning Models
KR Walters Consulting Services
 

More from KR Walters Consulting Services (18)

SSAFR_2013_Walters_KR
SSAFR_2013_Walters_KRSSAFR_2013_Walters_KR
SSAFR_2013_Walters_KR
 
Operationalizing Analytics in Forestry
Operationalizing Analytics in ForestryOperationalizing Analytics in Forestry
Operationalizing Analytics in Forestry
 
SSAFR_2015_WaltersKR
SSAFR_2015_WaltersKRSSAFR_2015_WaltersKR
SSAFR_2015_WaltersKR
 
Barber Revisited: Aggregate Analysis in Harvest Scheduling Models
Barber Revisited: Aggregate Analysis in Harvest Scheduling ModelsBarber Revisited: Aggregate Analysis in Harvest Scheduling Models
Barber Revisited: Aggregate Analysis in Harvest Scheduling Models
 
Here’s how to decide between stumpage- or delivered price harvest scheduling ...
Here’s how to decide between stumpage- or delivered price harvest scheduling ...Here’s how to decide between stumpage- or delivered price harvest scheduling ...
Here’s how to decide between stumpage- or delivered price harvest scheduling ...
 
Subdivision of large uniform stands lacking natural bounding features
Subdivision of large uniform stands lacking natural bounding featuresSubdivision of large uniform stands lacking natural bounding features
Subdivision of large uniform stands lacking natural bounding features
 
Design and development of a generalized forest management modeling system: Wo...
Design and development of a generalized forest management modeling system: Wo...Design and development of a generalized forest management modeling system: Wo...
Design and development of a generalized forest management modeling system: Wo...
 
Spatial forest planning on industrial land: A problem in combinatorial optimi...
Spatial forest planning on industrial land: A problem in combinatorial optimi...Spatial forest planning on industrial land: A problem in combinatorial optimi...
Spatial forest planning on industrial land: A problem in combinatorial optimi...
 
An Empirical Evaluation of Spatial Restrictions in Industrial Harvest Schedul...
An Empirical Evaluation of Spatial Restrictions in Industrial Harvest Schedul...An Empirical Evaluation of Spatial Restrictions in Industrial Harvest Schedul...
An Empirical Evaluation of Spatial Restrictions in Industrial Harvest Schedul...
 
A Comparative Study Of Analytical Tools For Strategic & Tactical Forest Manag...
A Comparative Study Of Analytical Tools For Strategic & Tactical Forest Manag...A Comparative Study Of Analytical Tools For Strategic & Tactical Forest Manag...
A Comparative Study Of Analytical Tools For Strategic & Tactical Forest Manag...
 
Defining adjacency and proximity of forest stands for harvest blocking
Defining adjacency and proximity of forest stands for harvest blockingDefining adjacency and proximity of forest stands for harvest blocking
Defining adjacency and proximity of forest stands for harvest blocking
 
A system for solving spatial forest planning problems
A system for solving spatial forest planning problemsA system for solving spatial forest planning problems
A system for solving spatial forest planning problems
 
Harvest Scheduling and Policy Analysis
Harvest Scheduling and Policy AnalysisHarvest Scheduling and Policy Analysis
Harvest Scheduling and Policy Analysis
 
Barber Revisited: Aggregate Analysis in Harvest Schedule Models
Barber Revisited: Aggregate Analysis in Harvest Schedule ModelsBarber Revisited: Aggregate Analysis in Harvest Schedule Models
Barber Revisited: Aggregate Analysis in Harvest Schedule Models
 
National Forest Planning and NFMA Requirements
National Forest Planning and NFMA RequirementsNational Forest Planning and NFMA Requirements
National Forest Planning and NFMA Requirements
 
Forest Structure & Spatial Restrictions: Interactions & How They Affect Harve...
Forest Structure & Spatial Restrictions: Interactions & How They Affect Harve...Forest Structure & Spatial Restrictions: Interactions & How They Affect Harve...
Forest Structure & Spatial Restrictions: Interactions & How They Affect Harve...
 
Management of Timber Under A Habitat Conservation Plan in the Pacific Northwest
Management of Timber Under A Habitat Conservation Plan in the Pacific NorthwestManagement of Timber Under A Habitat Conservation Plan in the Pacific Northwest
Management of Timber Under A Habitat Conservation Plan in the Pacific Northwest
 
Error Propagation in Forest Planning Models
Error Propagation in Forest Planning ModelsError Propagation in Forest Planning Models
Error Propagation in Forest Planning Models
 

Recently uploaded

Zodiac Signs and Food Preferences_ What Your Sign Says About Your Taste
Zodiac Signs and Food Preferences_ What Your Sign Says About Your TasteZodiac Signs and Food Preferences_ What Your Sign Says About Your Taste
Zodiac Signs and Food Preferences_ What Your Sign Says About Your Taste
my Pandit
 
Digital Marketing with a Focus on Sustainability
Digital Marketing with a Focus on SustainabilityDigital Marketing with a Focus on Sustainability
Digital Marketing with a Focus on Sustainability
sssourabhsharma
 
Creative Web Design Company in Singapore
Creative Web Design Company in SingaporeCreative Web Design Company in Singapore
Creative Web Design Company in Singapore
techboxsqauremedia
 
How to Implement a Real Estate CRM Software
How to Implement a Real Estate CRM SoftwareHow to Implement a Real Estate CRM Software
How to Implement a Real Estate CRM Software
SalesTown
 
How MJ Global Leads the Packaging Industry.pdf
How MJ Global Leads the Packaging Industry.pdfHow MJ Global Leads the Packaging Industry.pdf
How MJ Global Leads the Packaging Industry.pdf
MJ Global
 
The Genesis of BriansClub.cm Famous Dark WEb Platform
The Genesis of BriansClub.cm Famous Dark WEb PlatformThe Genesis of BriansClub.cm Famous Dark WEb Platform
The Genesis of BriansClub.cm Famous Dark WEb Platform
SabaaSudozai
 
Lundin Gold Corporate Presentation - June 2024
Lundin Gold Corporate Presentation - June 2024Lundin Gold Corporate Presentation - June 2024
Lundin Gold Corporate Presentation - June 2024
Adnet Communications
 
Digital Transformation Frameworks: Driving Digital Excellence
Digital Transformation Frameworks: Driving Digital ExcellenceDigital Transformation Frameworks: Driving Digital Excellence
Digital Transformation Frameworks: Driving Digital Excellence
Operational Excellence Consulting
 
Top mailing list providers in the USA.pptx
Top mailing list providers in the USA.pptxTop mailing list providers in the USA.pptx
Top mailing list providers in the USA.pptx
JeremyPeirce1
 
The APCO Geopolitical Radar - Q3 2024 The Global Operating Environment for Bu...
The APCO Geopolitical Radar - Q3 2024 The Global Operating Environment for Bu...The APCO Geopolitical Radar - Q3 2024 The Global Operating Environment for Bu...
The APCO Geopolitical Radar - Q3 2024 The Global Operating Environment for Bu...
APCO
 
Industrial Tech SW: Category Renewal and Creation
Industrial Tech SW:  Category Renewal and CreationIndustrial Tech SW:  Category Renewal and Creation
Industrial Tech SW: Category Renewal and Creation
Christian Dahlen
 
Income Tax exemption for Start up : Section 80 IAC
Income Tax  exemption for Start up : Section 80 IACIncome Tax  exemption for Start up : Section 80 IAC
Income Tax exemption for Start up : Section 80 IAC
CA Dr. Prithvi Ranjan Parhi
 
Call 8867766396 Satta Matka Dpboss Matka Guessing Satta batta Matka 420 Satta...
Call 8867766396 Satta Matka Dpboss Matka Guessing Satta batta Matka 420 Satta...Call 8867766396 Satta Matka Dpboss Matka Guessing Satta batta Matka 420 Satta...
Call 8867766396 Satta Matka Dpboss Matka Guessing Satta batta Matka 420 Satta...
bosssp10
 
BeMetals Investor Presentation_June 1, 2024.pdf
BeMetals Investor Presentation_June 1, 2024.pdfBeMetals Investor Presentation_June 1, 2024.pdf
BeMetals Investor Presentation_June 1, 2024.pdf
DerekIwanaka1
 
How to Implement a Strategy: Transform Your Strategy with BSC Designer's Comp...
How to Implement a Strategy: Transform Your Strategy with BSC Designer's Comp...How to Implement a Strategy: Transform Your Strategy with BSC Designer's Comp...
How to Implement a Strategy: Transform Your Strategy with BSC Designer's Comp...
Aleksey Savkin
 
Event Report - SAP Sapphire 2024 Orlando - lots of innovation and old challenges
Event Report - SAP Sapphire 2024 Orlando - lots of innovation and old challengesEvent Report - SAP Sapphire 2024 Orlando - lots of innovation and old challenges
Event Report - SAP Sapphire 2024 Orlando - lots of innovation and old challenges
Holger Mueller
 
Mastering B2B Payments Webinar from BlueSnap
Mastering B2B Payments Webinar from BlueSnapMastering B2B Payments Webinar from BlueSnap
Mastering B2B Payments Webinar from BlueSnap
Norma Mushkat Gaffin
 
Part 2 Deep Dive: Navigating the 2024 Slowdown
Part 2 Deep Dive: Navigating the 2024 SlowdownPart 2 Deep Dive: Navigating the 2024 Slowdown
Part 2 Deep Dive: Navigating the 2024 Slowdown
jeffkluth1
 
Best Forex Brokers Comparison in INDIA 2024
Best Forex Brokers Comparison in INDIA 2024Best Forex Brokers Comparison in INDIA 2024
Best Forex Brokers Comparison in INDIA 2024
Top Forex Brokers Review
 
Organizational Change Leadership Agile Tour Geneve 2024
Organizational Change Leadership Agile Tour Geneve 2024Organizational Change Leadership Agile Tour Geneve 2024
Organizational Change Leadership Agile Tour Geneve 2024
Kirill Klimov
 

Recently uploaded (20)

Zodiac Signs and Food Preferences_ What Your Sign Says About Your Taste
Zodiac Signs and Food Preferences_ What Your Sign Says About Your TasteZodiac Signs and Food Preferences_ What Your Sign Says About Your Taste
Zodiac Signs and Food Preferences_ What Your Sign Says About Your Taste
 
Digital Marketing with a Focus on Sustainability
Digital Marketing with a Focus on SustainabilityDigital Marketing with a Focus on Sustainability
Digital Marketing with a Focus on Sustainability
 
Creative Web Design Company in Singapore
Creative Web Design Company in SingaporeCreative Web Design Company in Singapore
Creative Web Design Company in Singapore
 
How to Implement a Real Estate CRM Software
How to Implement a Real Estate CRM SoftwareHow to Implement a Real Estate CRM Software
How to Implement a Real Estate CRM Software
 
How MJ Global Leads the Packaging Industry.pdf
How MJ Global Leads the Packaging Industry.pdfHow MJ Global Leads the Packaging Industry.pdf
How MJ Global Leads the Packaging Industry.pdf
 
The Genesis of BriansClub.cm Famous Dark WEb Platform
The Genesis of BriansClub.cm Famous Dark WEb PlatformThe Genesis of BriansClub.cm Famous Dark WEb Platform
The Genesis of BriansClub.cm Famous Dark WEb Platform
 
Lundin Gold Corporate Presentation - June 2024
Lundin Gold Corporate Presentation - June 2024Lundin Gold Corporate Presentation - June 2024
Lundin Gold Corporate Presentation - June 2024
 
Digital Transformation Frameworks: Driving Digital Excellence
Digital Transformation Frameworks: Driving Digital ExcellenceDigital Transformation Frameworks: Driving Digital Excellence
Digital Transformation Frameworks: Driving Digital Excellence
 
Top mailing list providers in the USA.pptx
Top mailing list providers in the USA.pptxTop mailing list providers in the USA.pptx
Top mailing list providers in the USA.pptx
 
The APCO Geopolitical Radar - Q3 2024 The Global Operating Environment for Bu...
The APCO Geopolitical Radar - Q3 2024 The Global Operating Environment for Bu...The APCO Geopolitical Radar - Q3 2024 The Global Operating Environment for Bu...
The APCO Geopolitical Radar - Q3 2024 The Global Operating Environment for Bu...
 
Industrial Tech SW: Category Renewal and Creation
Industrial Tech SW:  Category Renewal and CreationIndustrial Tech SW:  Category Renewal and Creation
Industrial Tech SW: Category Renewal and Creation
 
Income Tax exemption for Start up : Section 80 IAC
Income Tax  exemption for Start up : Section 80 IACIncome Tax  exemption for Start up : Section 80 IAC
Income Tax exemption for Start up : Section 80 IAC
 
Call 8867766396 Satta Matka Dpboss Matka Guessing Satta batta Matka 420 Satta...
Call 8867766396 Satta Matka Dpboss Matka Guessing Satta batta Matka 420 Satta...Call 8867766396 Satta Matka Dpboss Matka Guessing Satta batta Matka 420 Satta...
Call 8867766396 Satta Matka Dpboss Matka Guessing Satta batta Matka 420 Satta...
 
BeMetals Investor Presentation_June 1, 2024.pdf
BeMetals Investor Presentation_June 1, 2024.pdfBeMetals Investor Presentation_June 1, 2024.pdf
BeMetals Investor Presentation_June 1, 2024.pdf
 
How to Implement a Strategy: Transform Your Strategy with BSC Designer's Comp...
How to Implement a Strategy: Transform Your Strategy with BSC Designer's Comp...How to Implement a Strategy: Transform Your Strategy with BSC Designer's Comp...
How to Implement a Strategy: Transform Your Strategy with BSC Designer's Comp...
 
Event Report - SAP Sapphire 2024 Orlando - lots of innovation and old challenges
Event Report - SAP Sapphire 2024 Orlando - lots of innovation and old challengesEvent Report - SAP Sapphire 2024 Orlando - lots of innovation and old challenges
Event Report - SAP Sapphire 2024 Orlando - lots of innovation and old challenges
 
Mastering B2B Payments Webinar from BlueSnap
Mastering B2B Payments Webinar from BlueSnapMastering B2B Payments Webinar from BlueSnap
Mastering B2B Payments Webinar from BlueSnap
 
Part 2 Deep Dive: Navigating the 2024 Slowdown
Part 2 Deep Dive: Navigating the 2024 SlowdownPart 2 Deep Dive: Navigating the 2024 Slowdown
Part 2 Deep Dive: Navigating the 2024 Slowdown
 
Best Forex Brokers Comparison in INDIA 2024
Best Forex Brokers Comparison in INDIA 2024Best Forex Brokers Comparison in INDIA 2024
Best Forex Brokers Comparison in INDIA 2024
 
Organizational Change Leadership Agile Tour Geneve 2024
Organizational Change Leadership Agile Tour Geneve 2024Organizational Change Leadership Agile Tour Geneve 2024
Organizational Change Leadership Agile Tour Geneve 2024
 

Management of timber under a habitat conservation plan (HCP) in the Pacific Northwest

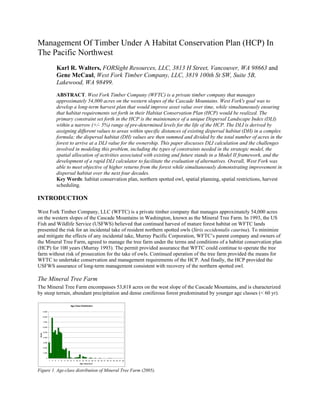
  • 1. Management Of Timber Under A Habitat Conservation Plan (HCP) In The Pacific Northwest Karl R. Walters, FORSight Resources, LLC, 3813 H Street, Vancouver, WA 98663 and Gene McCaul, West Fork Timber Company, LLC, 3819 100th St SW, Suite 5B, Lakewood, WA 98499. ABSTRACT. West Fork Timber Company (WFTC) is a private timber company that manages approximately 54,000 acres on the western slopes of the Cascade Mountains. West Fork's goal was to develop a long-term harvest plan that would improve asset value over time, while simultaneously ensuring that habitat requirements set forth in their Habitat Conservation Plan (HCP) would be realized. The primary constraint set forth in the HCP is the maintenance of a unique Dispersal Landscape Index (DLI) within a narrow (+/- 5%) range of pre-determined levels for the life of the HCP. The DLI is derived by assigning different values to areas within specific distances of existing dispersal habitat (DH) in a complex formula; the dispersal habitat (DH) values are then summed and divided by the total number of acres in the forest to arrive at a DLI value for the ownership. This paper discusses DLI calculation and the challenges involved in modeling this problem, including the types of constraints needed in the strategic model, the spatial allocation of activities associated with existing and future stands in a Model II framework, and the development of a rapid DLI calculator to facilitate the evaluation of alternatives. Overall, West Fork was able to meet objective of higher returns from the forest while simultaneously demonstrating improvement in dispersal habitat over the next four decades. Key Words: habitat conservation plan, northern spotted owl, spatial planning, spatial restrictions, harvest scheduling. INTRODUCTION West Fork Timber Company, LLC (WFTC) is a private timber company that manages approximately 54,000 acres on the western slopes of the Cascade Mountains in Washington, known as the Mineral Tree Farm. In 1993, the US Fish and Wildlife Service (USFWS) believed that continued harvest of mature forest habitat on WFTC lands presented the risk for an incidental take of resident northern spotted owls (Strix occidentalis caurina). To minimize and mitigate the effects of any incidental take, Murray Pacific Corporation, WFTC’s parent company and owners of the Mineral Tree Farm, agreed to manage the tree farm under the terms and conditions of a habitat conservation plan (HCP) for 100 years (Murray 1993). The permit provided assurance that WFTC could continue to operate the tree farm without risk of prosecution for the take of owls. Continued operation of the tree farm provided the means for WFTC to undertake conservation and management requirements of the HCP. And finally, the HCP provided the USFWS assurance of long-term management consistent with recovery of the northern spotted owl. The Mineral Tree Farm The Mineral Tree Farm encompasses 53,818 acres on the west slope of the Cascade Mountains, and is characterized by steep terrain, abundant precipitation and dense coniferous forest predominated by younger age classes (< 60 yr). Age Class Distribution 9,000 8,000 7,000 6,000 5,000 Acres 4,000 3,000 2,000 1,000 0 1 3 5 7 9 11 13 15 17 19 21 23 25 27 29 31 33 35 37 39 41 43 45 47 49 Age Class (5 yr) Figure 1. Age-class distribution of Mineral Tree Farm (2005).
  • 2. Virtually all of the tree farm has been managed for commercial timber production, and most of it has been clearcut or partially harvested at least once since 1913. Extensive logging also occurred in the mid to late 1980s with a significant curtailment in the mid to late 1990s. Figure 2. Forest cover and extent of the Mineral Tree Farm (2005). Figure 3. Spatial distribution of age classes across the Mineral Tree Farm (2005). The tree farm is surrounded by private, state and federal timberlands. The private and state timberlands are managed for commercial timber production much like the tree farm, but the federal lands of the Gifford Pinchot National Forest that border the Mineral Tree Farm to the east and west are largely managed as late-successional reserves with the objective of maintaining mature and old-growth forest.
  • 3. Dispersal Habitat Dispersal has been defined as the movement an animal makes from its point of origin to the place where it reproduces or would have reproduced if it had survived and found a mate (Howard 1960). It is distinguished from movements made by individual animals within home ranges or seasonal migrations made between summer and winter habitats. Juvenile dispersal best fits the definition of innate dispersal (Howard 1960), which is a spontaneous, random movement related more to genetics than proximal environmental conditions. Juvenile spotted owls initiate dispersal in September and October of their first year (Allen and Brewer 1985, Herter 1992). Dispersal is rapid at first, but is interrupted by a period of “settling” in the winter. Both Gutierrez et al (1985) and Miller (1989) reported active and settled phases to dispersal. Juveniles that died during the settled phase had considerably smaller ranges than those that survived and re-initiated dispersal (Miller 1989). The total straight-line distance between the nest and the final point of detection (which represented the location of death for many juvenile owls) has been reported to be more than 30 miles in some cases in Washington (Allen and Brewer 1985). Miller (1989) noted that owls that survived until their second year had a mean straight-line dispersal distance of only 9.4 miles, which may indicate that first-year survival depends on how quickly an owl locates suitable, vacant habitat in which to settle. While dispersal appears to move randomly across a landscape, the spotted owl tends to show preference for roosting in older stands. Although owls were observed roosting in a variety of habitats, Miller (1989) noted that mature and old-growth forest were used disproportionately to their availability, closed sapling pole/sawtimber habitat 1 was used roughly in proportion to availability, and younger forest types were avoided. From a management perspective, the goal of an HCP should be to provide suitable roosting and foraging habitat in such a manner that an owl moving randomly across a landscape is more likely to encounter suitable habitat than unsuitable habitat. Thus, it is imperative that suitable habitat not be confined to a few concentrated areas and corridors but scattered over the landscape. HCP Rationale Based on the scientific literature and recommendations of the Interagency Scientific Committee Report (Thomas et al. 1990), it was decided that the Mineral Tree Farm would be managed to provide dispersal habitat and contribute to the maintenance of a general landscape amenable to the dispersal of juvenile spotted owls. The shape of the tree farm and its proximity to other habitat conservation areas (HCAs) nearby would allow dispersal habitat on the ownership to function as a link connecting them. Habitat management on the tree farm was to focus on three main areas: protection of water quality and fish habitat, growth and maintenance of mature forest habitat in designated reserve areas (primarily along streams), and enhancement of wildlife habitats in managed commercial stands across the tree farm. WFTC’s contributions to habitat management complement the efforts on adjacent public lands, by interconnecting late-successional habitat on adjacent federal lands through the habitat reserves across the tree farm, and by providing habitat for early and mid-successional species elsewhere. Protection of streamside areas along fish- bearing streams and reduction in sediment delivery to streams also figured prominently in the HCP. The most important element of the HCP, however, was management of the commercial timberlands. Historically, WFTC harvested timber at an economic rotation age of 40 to 60 years. Under the HCP, this management prescription is still permitted in areas where it does not conflict with the maintenance of dispersal habitat. The management of stands between harvests and the size and timing of harvests were modified from previous standard practices when necessary to create a landscape conducive to dispersal including, 1. avoidance of large areas of very young forest (gaps in dispersal landscape), 2. reducing the time stands exist in early successional conditions, 3. thinning stands to hasten development of suitable habitat conditions and, 4. retaining logs and snags after harvest to increase habitat diversity for owl prey. 1 Defined as coniferous forest with average stand dbh between 1 and 21 inches and canopy closure exceeding 60% (Hall et al. 1985). In all likelihood, owls select for stands of larger trees and against those of smaller trees.
  • 4. Like any natural landscape, the Mineral Tree Farm is a complex mosaic of physical and biological conditions. Management of such a mosaic over time is a dynamic and iterative process that cannot be done according to a rigid set of rules established at a single point in time. Instead, progress toward and achievement of a dispersal landscape would be monitored over time, allowing for deviations from guidelines on individual harvest units, so long as those deviations fit within the overall landscape objectives. Dispersal Landscape Index The spatial arrangement of stands is just as important as the total area of forest in determining habitat for dispersing spotted owls. To evaluate and monitor dispersal habitat (DH) at the landscape level, a numerical index was developed called the dispersal landscape index (DLI). To calculate DLI, all areas within the Mineral Tree Farm were assigned a dispersal habitat value (DHV) value based on their proximity to stands of suitable DH. As originally developed, the process for calculating DH values involved the creation of a series of concentric buffers around stands of suitable habitat and assigning progressively lower values to buffers more distant. Figure 4. Defining dispersal habitat values for 3 suitable stands. In Figure 4, there are 3 stands that are deemed suitable dispersal habitat for spotted owls. Interior portions of stands meeting the definition of roosting and foraging habitat (beyond 200 ft from a clearcut edge) are assigned the highest DHV of 10, and edge areas within the stand are assigned a DHV of 8. Beyond the stand boundary, forest areas that are within ⅛ mi of the stand boundary are assigned a DHV of 7; within buffers of ¼ mi, ½ mi, ¾ mi, DHVs of 5, 3 and 1 are assigned, respectively. Forest areas greater than ¾ mi from suitable dispersal habitat are deemed to have no dispersal habitat value. Once DHVs have been calculated for every acre of the forest, the DLI is calculated simply by summing DHVs for each acre in the forest, and dividing the total by the total number of acres. For example, if the total DHV for the Mineral Tree Farm was calculated to be 240,000, the DLI score would be 4.59. The net effect of the scoring is to give higher DLI values to landscapes with greater dispersal habitat and more uniform distribution of that habitat. Forests with comparable acres of dispersal habitat can have very different DLI scores: clumping of the habitat does not increase scores of the stands since interior portions are already at the maximum DHV, and if the habitat is clumped there are necessarily greater amounts of gap in the landscape. A DLI value of 10 would place the entire tree farm in dispersal habitat, but no harvesting could take place without increasing gap areas. Therefore, to make the tree farm economically sustainable, it was determined that the optimum configuration of stands within a landscape managed for timber production and owl dispersal be composed of stands 5 to 120 acres in size (with an optimum size of 40 acres) spaced no more than ¼ mile apart, which yields a DLI of
  • 5. 7.50. At the time the HCP was signed, the Mineral Tree Farm DLI was 5.34, and the projected DLI after the first 50 years implementation of the HCP was 7.47, after which it was to remain at or above this value. WFTC developed a geographic information system database for tracking stand conditions and a model for predicting dispersal habitat (DH). Future dispersal habitat was initially estimated by modeling the growth of existing stands using the Stand Projection System (SPS) growth and yield model (Arney 1986) for the first 50 years of the HCP. All stands then considered suitable were considered to remain suitable unless harvested. Stands that were not considered suitable initially would become suitable when they attained an average dbh of 9.2 inches and a minimum age of 27 to 53 years, depending on site class. This was considered a conservative estimate because many stands would meet the DH criteria before they reached an average dbh of 9.2 inches, but it was used as a limit to avoid the risk of assuming a stand being deemed DH before it actually qualified as such. By projecting stands forward through time, and estimating harvests based on guidelines established in the HCP, WFTC was able to predict how the forest would develop, and calculate DLI for the Mineral Tree Farm for the next 50 years. Trend for Dispersal Landscape Index for Mineral Tree Farm 8 7.5 Dispersal Landscape Index (DLI) 7 6.5 6 5.5 5 1988 1993 1998 2003 2008 2013 2018 2023 2028 2033 2038 2043 2048 Year Figure 5. DLI trend for the Mineral Tree Farm for implementation of HCP for 50 years. WFTC operated the tree farm for over 10 years under the HCP, using periodic re-projections of the existing inventory (as described) to demonstrate continued improvement in dispersal habitat and dispersal landscape index scores, while continuing to harvest timber. However, the timber markets in the Pacific Northwest had changed significantly in the ten years that had passed since the HCP was signed. WFTC management was interested in exploring optimization and spatial planning tools to see if the economic returns from the Mineral Tree Farm could be simultaneously improved along with dispersal habitat. FORSight Resources, LLC (FORSight) was contracted in 2005 to develop a strategic forest management model and spatial harvest schedule for the Mineral Tree Farm. Strategic Model FORSight chose the Remsoft Spatial Planning Suite as the modeling environment for this project, with Spatial Woodstock as the strategic modeling environment and Stanley as the tactical planning tool. WFTC management had numerous objectives that required the development of a fairly sophisticated strategic planning model. The mountainous conditions on the tree farm make stand elevation and logging season important considerations in running a profitable logging operation and cost-effective silviculture program. The mix of steep terrain and valley floors require controls on logging method to balance operations assigned to shovel, hi-lead and helicopter logging. The goal of maintaining and improving dispersal habitat across the forest necessitated the inclusion of existing
  • 6. suitable-habitat stands, watersheds, reserve areas, and management emphasis in the overall stratification. A tree- based growth and yield model (Organon-SMC variant) was used to develop yield tables, based on cover type, basal area, site and stocking/planting density. Overall, WFTC’s strategic planning model required 13 landscape themes to fully describe the forest land base. A planning horizon of 150 years, composed of 5-year planning periods was chosen to match the resolution of the growth and yield model, and to provide sufficient time to avoid model artifacts within the first 10 planning periods that are attributable to the effects of the end of the planning horizon. The silvicultural program implemented in the model included planting (2 species – Douglas-fir and noble fir, 2 planting densities each), precommercial thinning to 4 different spacings, fertilization and herbaceous competition control, commercial thinning, pruning and clearcut harvesting. Pruning and precommercial thinning to four spacings are not typical for commercial timberlands and many would question their economic value to timber production. In direct terms, these treatments generally do not improve volume or value growth sufficiently to warrant the expenditure, but WFTC was interested to know if these treatments would pay indirectly by developing suitable foraging and roosting habitat sooner in younger stands. Objective function The objective function used for the strategic planning model maximized discounted revenue from timber harvesting, net of silviculture, logging and hauling costs. Instead of a pure-stumpage model, WFTC opted for a coarse-level delivered price model using mill-delivered prices, average hauling costs, and sophisticated logging cost functions for each logging method that varied by stand volume. Skyline-Helicoptor - $/MBF Logging Costs $2,500.00 $2,000.00 $1,500.00 $/MBF $1,000.00 $500.00 $- 5 10 15 20 25 30 35 40 45 50 55 60 F&B $150.00 $75.00 $50.00 $37.50 $30.00 $25.00 $21.40 $18.80 $16.70 $15.00 $13.60 $12.50 Y&L $2,000.0 $1,000.0 $666.70 $500.00 $400.00 $333.30 $285.70 $250.00 $222.20 $200.00 $181.80 $166.70 Total $2,150.0 $1,075.0 $716.70 $537.50 $430.00 $358.30 $307.10 $268.80 $238.90 $215.00 $195.40 $179.20 Low Vol $1,004.0 $860.50 $717.00 $573.50 $430.00 Med Vol $430.00 $376.25 $322.50 $268.75 Hi Vol $268.80 $246.40 $224.00 $201.60 $179.20 MBF/Acre F&B Y&L Total Low Vol Med Vol Hi Vol Figure 6. Skyline and helicopter logging cost function for Mineral Tree Farm (2005). Constraints WFTC management had specific objectives for improving economic efficiency. Based on their previous projections (described earlier), they believed that they had reasonable estimates of annual harvest volumes that could be achievable under the HCP. What they were lacking were controls on harvest volume flows, not only from year-to- year, but on a quarterly basis. Given the mix of logging equipment available in the area, it was important for WFTC to schedule a mix of flat and steep-terrain, as well as summer versus winter harvest blocks. Constraints were included that required the number of acres assigned to shovel logging be greater than or equal to the acres assigned to the more expensive helicopter logging operations. Total saw log harvests were allowed to vary by as much as 10% period-to period, provided that harvest volumes never fell below harvest goals established with WFTC’s previous projection methods.
  • 7. Because the calculation of DLI is complex and inherently non-linear, it was impossible to directly constrain it in the strategic model. WFTC used stand age and a projected time to reach a DBH of 9.2 as a proxy for estimating time to reach DH status. FORSight decided to try to model DH directly by tracking several stand parameters in the growth and yield projections. Considerations in the determination of DH status are: • Species. A stand must be dominated by conifer species. • Density. A stand must have fewer than 300 trees/ac and basal area of at least 70 ft2/ac in trees greater than 10” DBH. • At least 20’ of clear flying space must be available. The last requirement is difficult to model directly but we decided to include as a yield component in the model a proxy: average height to crown base (AVHCB) - the space between the ground and lowest branches of the live crown. The calculation of AVHCB depends not only on height growth but crown recession as well. Clear flying space would also depend on how quickly trees shed dead limbs. Using WFTC’s experience with monitoring dispersal habitat, an empirical relationship was developed by calculating the AVHCB for stands that already qualify as DH. Within the strategic planning model, acres are counted as DH if they meet the species and density requirements and exceed a threshold value for AVHCB. The higher the threshold, the longer it takes to achieve DH status. The threshold values of AVHCB that best matched the empirical data were 35 ft for unthinned stands, 30 ft for thinned stands and 25’ for pruned stands. Once DH acres could be calculated in the model, it was easy to formulate floor constraints on acres of dispersal habitat that corresponded to the acres specified in the HCP. Tactical Model FORSight used Spatial Woodstock and Stanley in concert to block out the first 40 years of the planning horizon (8 five-year periods) that corresponded to the time remaining in the HCP to reach a maximum DLI. The process was complicated by the need to control both activity-generated outputs (harvest volumes) and inventory outputs (DH), and the need to spatially allocate activities on future stands. At that time, Stanley was not able to control for inventory-based outputs, or spatially allocate activities beyond the final harvest. To get around this limitation, FORSight developed an iterative rollover process of spatial allocation, until all 8 periods of the tactical planning horizon were completed. A spatial simulation (Remsoft's term for allocating activities without spatial restrictions) mapped out most treatments well. Blocking final harvests worked so long as only stands that currently existed were harvested, because the thematic attributes matched what was in the shapefile. Once a stand was thinned or pruned or fertilized, its thematic attributes in Woodstock no longer matched the theme fields in the shapefile. The rollover process involved the following steps: 1. Run Stanley to allocate initial harvest blocks (Schedule file attributes match shapefile). Post activities to Treatments field. 2. Use the Assign Schedule to Polygons feature to spatially allocate the mid-rotation treatments (Append to Treatments field). 3. Use the time selector to advance one period. 4. Copy virtual thematic attributes to temporary fields 5. Use time selector to revert to the previous period and copy thematic attributes from temporary fields to theme fields. 6. Repeat process iteratively until all periods are adequately allocated. Once the activities were spatially allocated, thematic maps indicating the location of suitable DH stands had to be produced for each of the tactical planning periods for DLI calculation. A sequence file was also generated so that reports of the tactical harvest schedule could be produced by running the tactical harvest schedule back through Woodstock.
  • 8. Updated DLI calculation The original process of calculating DLI using a GIS to generate iterative buffers was too slow and cumbersome for this process. Instead, a raster-based method using ESRI software was developed by FORSight to process vectorized versions of the maps produced after spatial allocation. A pixel size of 220 feet was chosen because all of the DLI buffer distances were integer multiples except one: the interior space of a suitable stand would be slightly underestimated because the required edge buffer needed to only be 200 feet. Since this would yield a conservative estimate of DLI, it was deemed acceptable. In minutes, the new DLI calculator was able to process 9 DH maps and produce DLI scores corresponding to the end of each planning period plus initial conditions. The process of generating DH maps required Spatial Woodstock’s time selector to project future conditions. A thematic map was created based on the inventory output DH. After the treatments from the Stanley allocation were posted to the Treatments field, it was easy to use the time selector to generate maps of DH condition for current and future planning periods. A shapefile was exported for each time period of interest, and these in turn were converted to a raster format using ESRI’s ArcGIS software. Once rasterized, the DLI calculation was performed for each mapped time step. Results In total, 12 runs of the strategic model were completed before a preferred alternative was selected. Because this was the first time WFTC had used an optimization approach, it was important to see the effects of the various constraints on the objective function (present net value). The first model run was completely unconstrained to serve as a benchmark for later runs and additional constraints. Over the course of the analysis, some constraints were eliminated; for example, the constraints on harvest season made a difference of only a few thousand dollars over the entire planning horizon, and WFTC management considered the benefit to be minimal. The constraints on minimal dispersal habitat were tightened in the strategic model by 2.5% in each period to facilitate tactical planning: since there is usually some fall-down in output levels from the strategic plan in a Stanley solution, requiring more DH than the minimum in the strategic solution would allow a fall-down in the tactical solution that still met requirements of the HCP. Under the HCP, WFTC is restricted to clearcut no more than 10,000 acres per decade and no more than 2,500 acres in any given year. Since the planning model uses 5 year periods, it was decided to constrain using the more restrictive limit (1,000 ac per year), requiring no more than 5,000 acres of clear cut harvesting in any planning period. Strategic results One of the motivations for WFTC to explore optimization in their planning was to determine if it was possible to increase harvest levels while continuing to comply with the requirements of the HCP. The strategic model demonstrated that increased harvest levels were indeed possible in the final preferred alternative. In the first three planning periods, total saw log harvests exceeded WFTC’s previous volume goals by at least 47% and as much as 62%. The source of this additional harvest volume was attributed to the harvest of existing DH stands, which could be harvested sooner through a form of allowable cut effect. Allowable cut effects are usually attributable to non-declining flow constraints and improved growth of future stands, such that an immediate increase in harvest can be attained. In the case of the Mineral Tree Farm model, it was not a change in volume growth that allowed the increased harvest, but a shortening of the time to DH through silviculture (thinning and pruning). WFTC management was surprised by the extent of pruning selected in the optimal solution but quickly realized how the model was trading off the additional expense of silviculture against the holding cost of retaining existing DH stands longer in the future. By producing suitable DH stands at a younger age through silviculture, the model demonstrated how it was possible to shorten overall timber rotations and thus improve economic returns from the tree farm. Tactical results While the results of the strategic modeling exercise were exciting, there was no guarantee that similar benefits would accrue once the solution was allocated spatially. WFTC was interested in a spatial solution for the first 40 years of the planning horizon, but to give Stanley some extra flexibility in choosing candidate stands FORSight
  • 9. decided to schedule the first 10 planning periods with Stanley. And though the objective function in the Woodstock model maximized discounted net revenue, it seemed more prudent to set harvest volume and acre outputs as the objectives for the Stanley runs. Six Woodstock outputs were chosen as the weighted scoring criteria: total saw log harvest volume (weight = 2.0), Douglas-fir saw log volume (weight = 1.5), white wood saw log volume (weight = 1.5), clearcut acres (weight = 1.25), hi-lead logging acres (weight = 1.0) and shovel logging acres (weight = 1.0). The results were remarkably good for a heavily constrained harvest schedule. Relative to the minimum volume goals specified as constraints for the first 10 periods, the Stanley tactical solution generated 14% more volume over the first 10 periods, using a Woodstock solution that was 21% higher than the minimum targets. The tactical solution attained 93% of the present net value predicted in the strategic planning model. Harvest Volume Comparison by Period 180 160 140 Volume (MMBF) 120 100 80 60 40 20 0 1 2 3 4 5 6 7 8 9 10 Planning Period Stanley Woodstock Goal Figure 7. Projected harvest levels in Stanley and Woodstock solutions relative to WFTC goals. Figure 7 indicates illustrates that planning periods 3, 7 and 8 are more adversely affected by spatial constraints, exhibiting significant reductions from the predicted volumes in the corresponding Woodstock solution. Only in the latter periods does the Stanley result fall below the goal values established by WFTC in earlier analyses, and the shortfalls are minor. There is also remarkably close correspondence between the Woodstock and Stanley solutions in terms of acres allocated to mid-rotation silviculture and final harvests. No timing choice deviations on the mid-rotation silvicultural treatments and only minimal deviations on the timing of harvests (clearcuts, commercial thins) were allowed, to facilitate the roll-over process described earlier. In early periods, it is trivial to allocate mid-rotation silvicultural treatments because the treated stands already exist. In later periods, where a mid-rotation treatment is applied to a stand that does not yet exist (it was final harvested earlier), it becomes more problematic since the final harvest in the Stanley solution that led to its creation may have deviated from the Woodstock solution. This issue could probably be overcome by iteratively going back and forth to the Woodstock model, each time including more pre- allocated treatment decisions from the previous Stanley solution. However, the time and effort required would be substantial but would not yield significantly improved results.
  • 10. Commercial Thinning Activity Pruning Activity 400 2,500 350 2,000 300 250 1,500 Acres Acres 200 1,000 150 100 500 50 0 0 1 2 3 4 5 6 7 8 9 10 1 2 3 4 5 6 7 8 9 10 Planning Period Planning Period Stanley Woodstock Stanley Woodstock PCT Activity Final Harvest Activity 4000 6,000 3500 5,000 3000 4,000 2500 Acres Acres 2000 3,000 1500 2,000 1000 500 1,000 0 0 1 2 3 4 5 6 7 8 9 10 1 2 3 4 5 6 7 8 9 10 Planning Period Planning Period Stanley Woodstock Stanley Woodstock Figure 8. Acres allocated in the tactical solution relative to the strategic planning model solution. The final hurdles to declaring success in this planning effort were to demonstrate that dispersal habitat acres and DLI scores for the Mineral Tree Farm conformed to the requirements of the HCP. For DH acres, the tactical solution could not allow DH acres to fall below the minimum acres specified in the HCP. For DLI scores, a margin of error of ±5% around the values specified in the HCP are permitted. Dispersal Habitat Production vs. Goal 30,000 25,000 20,000 Acres of DH 15,000 10,000 5,000 0 1 2 3 4 5 6 7 8 9 10 Planning Period Stanley Woodstock Goal Figure 9. Projected dispersal habitat and DLI scores. Because dispersal habitat was an inventory measure in the strategic model and could not be directly controlled in Stanley, there was concern that DH acres may have varied too greatly in the tactical solution. Luckily, this was not the case but the model was constructed to allow constraints on activities at the watershed level. If necessary, harvests could have been concentrated in watersheds or dispersed across watersheds to bring the DLI scores closer to desired levels. In both cases, the tactical solution met or exceeded the requirements of the HCP. Moreover, the
  • 11. projected DLI scores exceeded the baseline requirements in every planning period by a substantial amount, although still within the 5% margin of error. Discussion WFTC undertook this planning effort to determine if optimization and hierarchical planning tools could improve financial returns on the Mineral Tree Farm. Based on the results, the answer was a resounding yes. Some of the important outcomes included, • An economically efficient strategic plan was devised using an optimization model with discounted net revenue as its objective; previous planning efforts at WFTC focused on volume production as the objective. • Relative to goals established in previous WFTC planning efforts, harvest levels over the first 50 years were 21% higher in this strategic planning solution and 14% higher in the tactical planning solution. Harvest levels were constrained to fluctuate within acceptable tolerances, and harvest acres were kept within allowable limits. • The results indicated that investments in thinning and pruning, while not necessarily economically advantageous from a timber production standpoint, had the potential to reduce timber rotations by producing foraging and roosting habitat in less time, requiring less holding time for existing DH stands. • Dispersal habitat creation met or exceeded targets established in the HCP and the spatial arrangement of harvests in the tactical solution yielded DLI scores that were well within tolerances specified in the HCP. • A new DLI calculator was developed using a raster-based approach instead of the vector-based buffer approach used previously. The new calculator was significantly faster. The Mineral Tree Farm HCP is unique in the State of Washington in the use of the dispersal landscape index as a basis for evaluating management progress; the authors are aware of no other habitat conservation plans that use this approach. Nevertheless, it could be used to supplement planning efforts on other habitat conservation areas where the northern spotted owl is an important consideration. Literature Cited ALLEN, H.L. AND L.W. BREWER. 1985. A review of current northern spotted owl (Strix occidentalis caurina) research in Washington State. IN R.J. Gutierrez and A.B. Carey, eds. Ecology and management of the spotted owl in the Pacific Northwest, USDA For. Serv. Gen. Tech. Rept. PNW-185, Portland, OR. GUTIERREZ, R.J., A.B. FRANKLIN, W. LAHAYE, V.J. MERETSKY AND J.P. WARD. 1985. Juvenile spotted owl dispersal in northwestern California: Preliminary results. IN R.J. Gutierrez and A.B. Carey, eds. Ecology and management of the spotted owl in the Pacific Northwest, USDA For. Serv. Gen. Tech. Rept. PNW-185, Portland, OR. HERTER, D.R. 1992. Spotted owl monitoring reports: 15 September 1991 to 15 December 1991 and 15 December 1991 to 15 January 1992. Reports to Plum Creek Corporation, Raedeke Assoc. Scientific Consulting, Seattle, WA. HOWARD, W.E. 1960. Innate and environmental dispersal of individual vertebrates. Am. Midl. Nat. 63(1):152-161. MILLER, G.S. 1989. Dispersal of juvenile northern spotted owls in Western Oregon. M.S. Thesis, Oregon State Univ., Corvallis. 139pp.
  • 12. MURRAY PACIFIC CORPORATION. 1993. Habitat Conservation Plan for the Northern Spotted Owl (Strix occidentalis caurina) on Timberlands owned by The Murray Pacific Corporation, Lewis County, Washington. 100pp + appendices. THOMAS, J.W., E.D. FORSMAN, J.B. LINT, E.C. MESLOW, B.R. NOON AND J. VERNER, 1990. A conservation strategy for the northern spotted owl. Interagency Scientific Committee to Address the Conservation of the Northern Spotted Owl, Portland, OR.