This document provides information about isometric drawings and projections. It defines key terms like isometric axes, lines, and planes. It explains that isometric drawings maintain equal 120 degree angles between the horizontal, lateral, and depth axes. Examples are provided of how to construct isometric views of various objects like prisms, cylinders, pyramids, and composite shapes using an isometric scale. Steps are outlined for drawing isometric projections of spheres and hemispheres. The document also includes problems instructing the reader to draw isometric views from given orthographic projections.
H
3-D DRAWINGS CANBE DRAWN
IN NUMEROUS WAYS AS SHOWN BELOW.
ALL THESE DRAWINGS MAY BE CALLED
3-DIMENSIONAL DRAWINGS,
OR PHOTOGRAPHIC
OR PICTORIAL DRAWINGS.
HERE NO SPECIFIC RELATION
AMONG H, L & D AXES IS MENTAINED.
H
NOW OBSERVE BELOW GIVEN DRAWINGS.
ONE CAN NOTE SPECIFIC INCLINATION
AMONG H, L & D AXES.
ISO MEANS SAME, SIMILAR OR EQUAL.
HERE ONE CAN FIND
EDUAL INCLINATION AMONG H, L & D AXES.
EACH IS 1200 INCLINED WITH OTHER TWO.
HENCE IT IS CALLED ISOMETRIC DRAWING
H
L
IT IS A TYPE OF PICTORIAL PROJECTION
IN WHICH ALL THREE DIMENSIONS OF
AN OBJECT ARE SHOWN IN ONE VIEW AND
IF REQUIRED, THEIR ACTUAL SIZES CAN BE
MEASURED DIRECTLY FROM IT.
IN THIS 3-D DRAWING OF AN OBJECT,
ALL THREE DIMENSIONAL AXES ARE
MENTAINED AT EQUAL INCLINATIONS
WITH EACH OTHER.( 1200)
PURPOSE OF ISOMETRIC DRAWING IS TO UNDERSTAND
OVERALL SHAPE, SIZE & APPEARANCE OF AN OBJECT PRIOR TO IT’S PRODUCTION.
ISOMETRIC DRAWING TYPICAL CONDITION.
2.
ISOMETRIC AXES, LINESAND PLANES:
The three lines AL, AD and AH, meeting at point A and making
1200 angles with each other are termed Isometric Axes.
The lines parallel to these axes are called Isometric Lines.
The planes representing the faces of of the cube as well as
other planes parallel to these planes are called Isometric Planes.
ISOMETRIC SCALE:
When one holds the object in such a way that all three dimensions
are visible then in the process all dimensions become proportionally
inclined to observer’s eye sight and hence appear apparent in lengths.
This reduction is 0.815 or 9 / 11 ( approx.) It forms a reducing scale which
Is used to draw isometric drawings and is called Isometric scale.
In practice, while drawing isometric projection, it is necessary to convert
true lengths into isometric lengths for measuring and marking the sizes.
This is conveniently done by constructing an isometric scale as described
H
A
SOME IMPORTANT TERMS:
3.
ISOMETRIC VIEW ISOMETRICPROJECTION
H H
TYPES OF ISOMETRIC DRAWINGS
Drawn by using Isometric scale
( Reduced dimensions )
Drawn by using True scale
( True dimensions )
450
300
0
1
2
3
4
0
1
2
3
4
Isometric scale [ Line AC ]
required for Isometric Projection
A B
C
D
CONSTRUCTION OF ISOM.SCALE.
From point A, with line AB draw 300 and
450 inclined lines AC & AD resp on AD.
Mark divisions of true length and from
each division-point draw vertical lines
upto AC line.
The divisions thus obtained on AC
give lengths on isometric scale.
4.
SHAPE Isometric viewif the Shape is
F.V. or T.V.
TRIANGLE
A
B
RECTANGLE
D
C
H
D
A
B
C
A
B
D
C
H
1
2
3
A
B
3
1
2
A
B
3
1
2
A
B
H
1
2 3
4
PENTAGON
A
B C
D
E 1
2
3
4
A
B
C
D
E
1
2
3
4
A
B
C
D
E
ISOMETRIC
OF
PLANE FIGURES
AS THESE ALL ARE
2-D FIGURES
WE REQUIRE ONLY TWO
ISOMETRIC AXES.
IF THE FIGURE IS FRONT VIEW,
H & L AXES ARE REQUIRED.
IF THE FIGURE IS TOP VIEW, D
& L AXES ARE REQUIRED.
Shapes containing
Inclined lines should be
enclosed in a rectangle
as shown.
Then first draw isom. of
that rectangle and then
inscribe that shape as it
is.
1
5.
1
4
2
3
A B
D C
Z
STUDY
ILLUSTRATIONS
DRAWISOMETRIC VIEW OF A
CIRCLE IF IT IS A TV OR FV.
FIRST ENCLOSE IT IN A SQUARE.
IT’S ISOMETRIC IS A RHOMBUS WITH
D & L AXES FOR TOP VIEW.
THEN USE H & L AXES FOR ISOMETRIC
WHEN IT IS FRONT VIEW.
FOR CONSTRUCTION USE RHOMBUS
METHOD SHOWN HERE. STUDY IT.
2
6.
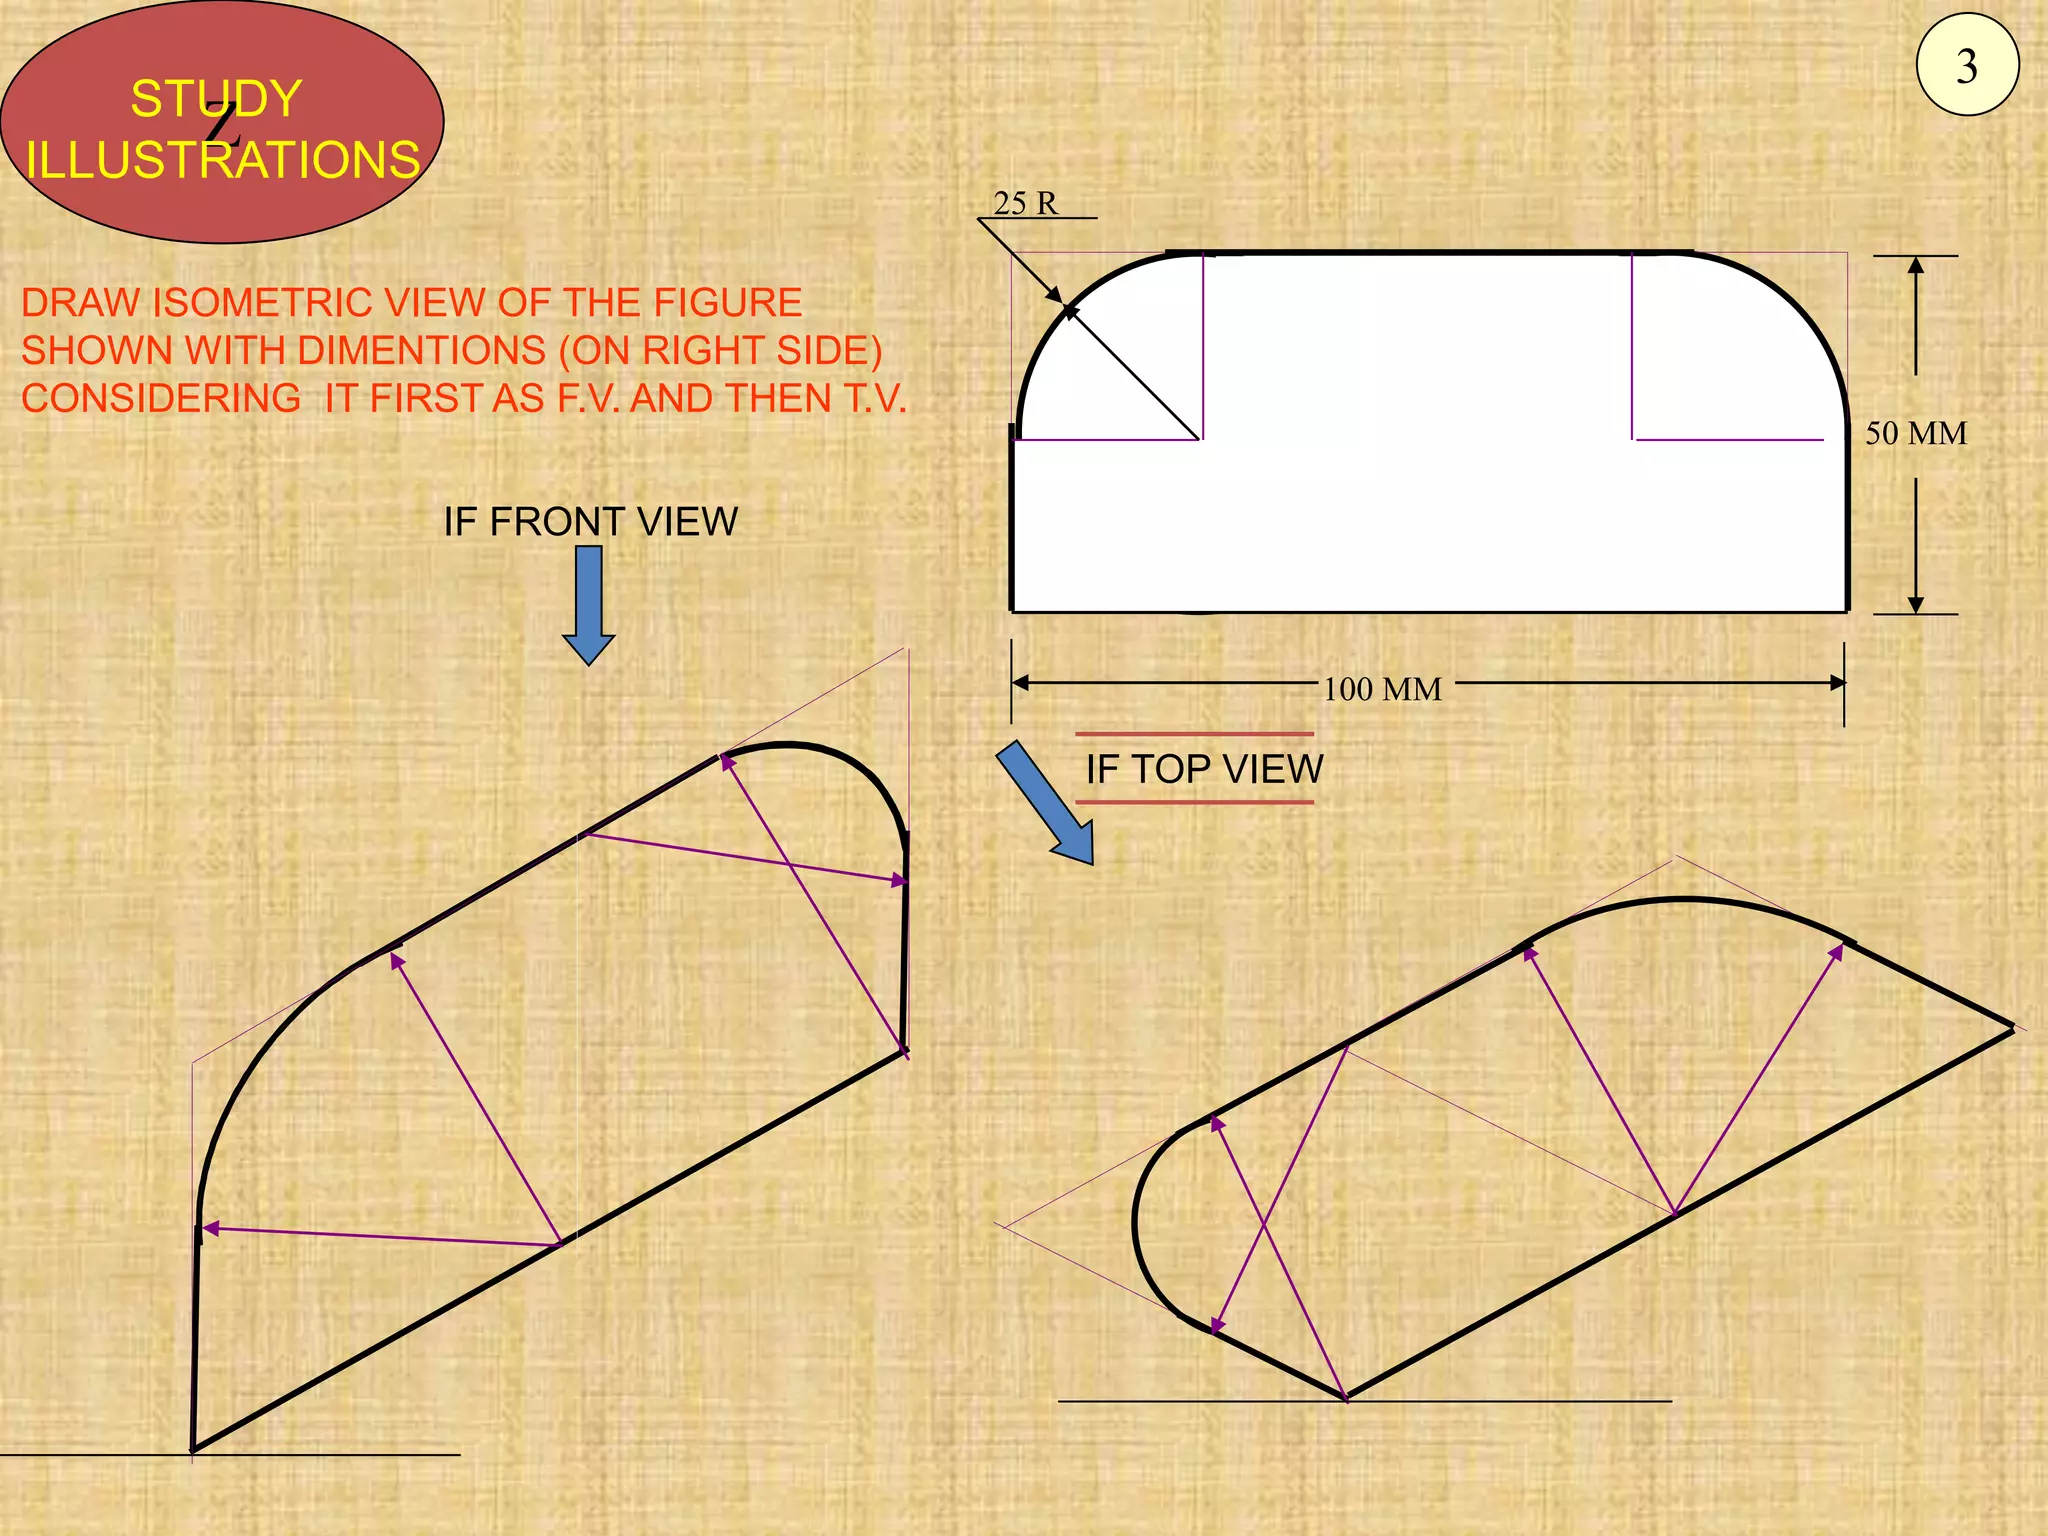
25 R
100 MM
50MM
Z
STUDY
ILLUSTRATIONS
DRAW ISOMETRIC VIEW OF THE FIGURE
SHOWN WITH DIMENTIONS (ON RIGHT SIDE)
CONSIDERING IT FIRST AS F.V. AND THEN T.V.
IF TOP VIEW
IF FRONT VIEW
3
7.
CIRCLE
HEXAGON
SEMI CIRCLE
ISOMETRIC
OF
PLANE FIGURES
ASTHESE ALL ARE
2-D FIGURES
WE REQUIRE ONLY TWO
ISOMETRIC AXES.
IF THE FIGURE IS
FRONT VIEW, H & L
AXES ARE REQUIRED.
IF THE FIGURE IS TOP
VIEW, D & L AXES ARE
REQUIRED.
SHAPE IF F.V. IF T.V.
For Isometric of Circle/Semicircle use Rhombus method. Construct Rhomb
of sides equal to Diameter of circle always. ( Ref. topic ENGG. CURVES.)
For Isometric of
Circle/Semicircle
use Rhombus method.
Construct it of sides equal
to diameter of circle always.
( Ref. Previous two pages.)
4
ISOMETRIC VIEW
OF
FRUSTOM OFPENTAGONAL PYRAMID
STUDY
ILLUSTRATION
1
2 3
4
y
A
B
C
D
E
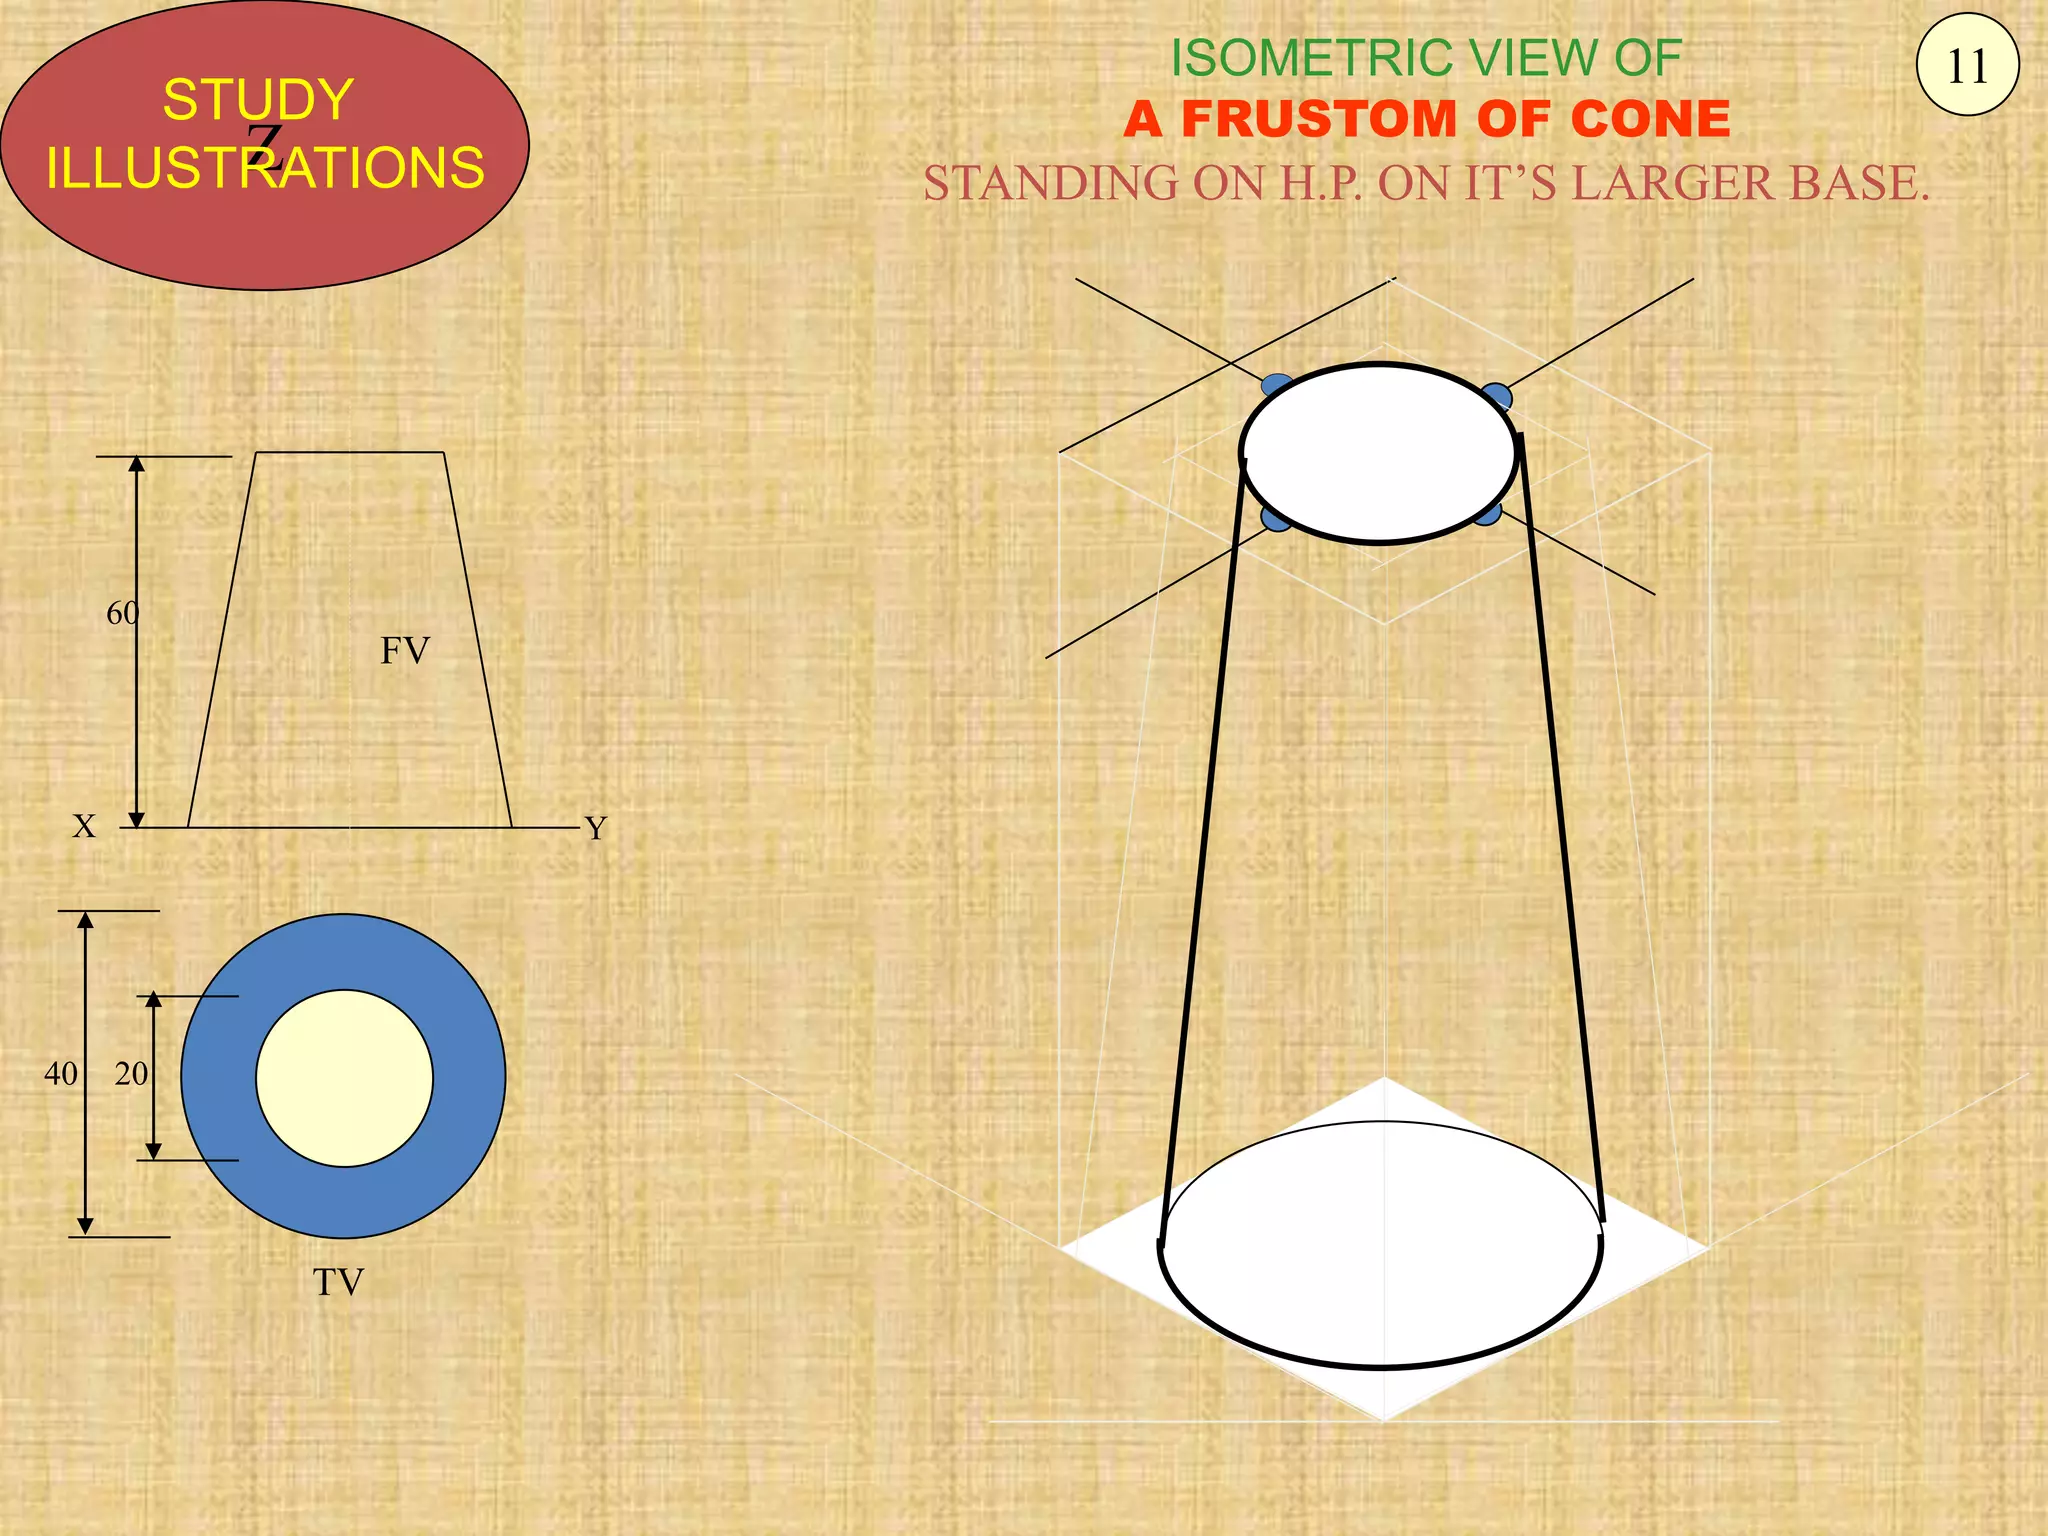
40 20
60
x
FV
TV
PROJECTIONS OF FRUSTOM OF
PENTAGONAL PYRAMID ARE GIVEN.
DRAW IT’S ISOMETRIC VIEW.
SOLUTION STEPS:
FIRST DRAW ISOMETRIC
OF IT’S BASE.
THEN DRAWSAME SHAPE
AS TOP, 60 MM ABOVE THE
BASE PENTAGON CENTER.
THEN REDUCE THE TOP TO
20 MM SIDES AND JOIN WITH
THE PROPER BASE CORNERS.
10
Z
STUDY
ILLUSTRATIONS
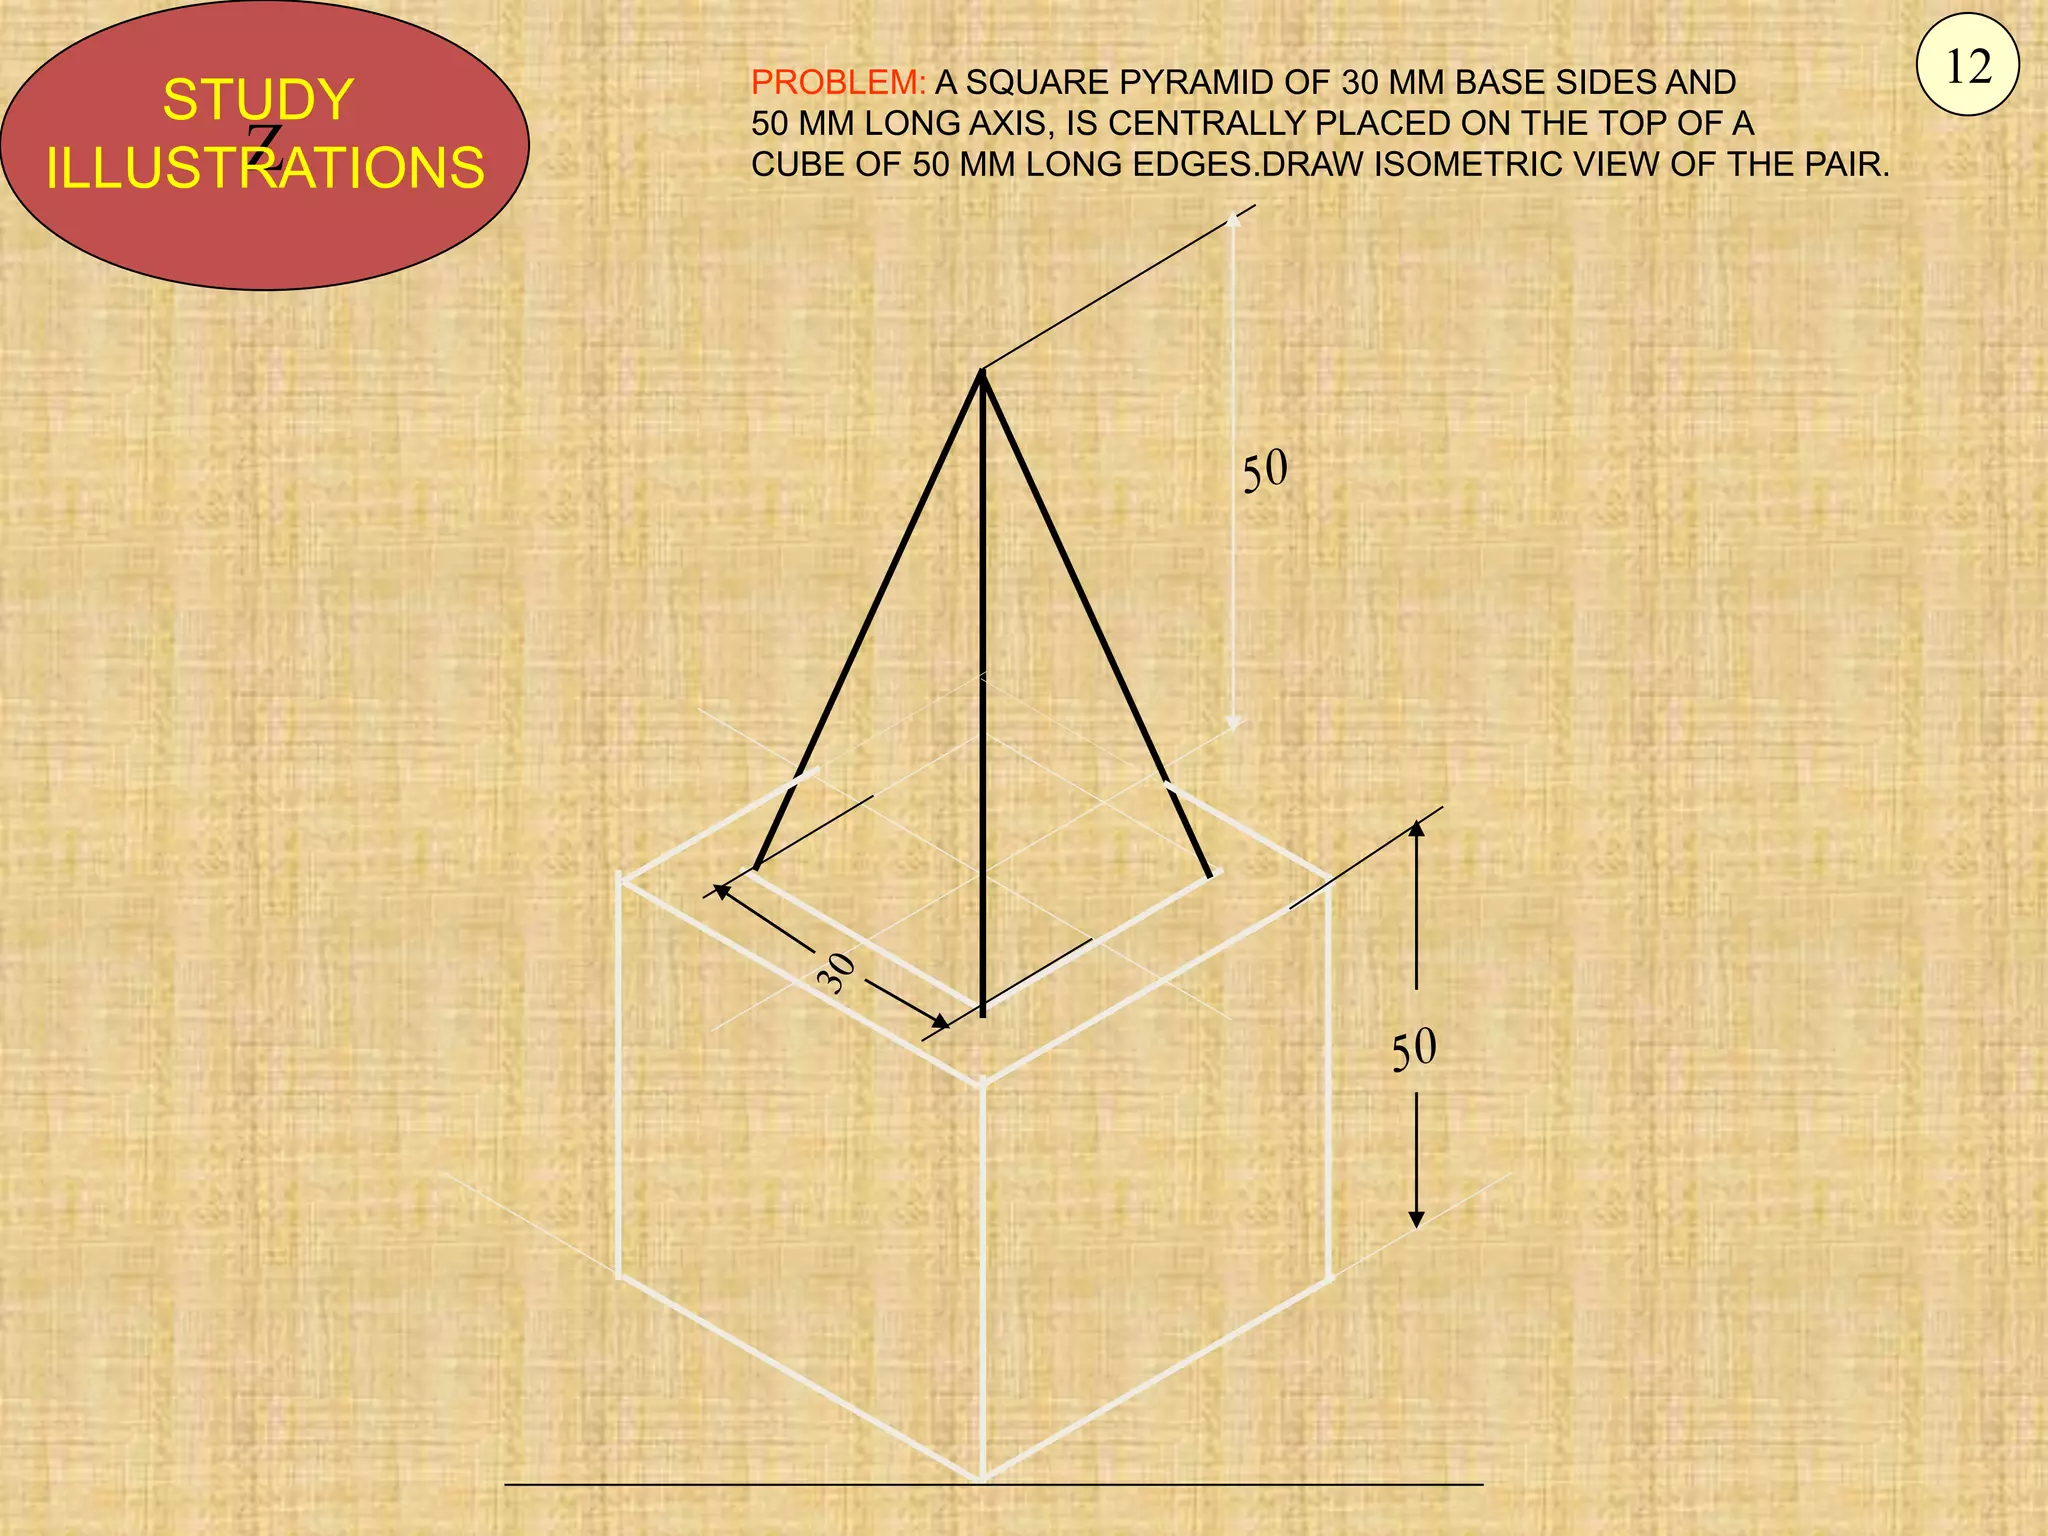
PROBLEM: A SQUAREPYRAMID OF 30 MM BASE SIDES AND
50 MM LONG AXIS, IS CENTRALLY PLACED ON THE TOP OF A
CUBE OF 50 MM LONG EDGES.DRAW ISOMETRIC VIEW OF THE PAIR.
12
16.
a
b
c
o
p
p
a
b
c
o
Z
STUDY
ILLUSTRATIONS
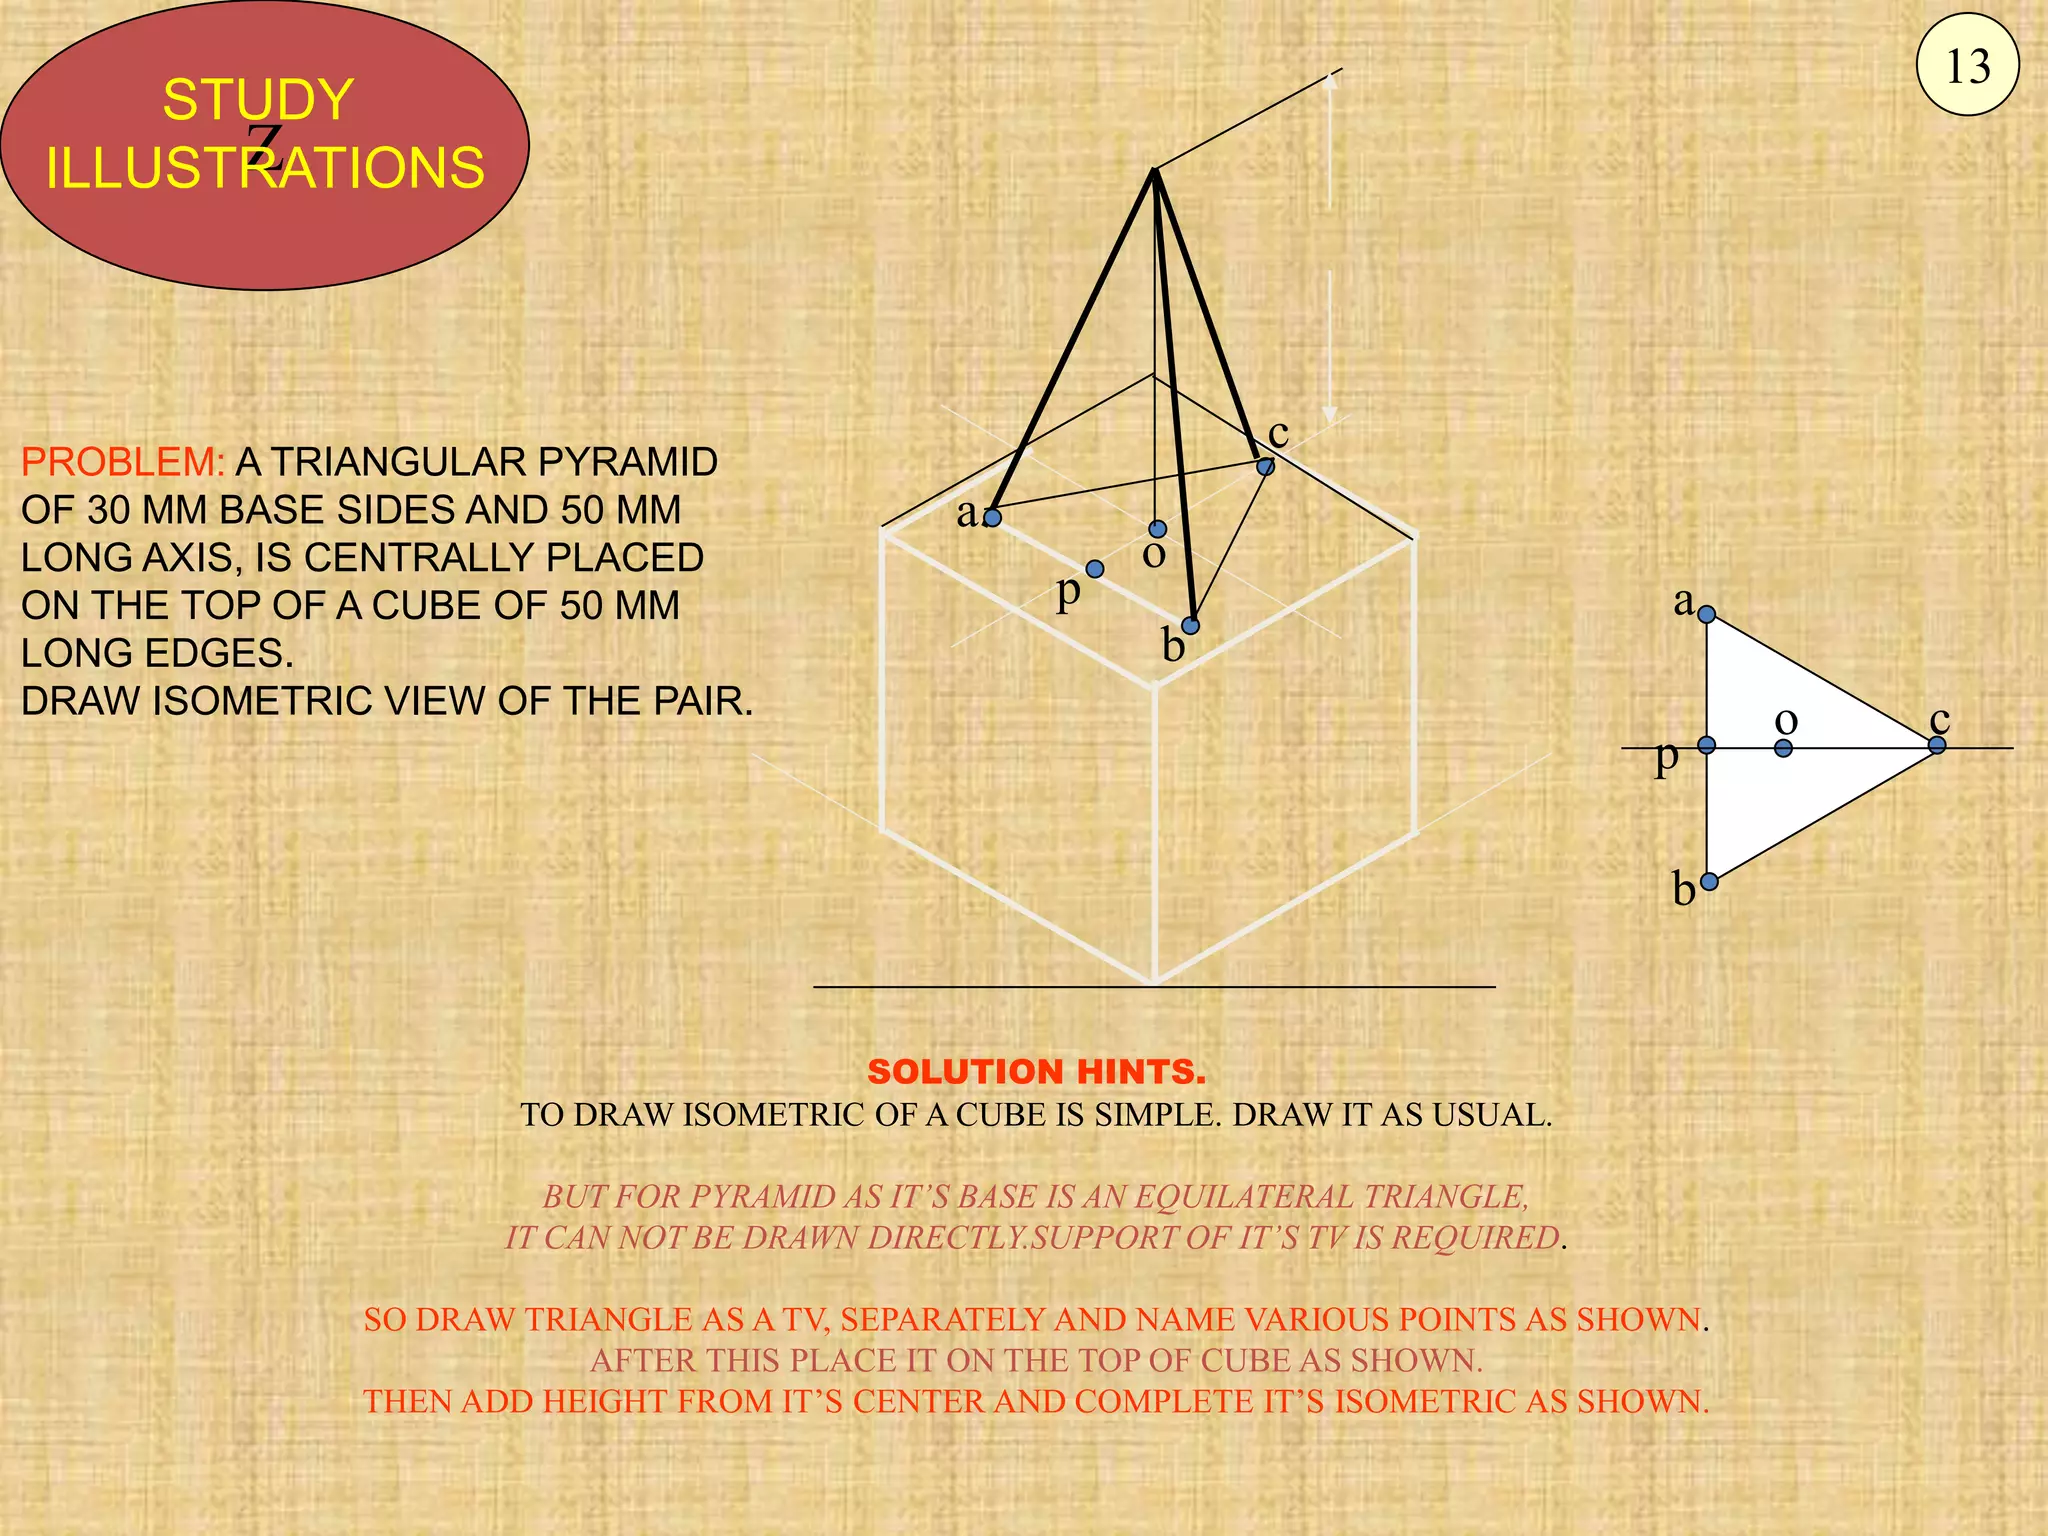
PROBLEM: A TRIANGULARPYRAMID
OF 30 MM BASE SIDES AND 50 MM
LONG AXIS, IS CENTRALLY PLACED
ON THE TOP OF A CUBE OF 50 MM
LONG EDGES.
DRAW ISOMETRIC VIEW OF THE PAIR.
SOLUTION HINTS.
TO DRAW ISOMETRIC OF A CUBE IS SIMPLE. DRAW IT AS USUAL.
BUT FOR PYRAMID AS IT’S BASE IS AN EQUILATERAL TRIANGLE,
IT CAN NOT BE DRAWN DIRECTLY.SUPPORT OF IT’S TV IS REQUIRED.
SO DRAW TRIANGLE AS A TV, SEPARATELY AND NAME VARIOUS POINTS AS SHOWN.
AFTER THIS PLACE IT ON THE TOP OF CUBE AS SHOWN.
THEN ADD HEIGHT FROM IT’S CENTER AND COMPLETE IT’S ISOMETRIC AS SHOWN.
13
P
r
R
R
r
P
C
C = Centerof Sphere.
P = Point of contact
R = True Radius of Sphere
r = Isometric Radius.
R
r
P
r
R
C
r
r
ISOMETRIC PROJECTIONS OF SPHERE & HEMISPHERE
450
300
TO DRAW ISOMETRIC PROJECTION
OF A HEMISPHERE
TO DRAW ISOMETRIC PROJECTION OF A SPHERE
1. FIRST DRAW ISOMETRIC OF SQUARE PLATE.
2. LOCATE IT’S CENTER. NAME IT P.
3. FROM PDRAW VERTICAL LINE UPWARD, LENGTH ‘ r mm’
AND LOCATE CENTER OF SPHERE “C”
4. ‘C’ AS CENTER, WITH RADIUS ‘R’ DRAW CIRCLE.
THIS IS ISOMETRIC PROJECTION OF A SPHERE.
Adopt same procedure.
Draw lower semicircle only.
Then around ‘C’ construct
Rhombus of Sides equal to
Isometric Diameter.
For this use iso-scale.
Then construct ellipse in
this Rhombus as usual
And Complete
Isometric-Projection
of Hemi-sphere.
Z
STUDY
ILLUSTRATIONS
Isom. Scale
17
21.
P
r
R
r
r
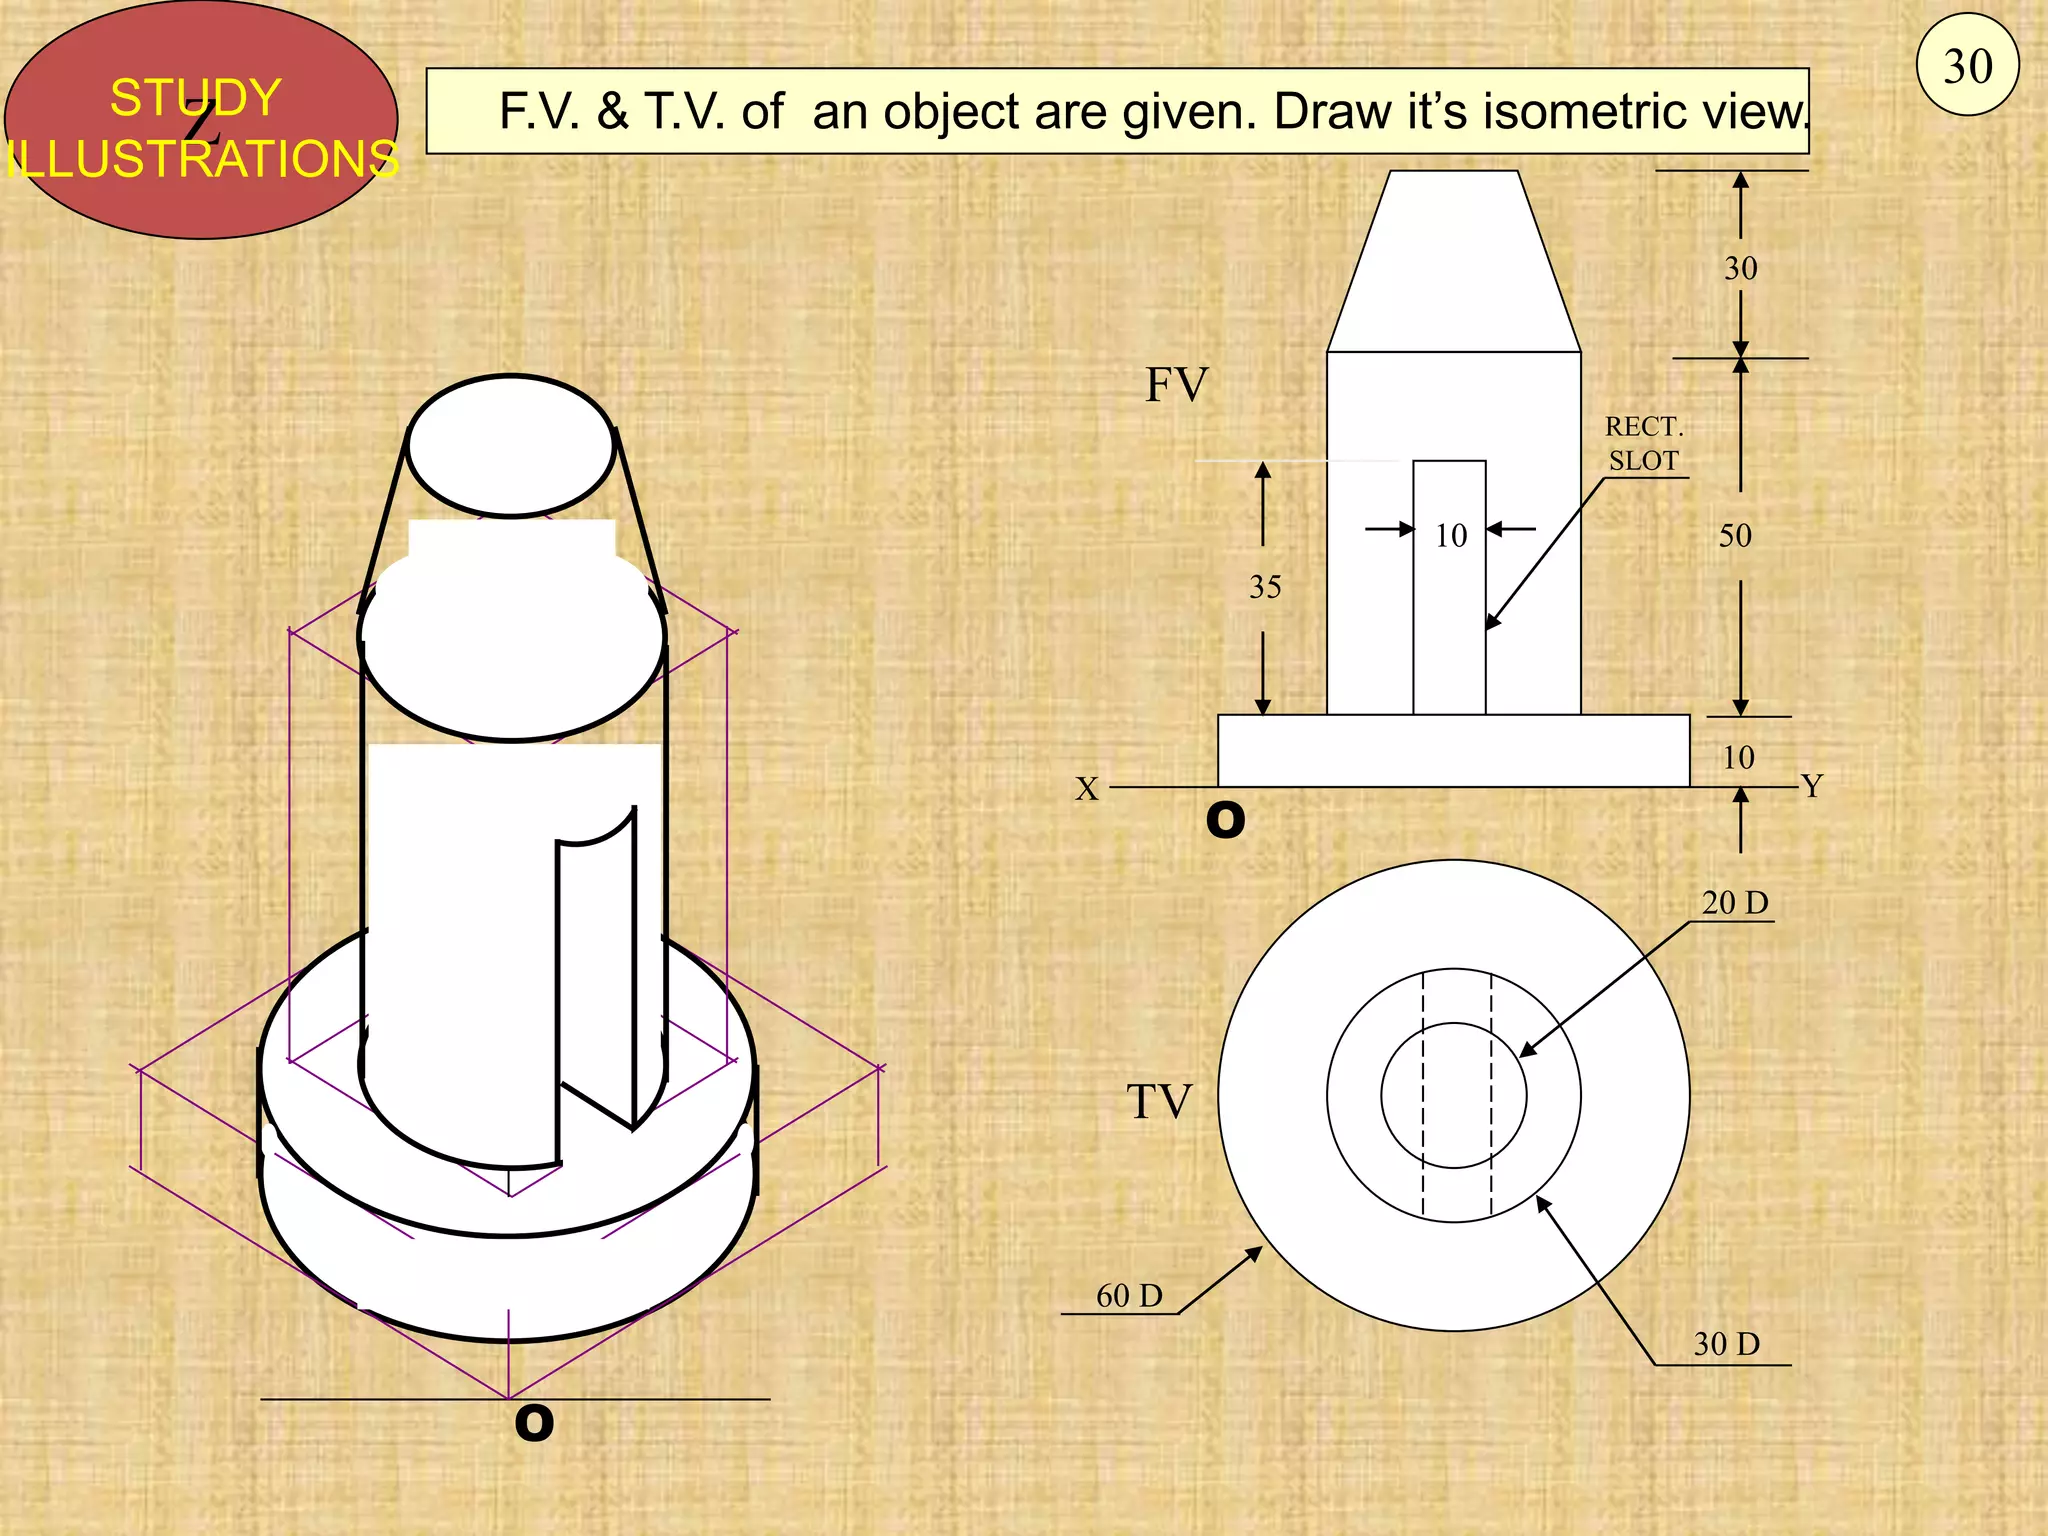
50 D
30 D
50D
50
450
300
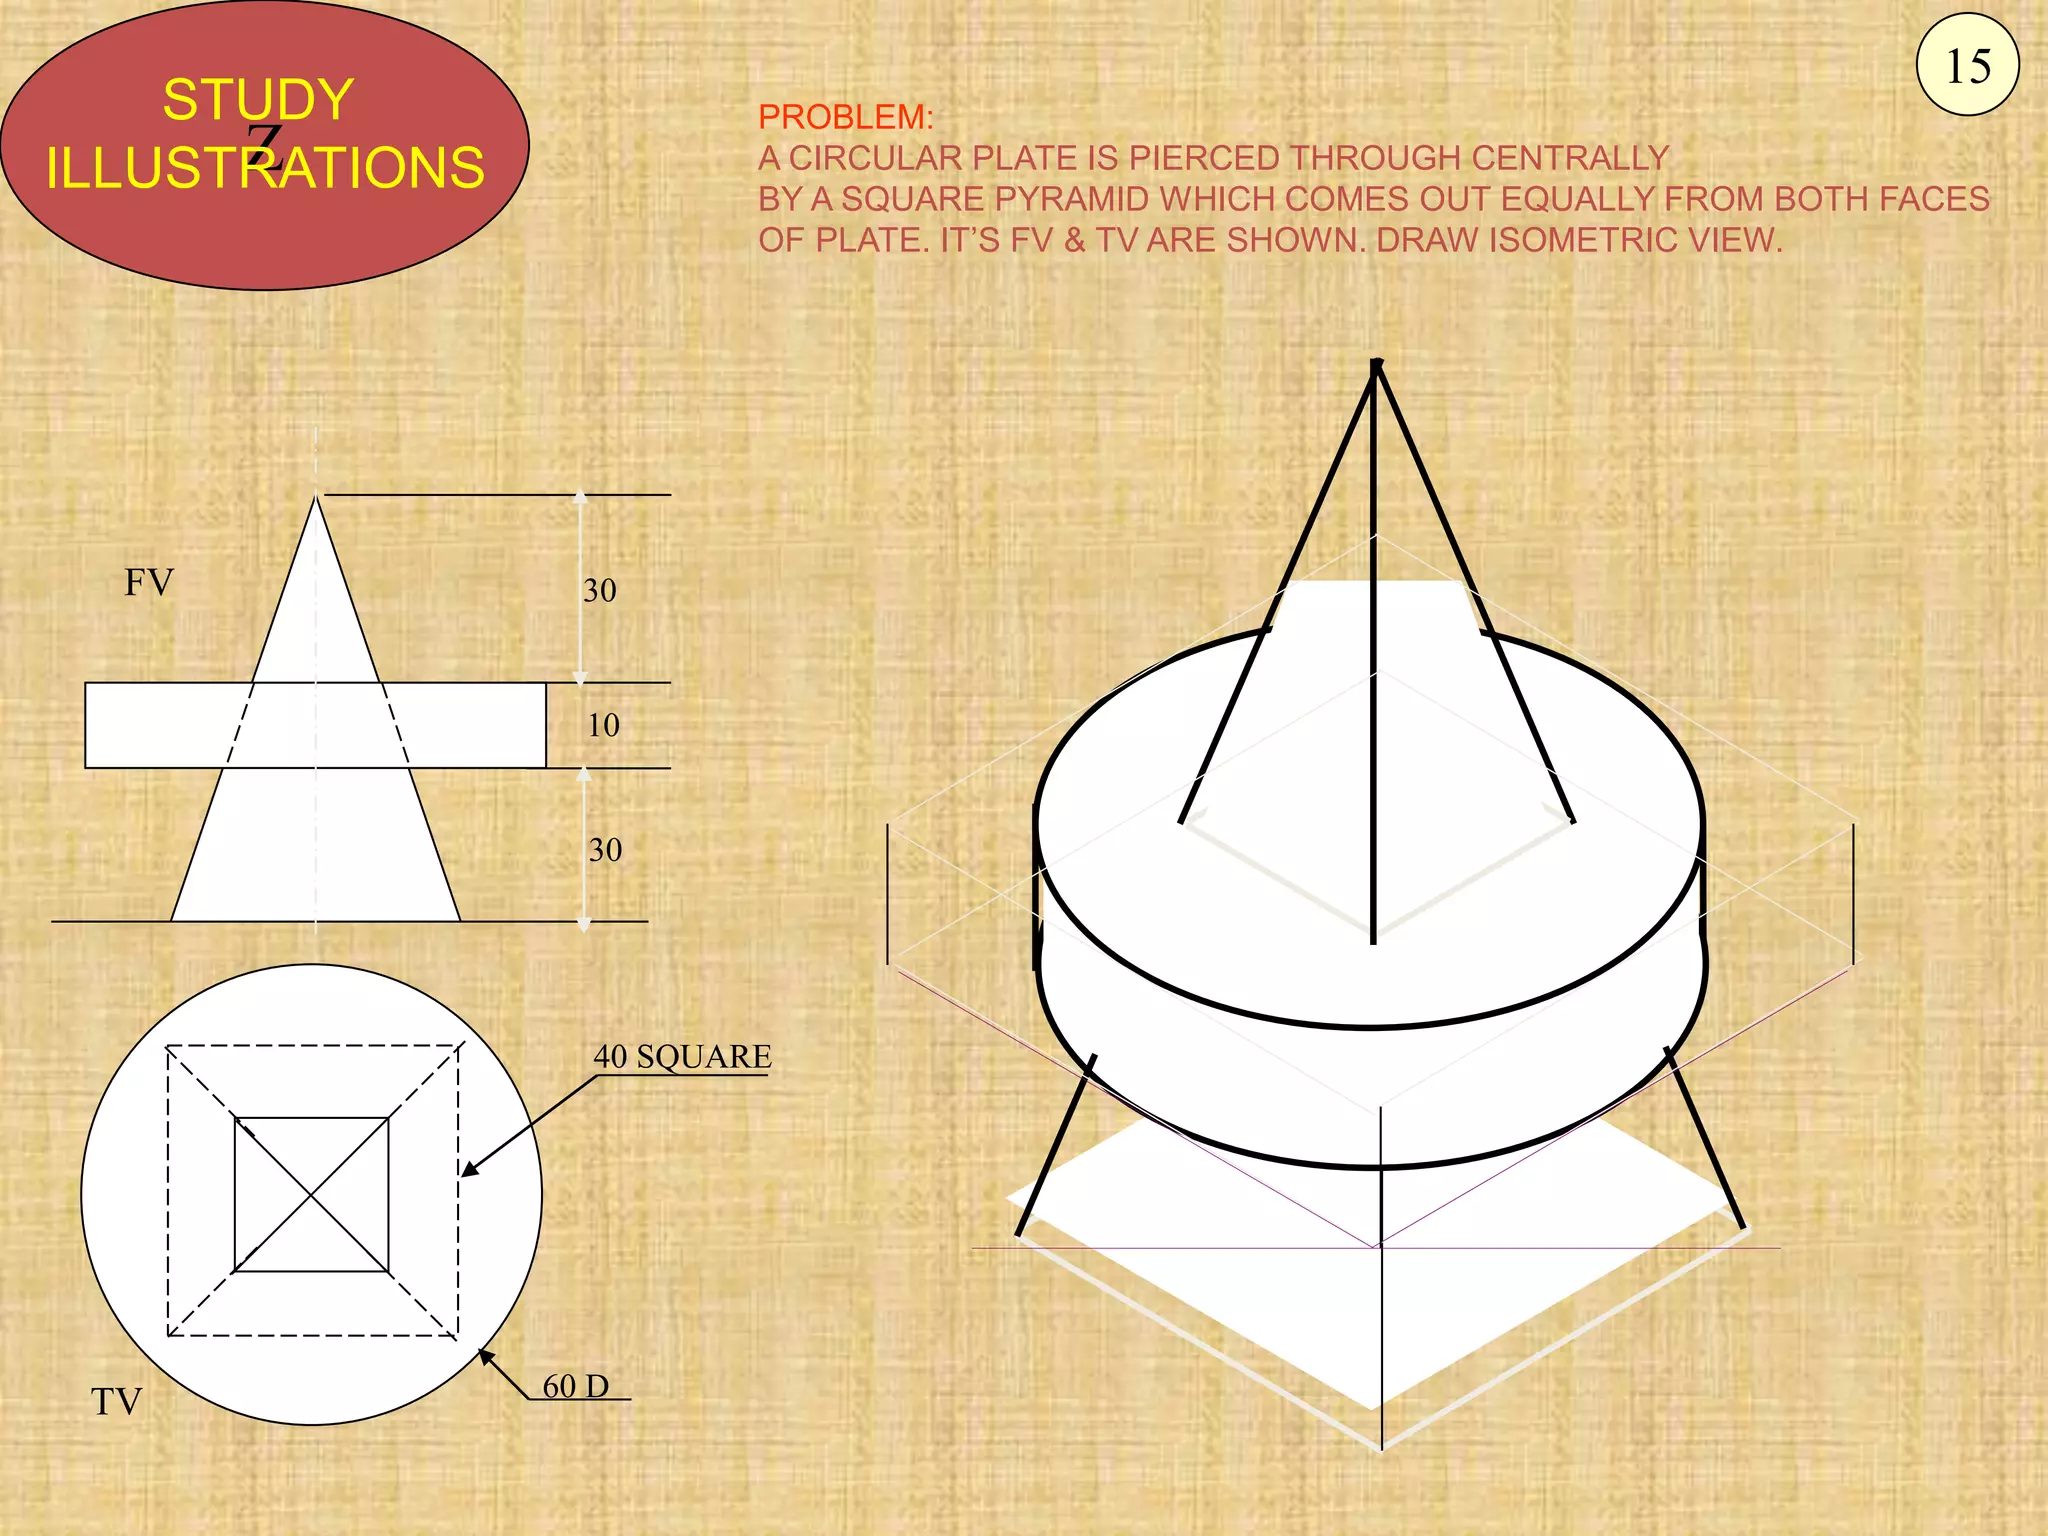
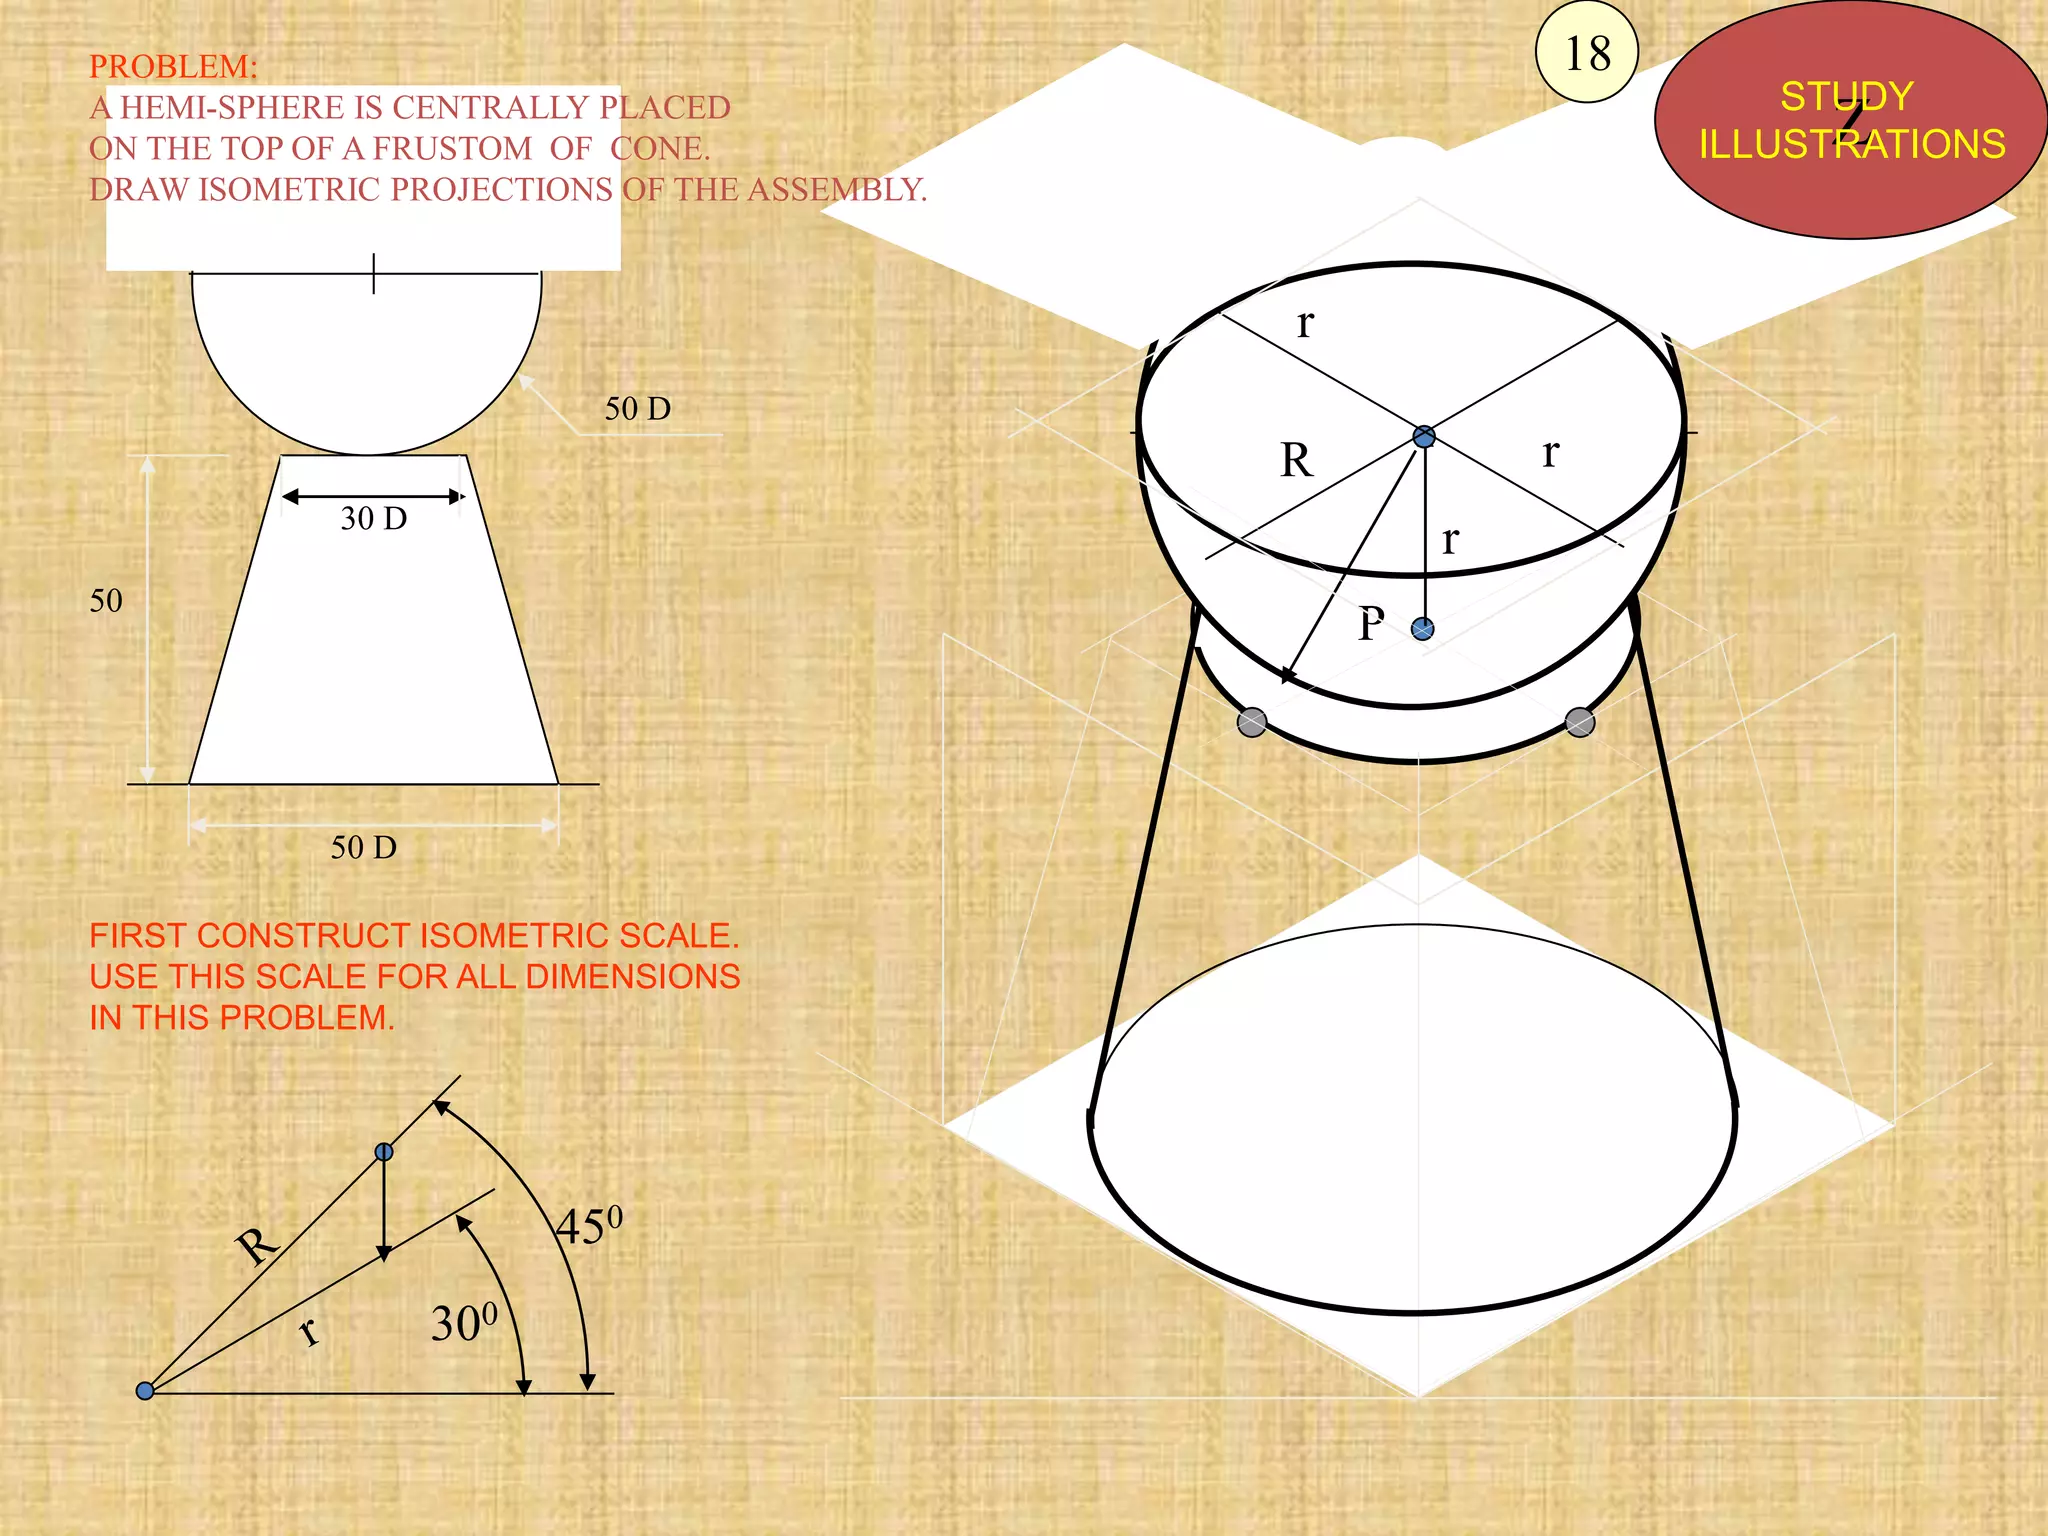
PROBLEM:
A HEMI-SPHERE IS CENTRALLY PLACED
ON THE TOP OF A FRUSTOM OF CONE.
DRAW ISOMETRIC PROJECTIONS OF THE ASSEMBLY.
FIRST CONSTRUCT ISOMETRIC SCALE.
USE THIS SCALE FOR ALL DIMENSIONS
IN THIS PROBLEM.
Z
STUDY
ILLUSTRATIONS
18
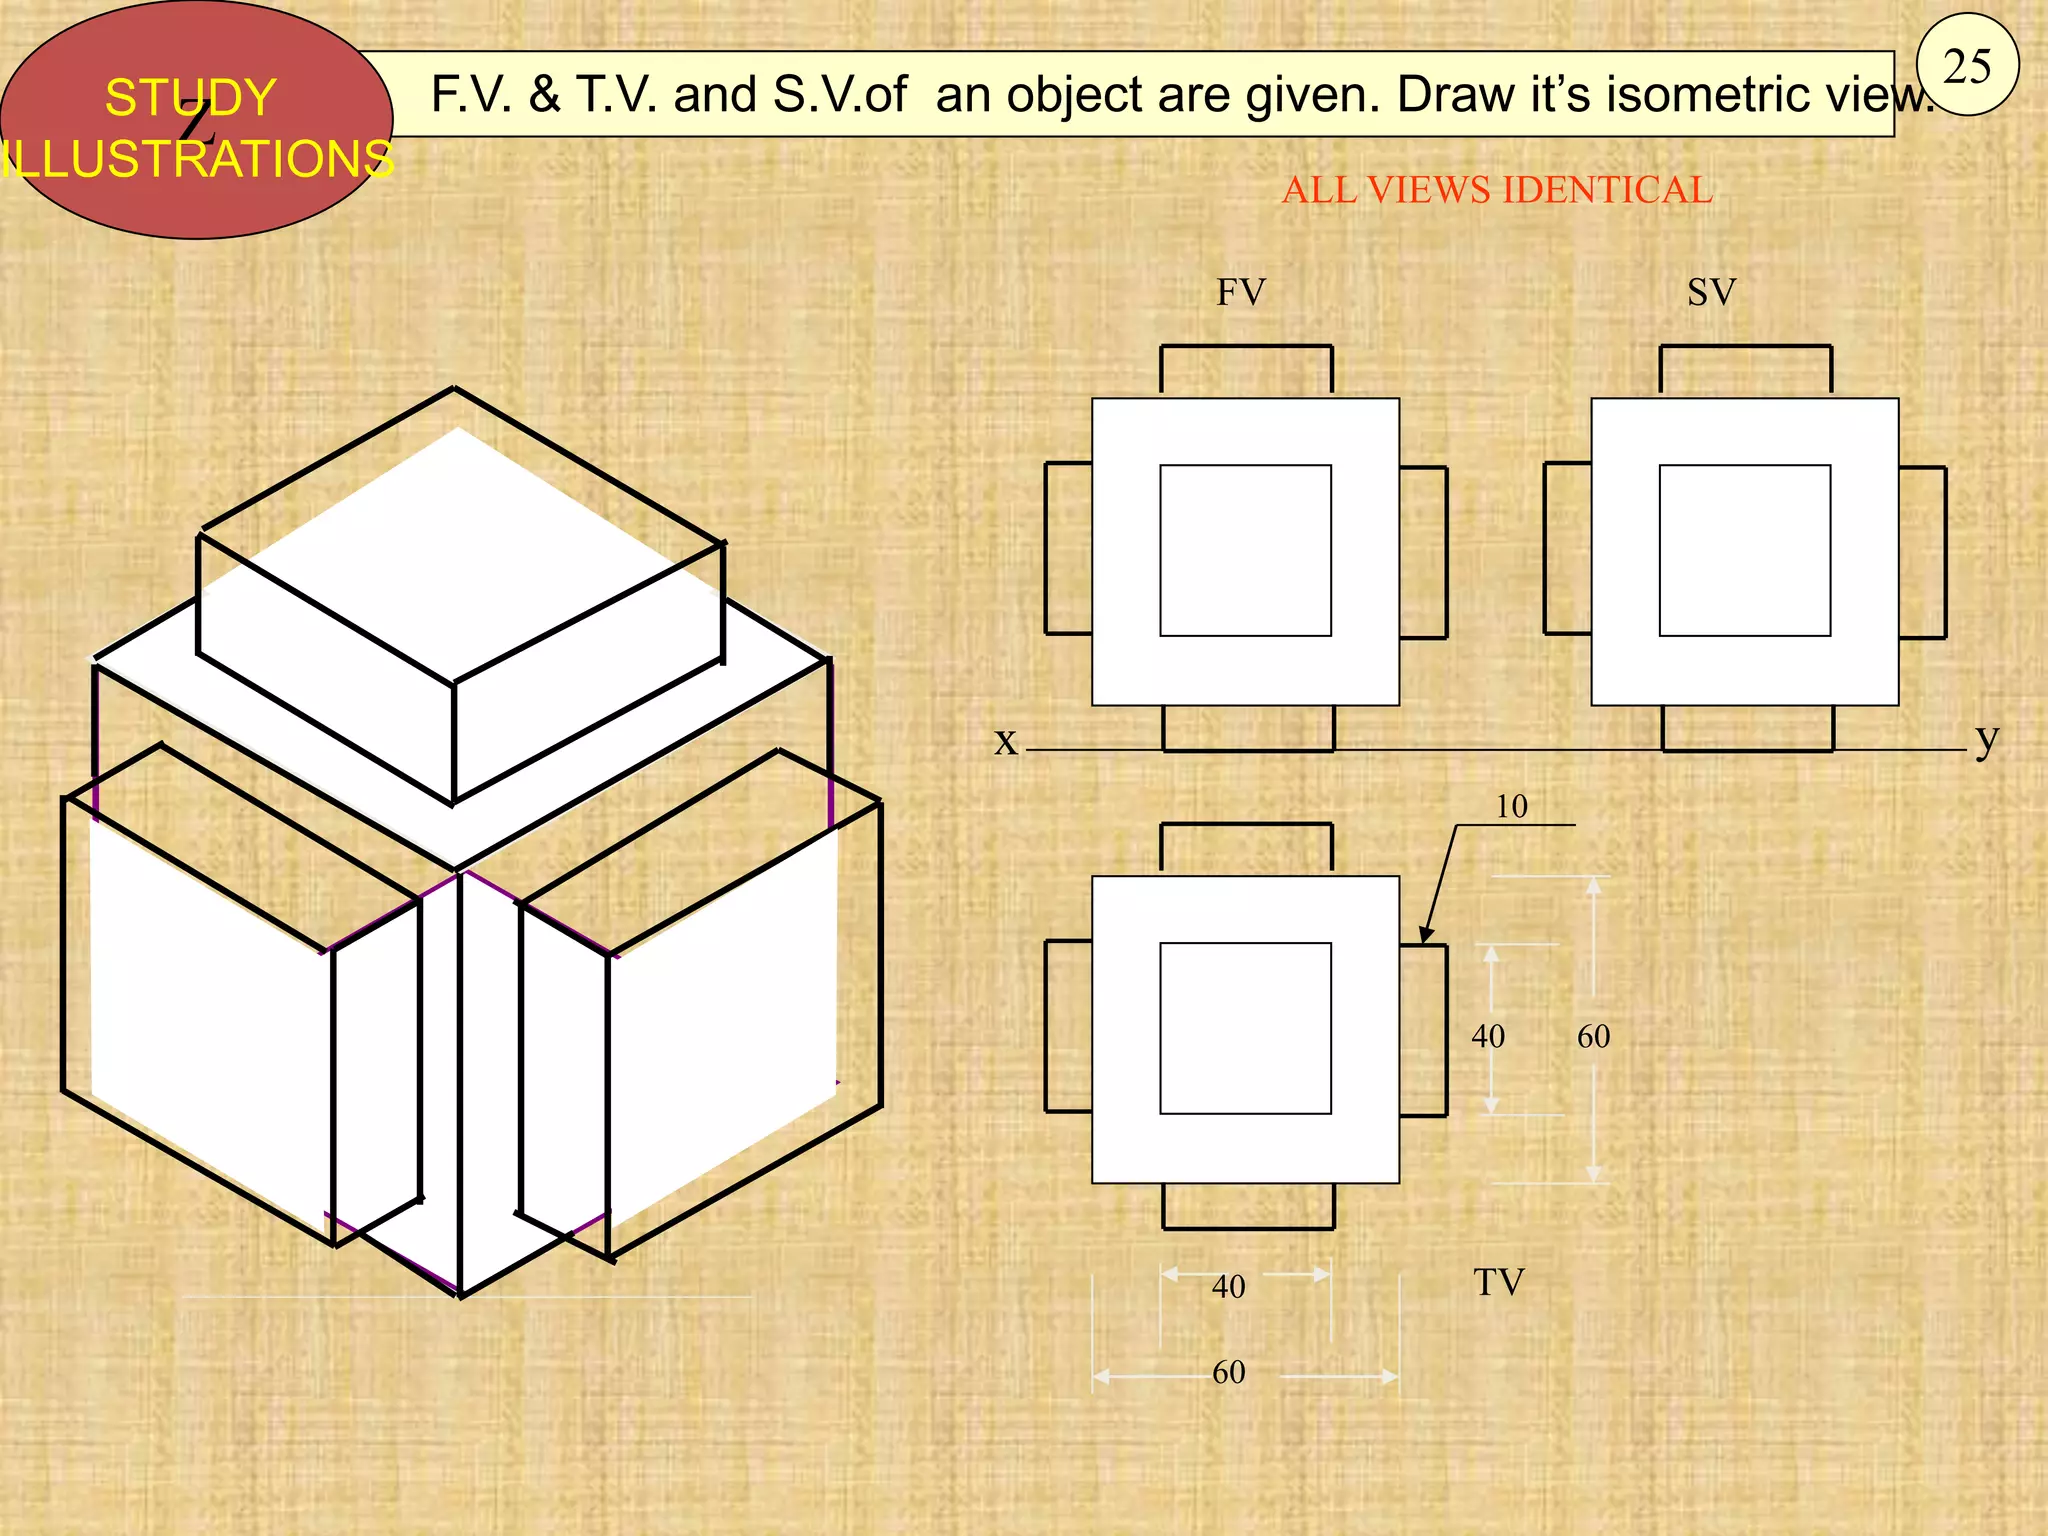
x y
FV SV
TV
ALLVIEWS IDENTICAL
40 60
60
40
10
F.V. & T.V. and S.V.of an object are given. Draw it’s isometric view.
Z
STUDY
ILLUSTRATIONS
25
28.
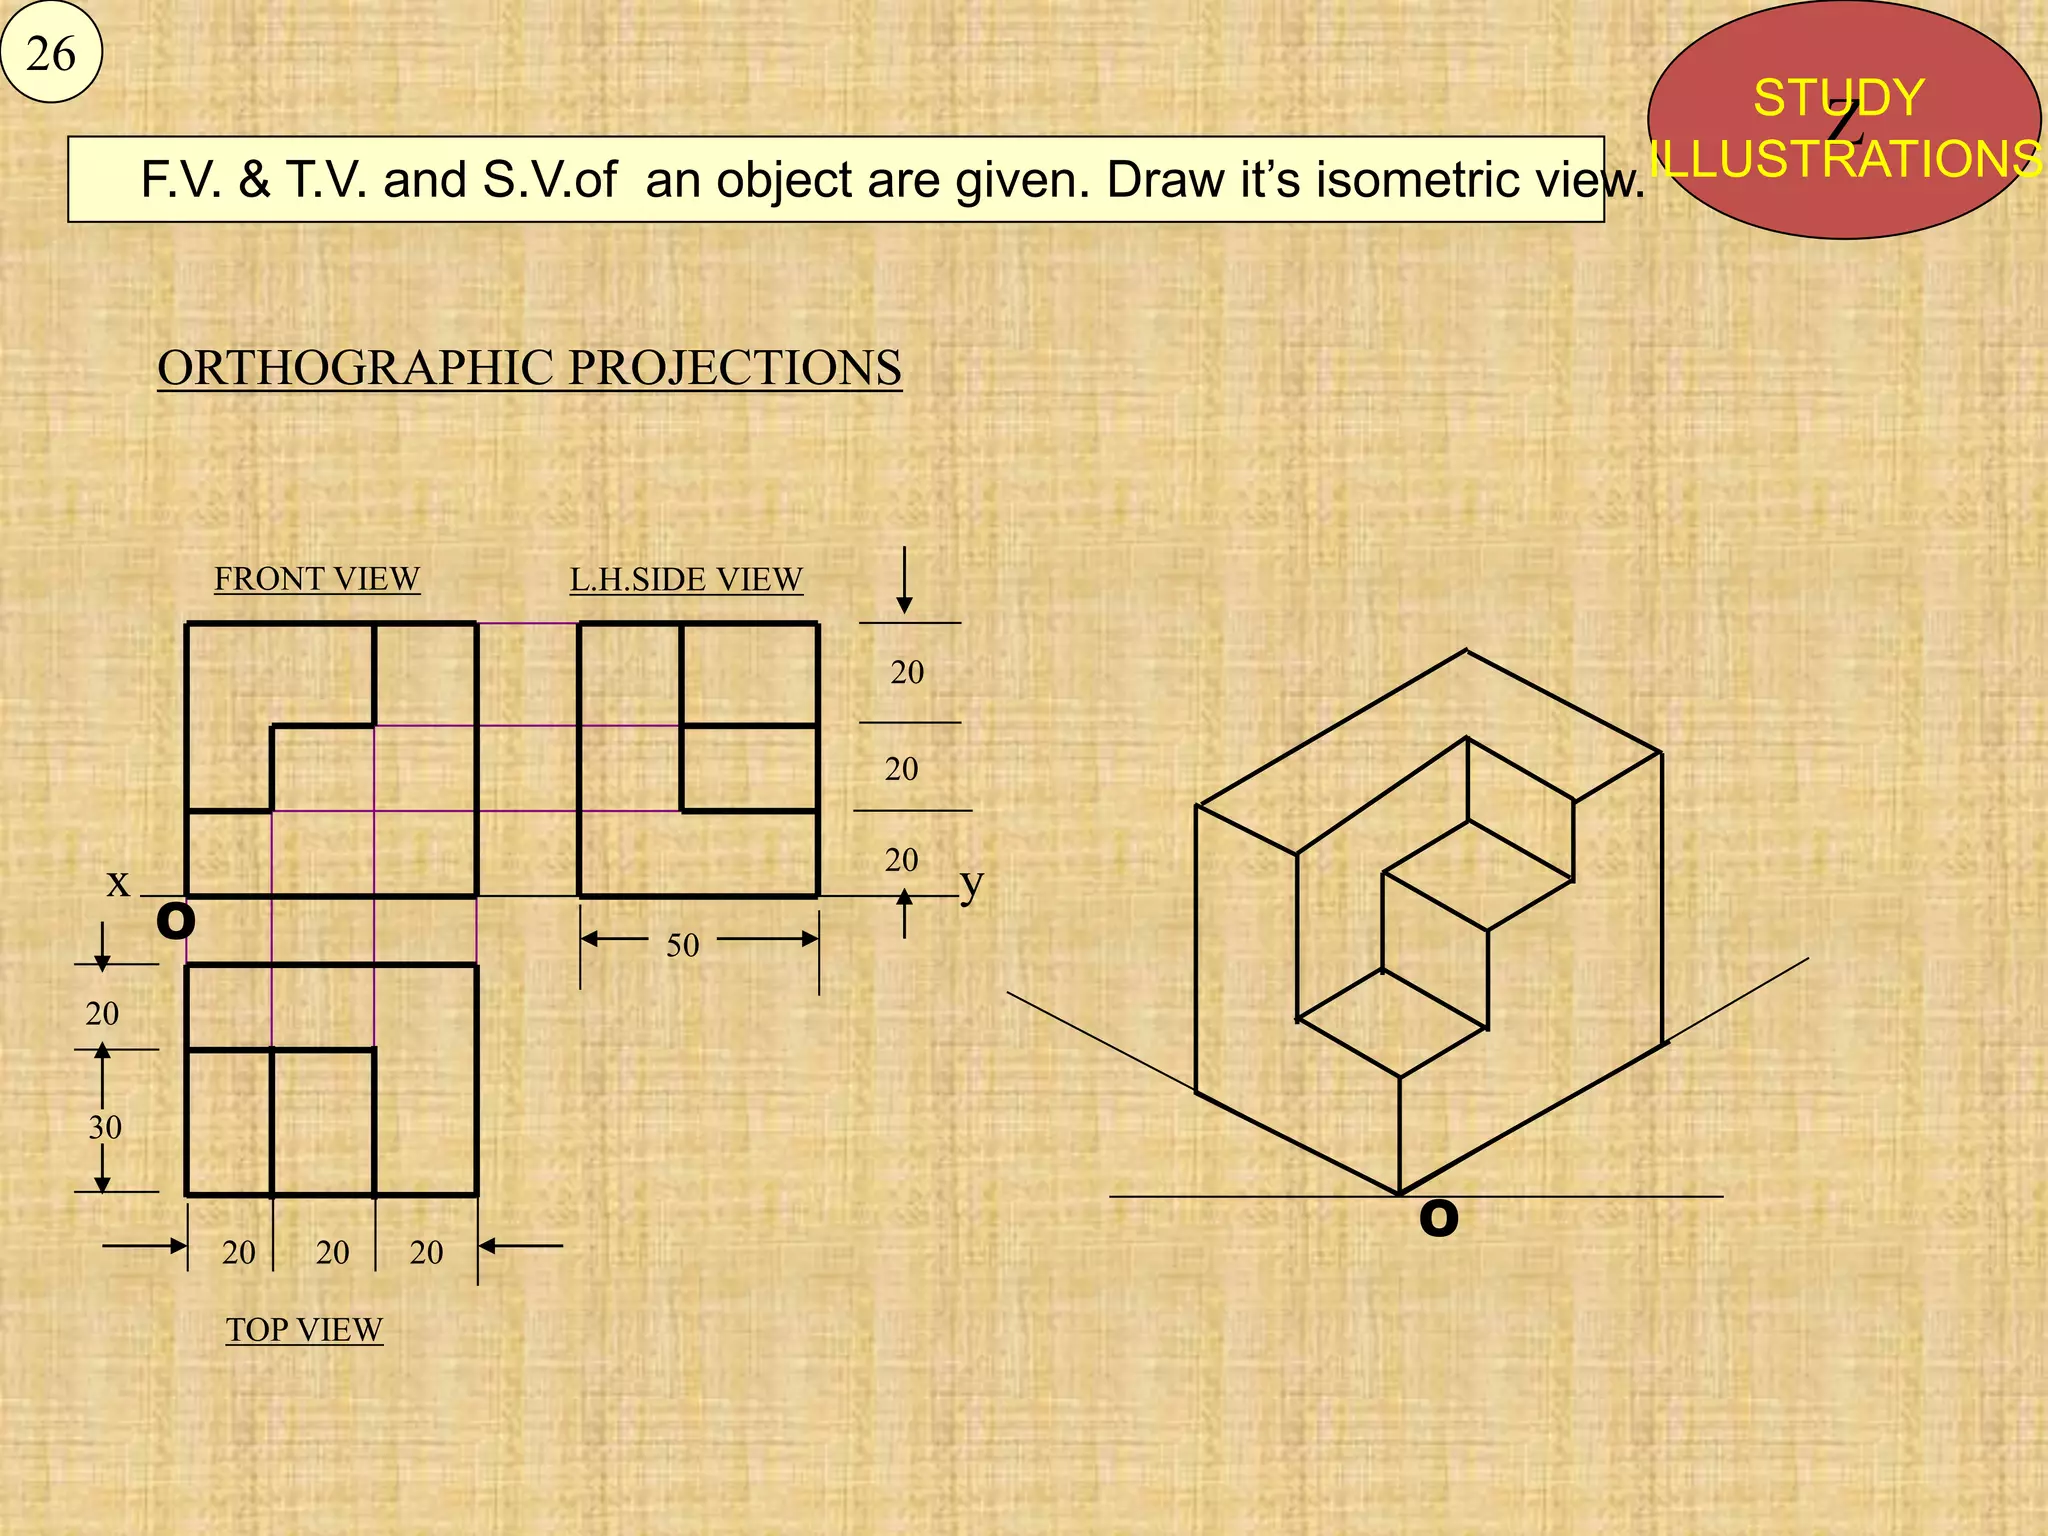
ORTHOGRAPHIC PROJECTIONS
FRONT VIEW
TOPVIEW
L.H.SIDE VIEW
x y
20
20
20
50
20 20 20
20
30
O
O
F.V. & T.V. and S.V.of an object are given. Draw it’s isometric view.
Z
STUDY
ILLUSTRATIONS
26
FV LSV
X Y
10
O
FVLSV
X Y
10 10 15
25
25
10
50
O
F.V. and S.V.of an object are given.
Draw it’s isometric view.
Z
STUDY
ILLUSTRATIONS
35
36
NOTE THE SMALL CHZNGE IN 2ND FV & SV.
DRAW ISOMETRIC ACCORDINGLY.
38.
Y
X
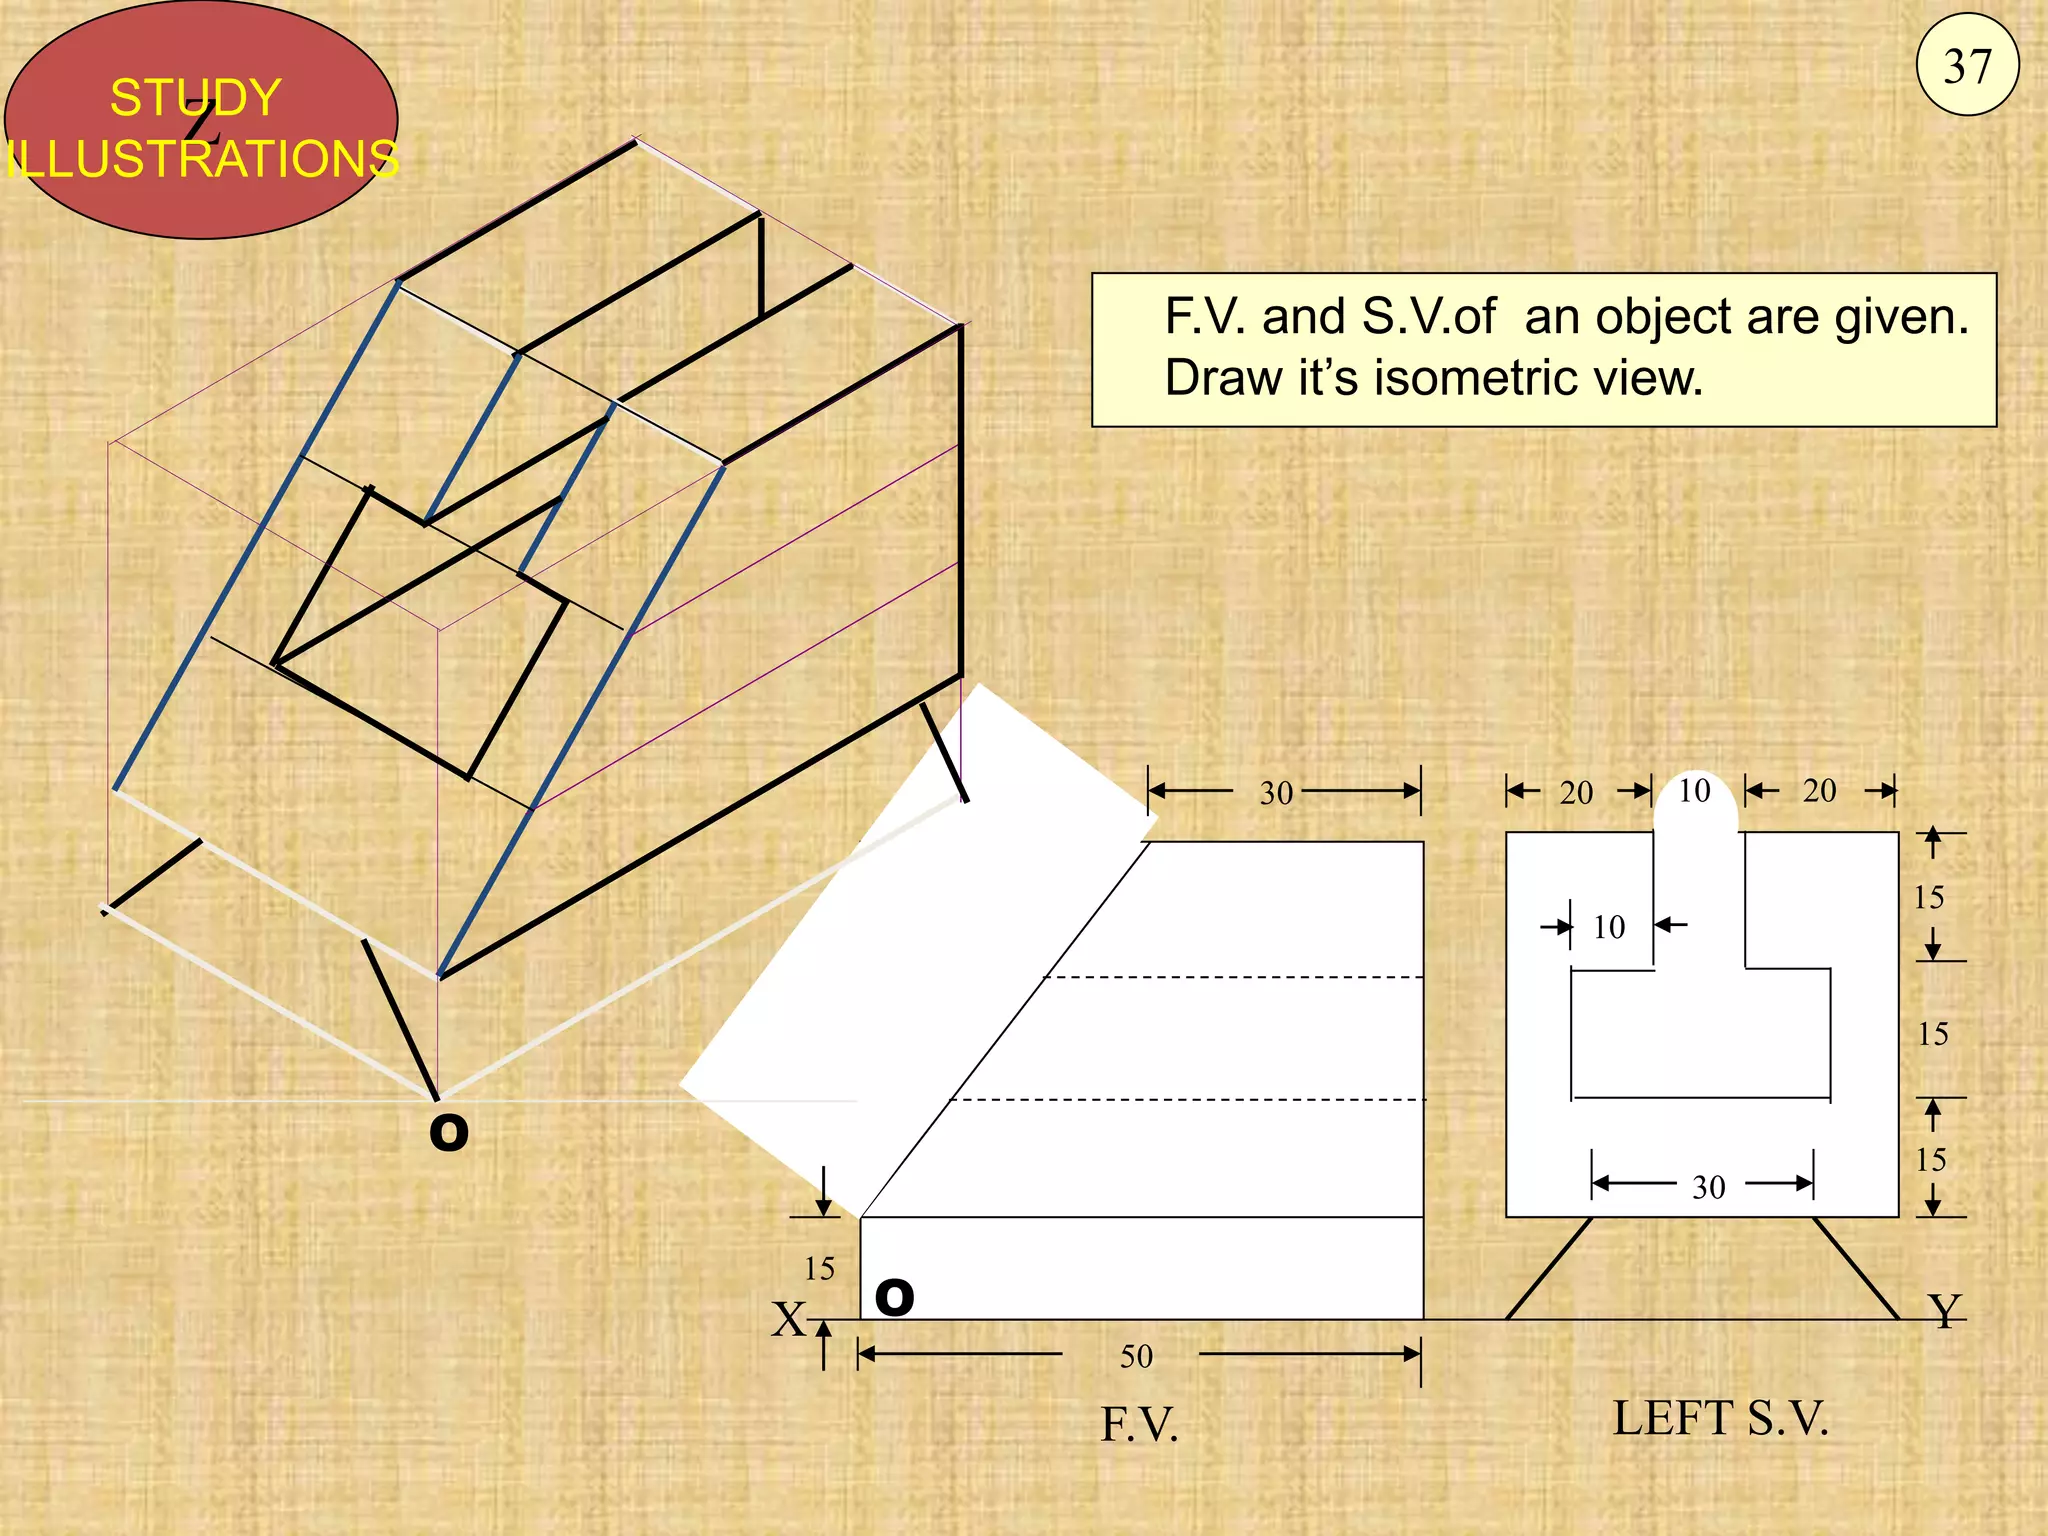
F.V. LEFT S.V.
3020 20
10
15
15
15
30
50
10
15
O
O
F.V. and S.V.of an object are given.
Draw it’s isometric view.
Z
STUDY
ILLUSTRATIONS
37


![ISOMETRIC VIEW ISOMETRIC PROJECTION
H H
TYPES OF ISOMETRIC DRAWINGS
Drawn by using Isometric scale
( Reduced dimensions )
Drawn by using True scale
( True dimensions )
450
300
0
1
2
3
4
0
1
2
3
4
Isometric scale [ Line AC ]
required for Isometric Projection
A B
C
D
CONSTRUCTION OF ISOM.SCALE.
From point A, with line AB draw 300 and
450 inclined lines AC & AD resp on AD.
Mark divisions of true length and from
each division-point draw vertical lines
upto AC line.
The divisions thus obtained on AC
give lengths on isometric scale.](https://image.slidesharecdn.com/9-230616091628-66208be1/75/9-Isometric-Projections-ppt-3-2048.jpg)