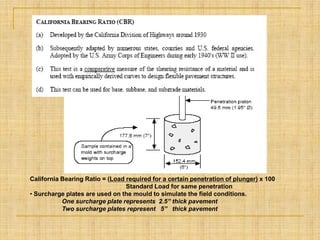
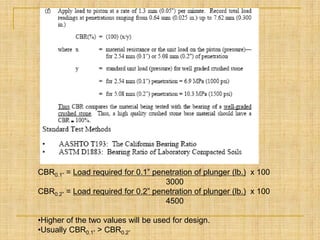
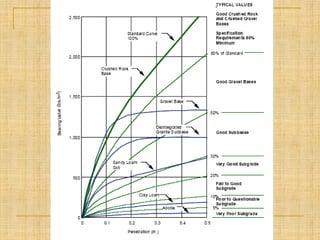
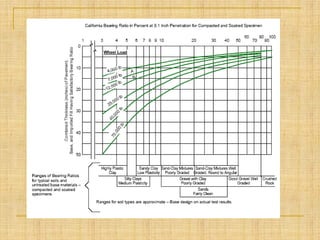
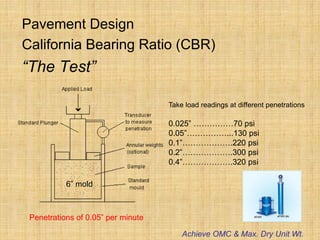
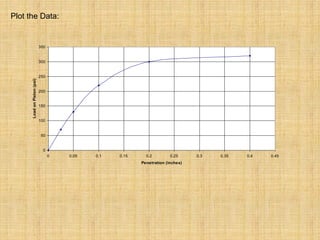
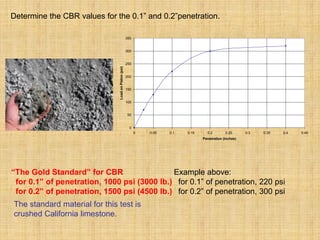
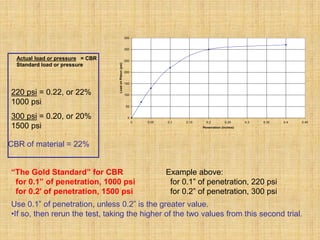
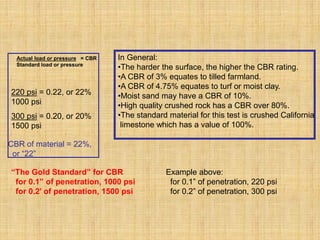
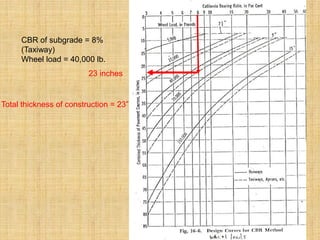
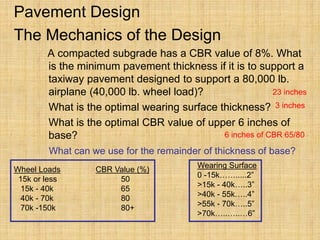
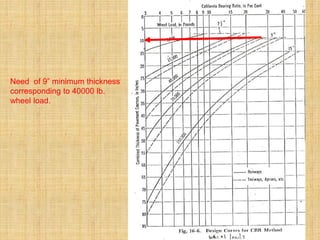
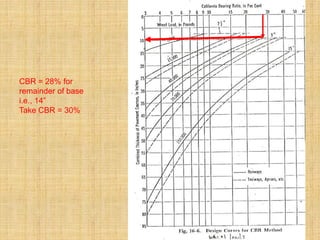
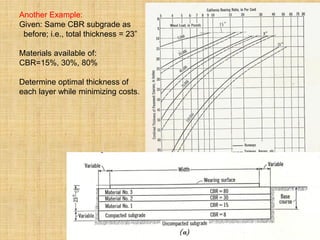
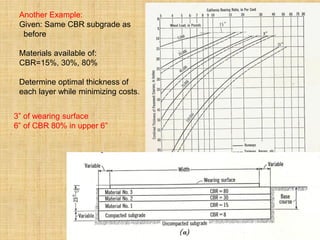
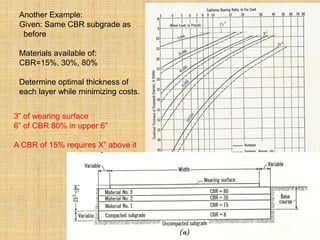
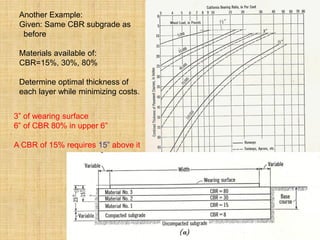
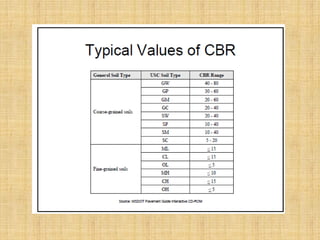
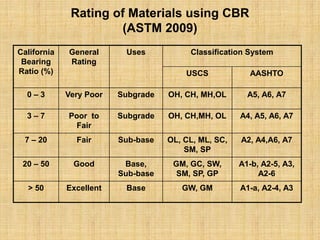
SlideShare a Scribd company logo
1 of 36
Download to read offline
California Bearing Ratio (CBR)
• California Bearing Ratio (CBR) is a penetration test
for evaluation of the mechanical strength of road
subgrades, sub-base and base courses. It was
developed by the California Department of
Transportation.
• The test is performed by measuring the pressure
required to penetrate a sample with a plunger of
standard area. The measured pressure is then divided
by the pressure required to achieve an equal
penetration on a standard crushed rock material.
or
• The test is performed by measuring the load required to
penetrate a sample with a plunger of standard area.
The measured load is then divided by the load required
to achieve an equal penetration on a standard crushed
rock material.
California Bearing Ratio = (Load required for a certain penetration of plunger) x 100
Standard Load for same penetration
• Surcharge plates are used on the mould to simulate the field conditions.
One surcharge plate represents 2.5” thick pavement
Two surcharge plates represent 5” thick pavement
CBR0.1” = Load required for 0.1” penetration of plunger (lb.) x 100
3000
CBR0.2” = Load required for 0.2” penetration of plunger (lb.) x 100
4500
•Higher of the two values will be used for design.
•Usually CBR0.1” > CBR0.2”
Pavement Design
California Bearing Ratio (CBR)
“The Test”
Take load readings at different penetrations
0.025” ……………70 psi
0.05”……………...130 psi
0.1”……………….220 psi
0.2”……………….300 psi
0.4”……………….320 psi
Penetrations of 0.05” per minute
Achieve OMC & Max. Dry Unit Wt.
6” mold
Plot the Data:
0
50
100
150
200
250
300
350
0 0.05 0.1 0.15 0.2 0.25 0.3 0.35 0.4 0.45
Penetration (inches)
Load
on
Piston
(psi)
Determine the CBR values for the 0.1” and 0.2”penetration.
0
50
100
150
200
250
300
350
0 0.05 0.1 0.15 0.2 0.25 0.3 0.35 0.4 0.45
Penetration (inches)
Load
on
Piston
(psi)
“The Gold Standard” for CBR
for 0.1” of penetration, 1000 psi (3000 lb.)
for 0.2” of penetration, 1500 psi (4500 lb.)
Example above:
for 0.1” of penetration, 220 psi
for 0.2” of penetration, 300 psi
The standard material for this test is
crushed California limestone.
0
50
100
150
200
250
300
350
0 0.05 0.1 0.15 0.2 0.25 0.3 0.35 0.4 0.45
Penetration (inches)
Load
on
Piston
(psi)
“The Gold Standard” for CBR
for 0.1” of penetration, 1000 psi
for 0.2’ of penetration, 1500 psi
Example above:
for 0.1” of penetration, 220 psi
for 0.2” of penetration, 300 psi
220 psi = 0.22, or 22%
1000 psi
300 psi = 0.20, or 20%
1500 psi
CBR of material = 22%
Use 0.1” of penetration, unless 0.2” is the greater value.
•If so, then rerun the test, taking the higher of the two values from this second trial.
Actual load or pressure = CBR
Standard load or pressure
“The Gold Standard” for CBR
for 0.1” of penetration, 1000 psi
for 0.2’ of penetration, 1500 psi
Example above:
for 0.1” of penetration, 220 psi
for 0.2” of penetration, 300 psi
220 psi = 0.22, or 22%
1000 psi
300 psi = 0.20, or 20%
1500 psi
CBR of material = 22%,
or “22”
In General:
•The harder the surface, the higher the CBR rating.
•A CBR of 3% equates to tilled farmland.
•A CBR of 4.75% equates to turf or moist clay.
•Moist sand may have a CBR of 10%.
•High quality crushed rock has a CBR over 80%.
•The standard material for this test is crushed California
limestone which has a value of 100%.
Actual load or pressure = CBR
Standard load or pressure
Potential Corrections to the
Stress-Penetration Curves
0
50
100
150
200
250
300
350
0 0.05 0.1 0.15 0.2 0.25 0.3 0.35 0.4 0.45
Penetration (inches)
Load
on
Piston
(psi)
Pavement Design
• CBR values
• Type of use expected
• Expected wheel load during service
• Types of materials available for the
construction
Design Curves for Roads
Design Curves for Runways,
Taxiways, Aprons etc.
Example
A compacted subgrade has a CBR
value of 8%. What is the minimum
pavement thickness if it is to support a
taxiway pavement designed to support
a 80,000 lb. airplane (40,000 lb. wheel
load)?
A point on the curve for a
given CBR material represents
the minimum thickness of
pavement courses that will
reside above it, in order to
maintain stability.
CBR of subgrade = 8%
(Taxiway)
Wheel load = 40,000 lb.
23 inches
Total thickness of construction = 23”
Pavement Design
The Mechanics of the Design
A compacted subgrade has a CBR value of 8%. What
is the minimum pavement thickness if it is to support a
taxiway pavement designed to support a 80,000 lb.
airplane (40,000 lb. wheel load)?
What is the optimal wearing surface thickness?
What is the optimal CBR value of upper 6 inches of
base?
What can we use for the remainder of thickness of base?
Wheel Loads CBR Value (%)
15k or less 50
15k - 40k 65
40k - 70k 80
70k -150k 80+
Wearing Surface
0 -15k…….....2”
>15k - 40k…..3”
>40k - 55k…..4”
>55k - 70k…..5”
>70k…..…..…6”
23 inches
3 inches
6 inches of CBR 65/80
3” 6”
CBR = 80%
Need of 9” minimum thickness
corresponding to 40000 lb.
wheel load.
CBR = 28% for
remainder of base
i.e., 14”
Take CBR = 30%
Materials available for Base:
CBR=30% and 80%
Optimal thickness of each
layer while minimizing costs are
mentioned on the figure below.
Given: Same CBR of subgrade as
before; i.e., total thickness = 23”
Materials available of:
CBR=30%, 80%
Determine optimal thickness of
each layer while minimizing costs.
CBR of 30% needs minimum of 9”
of pavement courses above it.
Given: Same CBR subgrade as
before; i.e., total thickness = 23”
Materials available of:
CBR=30%, 80%
Determine optimal thickness of
each layer while minimizing costs.
3” of wearing surface
6” of CBR 80% in upper 6”
CBR of 30% needs minimum of 9”
of pavement courses above it.
Given: Same CBR subgrade as
before; i.e., total thickness = 23”
Materials available of:
CBR=30%, 80%
Determine optimal thickness of
each layer while minimizing costs.
3” of wearing surface
6” of CBR 80% in upper 6”
14” of CBR 30%
CBR of 30% needs minimum of 9”
of pavement courses above it.
Another Example:
Given: Same CBR subgrade as
before; i.e., total thickness = 23”
Materials available of:
CBR=15%, 30%, 80%
Determine optimal thickness of
each layer while minimizing costs.
Another Example:
Given: Same CBR subgrade as
before
Materials available of:
CBR=15%, 30%, 80%
Determine optimal thickness of
each layer while minimizing costs.
3” of wearing surface
6” of CBR 80% in upper 6”
Another Example:
Given: Same CBR subgrade as
before
Materials available of:
CBR=15%, 30%, 80%
Determine optimal thickness of
each layer while minimizing costs.
3” of wearing surface
6” of CBR 80% in upper 6”
A CBR of 15% requires X” above it
Another Example:
Given: Same CBR subgrade as
before
Materials available of:
CBR=15%, 30%, 80%
Determine optimal thickness of
each layer while minimizing costs.
3” of wearing surface
6” of CBR 80% in upper 6”
A CBR of 15% requires 15” above it
Another Example:
Given: Same CBR subgrade as
before
Materials available of:
CBR=15%, 30%, 80%
Determine optimal thickness of
each layer while minimizing costs.
3” of wearing surface
6” of CBR 80% in upper 6”
A CBR of 15% requires 15” above it
A CBR of 30% requires X” above it
Another Example:
Given: Same CBR subgrade as
before
Materials available of:
CBR=15%, 30%, 80%
Determine optimal thickness of
each layer while minimizing costs.
3” of wearing surface
6” of CBR 80% in upper 6”
A CBR of 15% requires 15” above it
A CBR of 30% requires 9” above it
Example:
Subgrade of CBR=7%,
50,000 lb. wheel load for a taxiway
CBR materials available:
80%, 30%, 15%
Design the pavement with attention
paid to optimizing costs and stability.
Solution:
Total Thickness: 28”
Wearing Surface Thickness: 4”
Upper 6” of CBR=80
CBR 30 of 7” (Thickness above that
material is equal to 10”)
CBR 15 of 11” (Thickness above that
material is equal to 17”)
Homework:
Subgrade of CBR=15%,
70,000 lb. wheel load for a runway
CBR materials available: 80%, 40%, 20%
Design the pavement with attention paid to optimizing costs and stability.
Rating of Materials using CBR
(ASTM 2009)
California
Bearing
Ratio (%)
General
Rating
Uses Classification System
USCS AASHTO
0 – 3 Very Poor Subgrade OH, CH, MH,OL A5, A6, A7
3 – 7 Poor to
Fair
Subgrade OH, CH,MH, OL A4, A5, A6, A7
7 – 20 Fair Sub-base OL, CL, ML, SC,
SM, SP
A2, A4,A6, A7
20 – 50 Good Base,
Sub-base
GM, GC, SW,
SM, SP, GP
A1-b, A2-5, A3,
A2-6
> 50 Excellent Base GW, GM A1-a, A2-4, A3

More Related Content

Similar to 7. Pavement Design using CBR (Remaining Part).pdf

BEST PPT ON TRAINNING ON CONTRUCTION AT INDIAN RAILWAY (DFCC)
BEST PPT ON TRAINNING ON CONTRUCTION AT INDIAN RAILWAY (DFCC)BEST PPT ON TRAINNING ON CONTRUCTION AT INDIAN RAILWAY (DFCC)
BEST PPT ON TRAINNING ON CONTRUCTION AT INDIAN RAILWAY (DFCC)
Utsav Tripathy
 
CON 124 Session 2 - Proportioning Methods
CON 124 Session 2 - Proportioning MethodsCON 124 Session 2 - Proportioning Methods
CON 124 Session 2 - Proportioning Methods
alpenaccedu
 

Similar to 7. Pavement Design using CBR (Remaining Part).pdf (20)

Cc lining
Cc liningCc lining
Cc lining
 
ce742lec_21.pdf
ce742lec_21.pdfce742lec_21.pdf
ce742lec_21.pdf
 
desain perkerasan di bandara
desain perkerasan di bandaradesain perkerasan di bandara
desain perkerasan di bandara
 
civil engineer
civil engineercivil engineer
civil engineer
 
Flexural strength
Flexural strengthFlexural strength
Flexural strength
 
Lesson 11 corrosion new2
Lesson 11 corrosion new2Lesson 11 corrosion new2
Lesson 11 corrosion new2
 
Busbar Design
Busbar Design Busbar Design
Busbar Design
 
Design of bala school
Design of bala schoolDesign of bala school
Design of bala school
 
X10703 (me8593)
X10703 (me8593)X10703 (me8593)
X10703 (me8593)
 
Estimation of CBR value using Dynamic Cone Penetrometer
Estimation of CBR value using Dynamic Cone Penetrometer  Estimation of CBR value using Dynamic Cone Penetrometer
Estimation of CBR value using Dynamic Cone Penetrometer
 
2012 MATC Spring Lecture Series: Mustaque Hossain
2012 MATC Spring Lecture Series: Mustaque Hossain2012 MATC Spring Lecture Series: Mustaque Hossain
2012 MATC Spring Lecture Series: Mustaque Hossain
 
Transportation Engineering
Transportation EngineeringTransportation Engineering
Transportation Engineering
 
COMPARISON BETWEEN CODES
COMPARISON BETWEEN CODESCOMPARISON BETWEEN CODES
COMPARISON BETWEEN CODES
 
bridge final ppt.pptx
bridge final ppt.pptxbridge final ppt.pptx
bridge final ppt.pptx
 
AIV.pptx
AIV.pptxAIV.pptx
AIV.pptx
 
Problems on Torsion
Problems on TorsionProblems on Torsion
Problems on Torsion
 
BEST PPT ON TRAINNING ON CONTRUCTION AT INDIAN RAILWAY (DFCC)
BEST PPT ON TRAINNING ON CONTRUCTION AT INDIAN RAILWAY (DFCC)BEST PPT ON TRAINNING ON CONTRUCTION AT INDIAN RAILWAY (DFCC)
BEST PPT ON TRAINNING ON CONTRUCTION AT INDIAN RAILWAY (DFCC)
 
pressreleasescurprurl1579103474899626198.pdf
pressreleasescurprurl1579103474899626198.pdfpressreleasescurprurl1579103474899626198.pdf
pressreleasescurprurl1579103474899626198.pdf
 
CON 124 Session 2 - Proportioning Methods
CON 124 Session 2 - Proportioning MethodsCON 124 Session 2 - Proportioning Methods
CON 124 Session 2 - Proportioning Methods
 
BSIM - Blow Molding Simulation
BSIM - Blow Molding SimulationBSIM - Blow Molding Simulation
BSIM - Blow Molding Simulation
 

Recently uploaded

01-vogelsanger-stanag-4178-ed-2-the-new-nato-standard-for-nitrocellulose-test...
01-vogelsanger-stanag-4178-ed-2-the-new-nato-standard-for-nitrocellulose-test...01-vogelsanger-stanag-4178-ed-2-the-new-nato-standard-for-nitrocellulose-test...
01-vogelsanger-stanag-4178-ed-2-the-new-nato-standard-for-nitrocellulose-test...
AshwaniAnuragi1
 
21P35A0312 Internship eccccccReport.docx
21P35A0312 Internship eccccccReport.docx21P35A0312 Internship eccccccReport.docx
21P35A0312 Internship eccccccReport.docx
rahulmanepalli02
 
Artificial intelligence presentation2-171219131633.pdf
Artificial intelligence presentation2-171219131633.pdfArtificial intelligence presentation2-171219131633.pdf
Artificial intelligence presentation2-171219131633.pdf
Kira Dess
 

Recently uploaded (20)

UNIT 4 PTRP final Convergence in probability.pptx
UNIT 4 PTRP final Convergence in probability.pptxUNIT 4 PTRP final Convergence in probability.pptx
UNIT 4 PTRP final Convergence in probability.pptx
 
5G and 6G refer to generations of mobile network technology, each representin...
5G and 6G refer to generations of mobile network technology, each representin...5G and 6G refer to generations of mobile network technology, each representin...
5G and 6G refer to generations of mobile network technology, each representin...
 
Seismic Hazard Assessment Software in Python by Prof. Dr. Costas Sachpazis
Seismic Hazard Assessment Software in Python by Prof. Dr. Costas SachpazisSeismic Hazard Assessment Software in Python by Prof. Dr. Costas Sachpazis
Seismic Hazard Assessment Software in Python by Prof. Dr. Costas Sachpazis
 
01-vogelsanger-stanag-4178-ed-2-the-new-nato-standard-for-nitrocellulose-test...
01-vogelsanger-stanag-4178-ed-2-the-new-nato-standard-for-nitrocellulose-test...01-vogelsanger-stanag-4178-ed-2-the-new-nato-standard-for-nitrocellulose-test...
01-vogelsanger-stanag-4178-ed-2-the-new-nato-standard-for-nitrocellulose-test...
 
Geometric constructions Engineering Drawing.pdf
Geometric constructions Engineering Drawing.pdfGeometric constructions Engineering Drawing.pdf
Geometric constructions Engineering Drawing.pdf
 
Databricks Generative AI FoundationCertified.pdf
Databricks Generative AI FoundationCertified.pdfDatabricks Generative AI FoundationCertified.pdf
Databricks Generative AI FoundationCertified.pdf
 
8th International Conference on Soft Computing, Mathematics and Control (SMC ...
8th International Conference on Soft Computing, Mathematics and Control (SMC ...8th International Conference on Soft Computing, Mathematics and Control (SMC ...
8th International Conference on Soft Computing, Mathematics and Control (SMC ...
 
Filters for Electromagnetic Compatibility Applications
Filters for Electromagnetic Compatibility ApplicationsFilters for Electromagnetic Compatibility Applications
Filters for Electromagnetic Compatibility Applications
 
Path loss model, OKUMURA Model, Hata Model
Path loss model, OKUMURA Model, Hata ModelPath loss model, OKUMURA Model, Hata Model
Path loss model, OKUMURA Model, Hata Model
 
Introduction-to- Metrology and Quality.pptx
Introduction-to- Metrology and Quality.pptxIntroduction-to- Metrology and Quality.pptx
Introduction-to- Metrology and Quality.pptx
 
21P35A0312 Internship eccccccReport.docx
21P35A0312 Internship eccccccReport.docx21P35A0312 Internship eccccccReport.docx
21P35A0312 Internship eccccccReport.docx
 
Augmented Reality (AR) with Augin Software.pptx
Augmented Reality (AR) with Augin Software.pptxAugmented Reality (AR) with Augin Software.pptx
Augmented Reality (AR) with Augin Software.pptx
 
Developing a smart system for infant incubators using the internet of things ...
Developing a smart system for infant incubators using the internet of things ...Developing a smart system for infant incubators using the internet of things ...
Developing a smart system for infant incubators using the internet of things ...
 
Basics of Relay for Engineering Students
Basics of Relay for Engineering StudentsBasics of Relay for Engineering Students
Basics of Relay for Engineering Students
 
CLOUD COMPUTING SERVICES - Cloud Reference Modal
CLOUD COMPUTING SERVICES - Cloud Reference ModalCLOUD COMPUTING SERVICES - Cloud Reference Modal
CLOUD COMPUTING SERVICES - Cloud Reference Modal
 
Diploma Engineering Drawing Qp-2024 Ece .pdf
Diploma Engineering Drawing Qp-2024 Ece .pdfDiploma Engineering Drawing Qp-2024 Ece .pdf
Diploma Engineering Drawing Qp-2024 Ece .pdf
 
NO1 Best Powerful Vashikaran Specialist Baba Vashikaran Specialist For Love V...
NO1 Best Powerful Vashikaran Specialist Baba Vashikaran Specialist For Love V...NO1 Best Powerful Vashikaran Specialist Baba Vashikaran Specialist For Love V...
NO1 Best Powerful Vashikaran Specialist Baba Vashikaran Specialist For Love V...
 
Adsorption (mass transfer operations 2) ppt
Adsorption (mass transfer operations 2) pptAdsorption (mass transfer operations 2) ppt
Adsorption (mass transfer operations 2) ppt
 
Artificial intelligence presentation2-171219131633.pdf
Artificial intelligence presentation2-171219131633.pdfArtificial intelligence presentation2-171219131633.pdf
Artificial intelligence presentation2-171219131633.pdf
 
Involute of a circle,Square, pentagon,HexagonInvolute_Engineering Drawing.pdf
Involute of a circle,Square, pentagon,HexagonInvolute_Engineering Drawing.pdfInvolute of a circle,Square, pentagon,HexagonInvolute_Engineering Drawing.pdf
Involute of a circle,Square, pentagon,HexagonInvolute_Engineering Drawing.pdf
 

7. Pavement Design using CBR (Remaining Part).pdf

  • 1. California Bearing Ratio (CBR) • California Bearing Ratio (CBR) is a penetration test for evaluation of the mechanical strength of road subgrades, sub-base and base courses. It was developed by the California Department of Transportation. • The test is performed by measuring the pressure required to penetrate a sample with a plunger of standard area. The measured pressure is then divided by the pressure required to achieve an equal penetration on a standard crushed rock material. or • The test is performed by measuring the load required to penetrate a sample with a plunger of standard area. The measured load is then divided by the load required to achieve an equal penetration on a standard crushed rock material.
  • 2. California Bearing Ratio = (Load required for a certain penetration of plunger) x 100 Standard Load for same penetration • Surcharge plates are used on the mould to simulate the field conditions. One surcharge plate represents 2.5” thick pavement Two surcharge plates represent 5” thick pavement
  • 3. CBR0.1” = Load required for 0.1” penetration of plunger (lb.) x 100 3000 CBR0.2” = Load required for 0.2” penetration of plunger (lb.) x 100 4500 •Higher of the two values will be used for design. •Usually CBR0.1” > CBR0.2”
  • 4.
  • 5.
  • 6. Pavement Design California Bearing Ratio (CBR) “The Test” Take load readings at different penetrations 0.025” ……………70 psi 0.05”……………...130 psi 0.1”……………….220 psi 0.2”……………….300 psi 0.4”……………….320 psi Penetrations of 0.05” per minute Achieve OMC & Max. Dry Unit Wt. 6” mold
  • 7. Plot the Data: 0 50 100 150 200 250 300 350 0 0.05 0.1 0.15 0.2 0.25 0.3 0.35 0.4 0.45 Penetration (inches) Load on Piston (psi)
  • 8. Determine the CBR values for the 0.1” and 0.2”penetration. 0 50 100 150 200 250 300 350 0 0.05 0.1 0.15 0.2 0.25 0.3 0.35 0.4 0.45 Penetration (inches) Load on Piston (psi) “The Gold Standard” for CBR for 0.1” of penetration, 1000 psi (3000 lb.) for 0.2” of penetration, 1500 psi (4500 lb.) Example above: for 0.1” of penetration, 220 psi for 0.2” of penetration, 300 psi The standard material for this test is crushed California limestone.
  • 9. 0 50 100 150 200 250 300 350 0 0.05 0.1 0.15 0.2 0.25 0.3 0.35 0.4 0.45 Penetration (inches) Load on Piston (psi) “The Gold Standard” for CBR for 0.1” of penetration, 1000 psi for 0.2’ of penetration, 1500 psi Example above: for 0.1” of penetration, 220 psi for 0.2” of penetration, 300 psi 220 psi = 0.22, or 22% 1000 psi 300 psi = 0.20, or 20% 1500 psi CBR of material = 22% Use 0.1” of penetration, unless 0.2” is the greater value. •If so, then rerun the test, taking the higher of the two values from this second trial. Actual load or pressure = CBR Standard load or pressure
  • 10. “The Gold Standard” for CBR for 0.1” of penetration, 1000 psi for 0.2’ of penetration, 1500 psi Example above: for 0.1” of penetration, 220 psi for 0.2” of penetration, 300 psi 220 psi = 0.22, or 22% 1000 psi 300 psi = 0.20, or 20% 1500 psi CBR of material = 22%, or “22” In General: •The harder the surface, the higher the CBR rating. •A CBR of 3% equates to tilled farmland. •A CBR of 4.75% equates to turf or moist clay. •Moist sand may have a CBR of 10%. •High quality crushed rock has a CBR over 80%. •The standard material for this test is crushed California limestone which has a value of 100%. Actual load or pressure = CBR Standard load or pressure
  • 11. Potential Corrections to the Stress-Penetration Curves 0 50 100 150 200 250 300 350 0 0.05 0.1 0.15 0.2 0.25 0.3 0.35 0.4 0.45 Penetration (inches) Load on Piston (psi)
  • 12. Pavement Design • CBR values • Type of use expected • Expected wheel load during service • Types of materials available for the construction
  • 14. Design Curves for Runways, Taxiways, Aprons etc.
  • 15. Example A compacted subgrade has a CBR value of 8%. What is the minimum pavement thickness if it is to support a taxiway pavement designed to support a 80,000 lb. airplane (40,000 lb. wheel load)?
  • 16. A point on the curve for a given CBR material represents the minimum thickness of pavement courses that will reside above it, in order to maintain stability.
  • 17. CBR of subgrade = 8% (Taxiway) Wheel load = 40,000 lb. 23 inches Total thickness of construction = 23”
  • 18. Pavement Design The Mechanics of the Design A compacted subgrade has a CBR value of 8%. What is the minimum pavement thickness if it is to support a taxiway pavement designed to support a 80,000 lb. airplane (40,000 lb. wheel load)? What is the optimal wearing surface thickness? What is the optimal CBR value of upper 6 inches of base? What can we use for the remainder of thickness of base? Wheel Loads CBR Value (%) 15k or less 50 15k - 40k 65 40k - 70k 80 70k -150k 80+ Wearing Surface 0 -15k…….....2” >15k - 40k…..3” >40k - 55k…..4” >55k - 70k…..5” >70k…..…..…6” 23 inches 3 inches 6 inches of CBR 65/80
  • 20. Need of 9” minimum thickness corresponding to 40000 lb. wheel load.
  • 21. CBR = 28% for remainder of base i.e., 14” Take CBR = 30%
  • 22. Materials available for Base: CBR=30% and 80% Optimal thickness of each layer while minimizing costs are mentioned on the figure below.
  • 23. Given: Same CBR of subgrade as before; i.e., total thickness = 23” Materials available of: CBR=30%, 80% Determine optimal thickness of each layer while minimizing costs. CBR of 30% needs minimum of 9” of pavement courses above it.
  • 24. Given: Same CBR subgrade as before; i.e., total thickness = 23” Materials available of: CBR=30%, 80% Determine optimal thickness of each layer while minimizing costs. 3” of wearing surface 6” of CBR 80% in upper 6” CBR of 30% needs minimum of 9” of pavement courses above it.
  • 25. Given: Same CBR subgrade as before; i.e., total thickness = 23” Materials available of: CBR=30%, 80% Determine optimal thickness of each layer while minimizing costs. 3” of wearing surface 6” of CBR 80% in upper 6” 14” of CBR 30% CBR of 30% needs minimum of 9” of pavement courses above it.
  • 26. Another Example: Given: Same CBR subgrade as before; i.e., total thickness = 23” Materials available of: CBR=15%, 30%, 80% Determine optimal thickness of each layer while minimizing costs.
  • 27. Another Example: Given: Same CBR subgrade as before Materials available of: CBR=15%, 30%, 80% Determine optimal thickness of each layer while minimizing costs. 3” of wearing surface 6” of CBR 80% in upper 6”
  • 28. Another Example: Given: Same CBR subgrade as before Materials available of: CBR=15%, 30%, 80% Determine optimal thickness of each layer while minimizing costs. 3” of wearing surface 6” of CBR 80% in upper 6” A CBR of 15% requires X” above it
  • 29. Another Example: Given: Same CBR subgrade as before Materials available of: CBR=15%, 30%, 80% Determine optimal thickness of each layer while minimizing costs. 3” of wearing surface 6” of CBR 80% in upper 6” A CBR of 15% requires 15” above it
  • 30. Another Example: Given: Same CBR subgrade as before Materials available of: CBR=15%, 30%, 80% Determine optimal thickness of each layer while minimizing costs. 3” of wearing surface 6” of CBR 80% in upper 6” A CBR of 15% requires 15” above it A CBR of 30% requires X” above it
  • 31. Another Example: Given: Same CBR subgrade as before Materials available of: CBR=15%, 30%, 80% Determine optimal thickness of each layer while minimizing costs. 3” of wearing surface 6” of CBR 80% in upper 6” A CBR of 15% requires 15” above it A CBR of 30% requires 9” above it
  • 32. Example: Subgrade of CBR=7%, 50,000 lb. wheel load for a taxiway CBR materials available: 80%, 30%, 15% Design the pavement with attention paid to optimizing costs and stability. Solution: Total Thickness: 28” Wearing Surface Thickness: 4” Upper 6” of CBR=80 CBR 30 of 7” (Thickness above that material is equal to 10”) CBR 15 of 11” (Thickness above that material is equal to 17”)
  • 33. Homework: Subgrade of CBR=15%, 70,000 lb. wheel load for a runway CBR materials available: 80%, 40%, 20% Design the pavement with attention paid to optimizing costs and stability.
  • 34.
  • 35.
  • 36. Rating of Materials using CBR (ASTM 2009) California Bearing Ratio (%) General Rating Uses Classification System USCS AASHTO 0 – 3 Very Poor Subgrade OH, CH, MH,OL A5, A6, A7 3 – 7 Poor to Fair Subgrade OH, CH,MH, OL A4, A5, A6, A7 7 – 20 Fair Sub-base OL, CL, ML, SC, SM, SP A2, A4,A6, A7 20 – 50 Good Base, Sub-base GM, GC, SW, SM, SP, GP A1-b, A2-5, A3, A2-6 > 50 Excellent Base GW, GM A1-a, A2-4, A3