Download to read offline


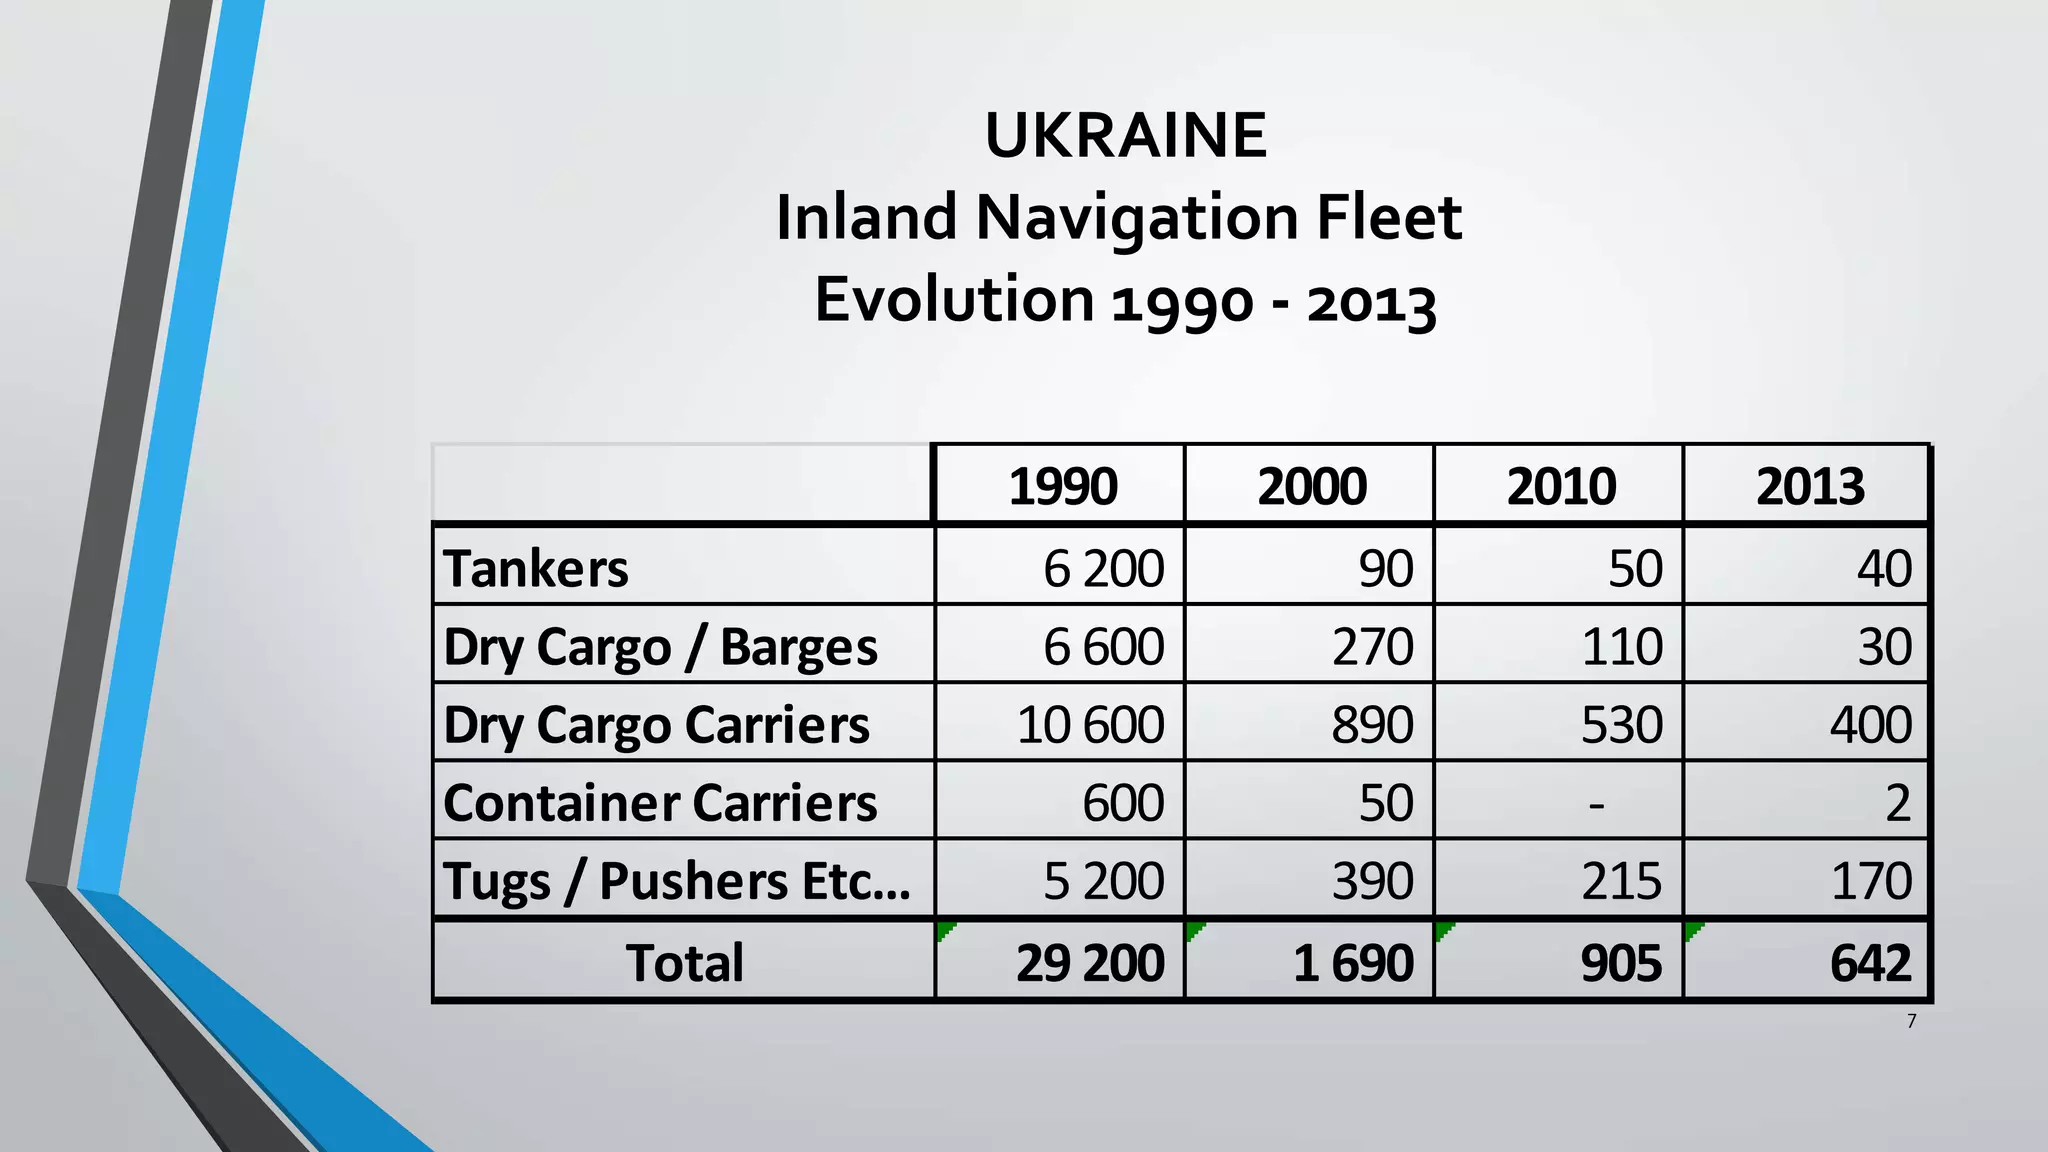


The document discusses the challenges and opportunities related to inland navigation in Ukraine, highlighting the modal split of transportation from 2004 to 2014 and the evolution of the inland navigation fleet from 1990 to 2013. It identifies various constraints including structural, technical, economic, and regulatory issues that hinder efficient logistics in the sector. Recommendations are provided for improving infrastructure and regulatory frameworks to enhance the performance of inland waterways logistics.


