Download as PDF, PPTX


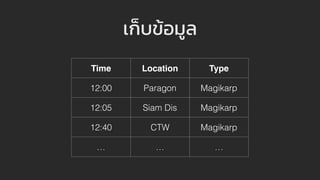
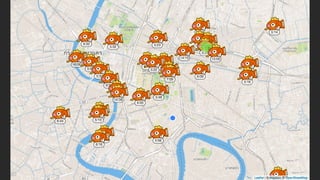


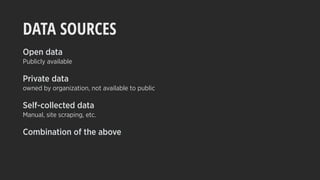

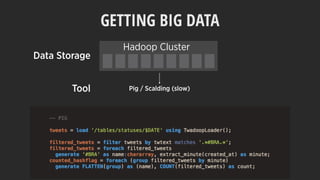
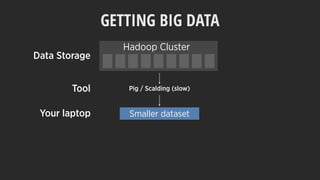
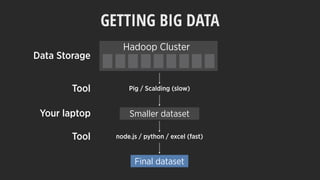

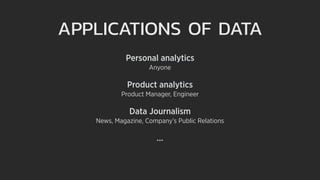


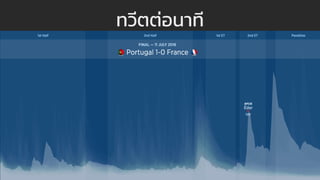
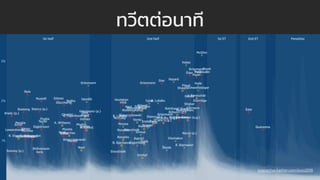


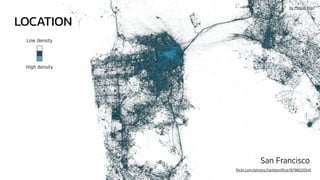
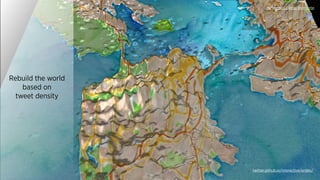


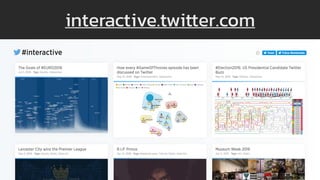

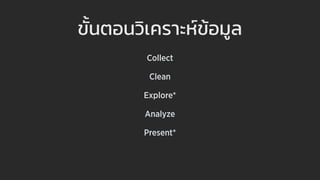
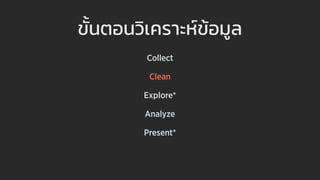

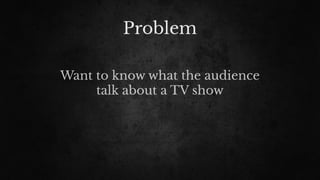

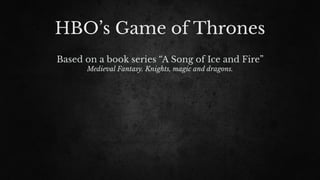

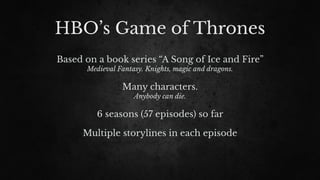
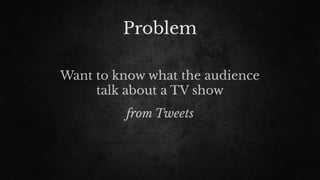
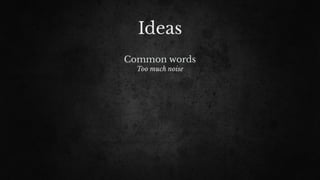
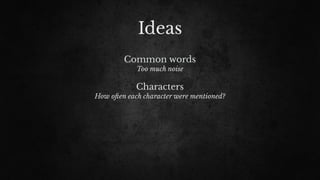

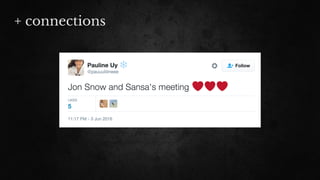
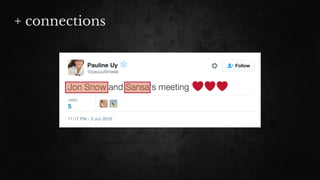
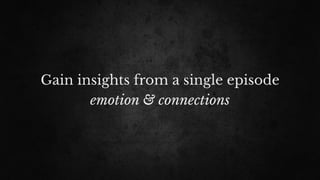
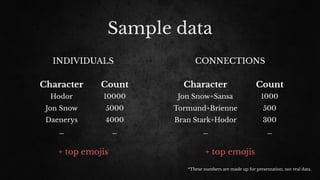
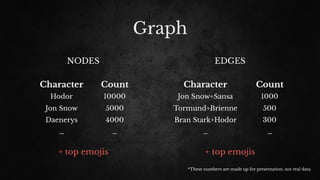
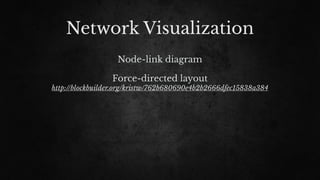

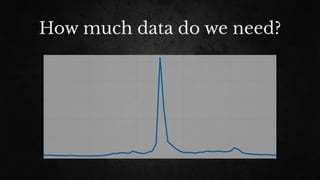

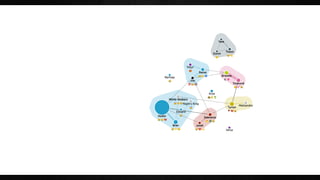
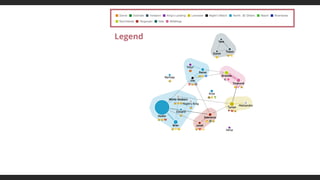
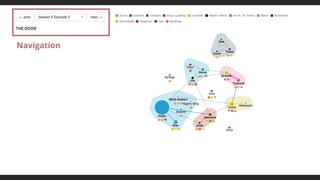
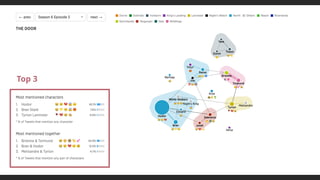
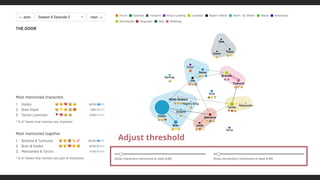
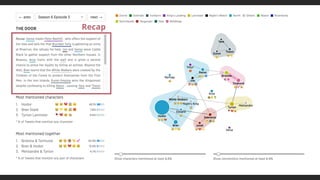
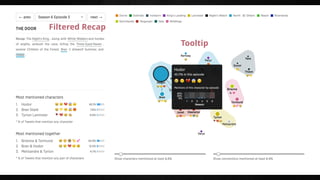
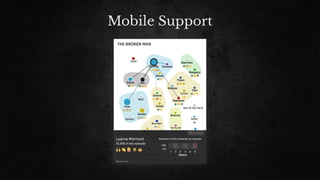

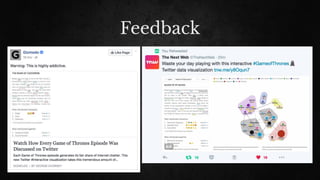
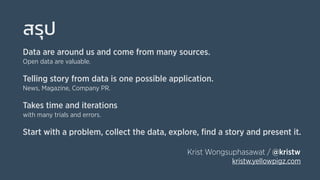
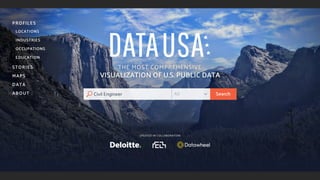
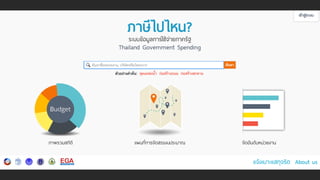


This document discusses storytelling with data and data visualization. It begins with an introduction to the speaker and their background. It then covers topics like data sources, challenges in working with big data, applications of data analysis, examples of data stories, the data analysis process, and a case study analyzing tweets about the TV show Game of Thrones. Throughout there are references to iterating on prototypes and using feedback to improve. The overall message is that telling stories from data takes collecting relevant data, exploring it through multiple iterations, and presenting insights in an engaging way.


![[DSC Europe 25] Borko Kozomora - Optimizing business workflows with advances ...](https://cdn.slidesharecdn.com/ss_thumbnails/hbgekyb0txw0xpo4yfml-borko-kozomora-leading-ai-transformation-260122103838-cc29ee38-thumbnail.jpg?width=640&height=640&fit=bounds)


![[DSC Europe 25] Paula Garcia Esteban -Building the Future: The Role of Data S...](https://cdn.slidesharecdn.com/ss_thumbnails/9ld1r1bsqpwve8qfvphy-paula-garcia-esteban-building-the-future-260122103838-4171f5cb-thumbnail.jpg?width=640&height=640&fit=bounds)

