Download to read offline


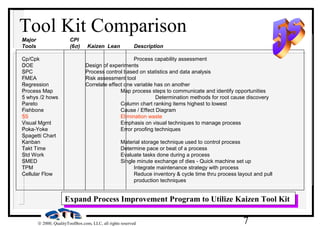


The document discusses strategies for performance excellence including 5S implementation. It provides an overview of 5S which includes five elements: systematic organization, sorting visual placement, scrubbing clean, standardizing control, and self-discipline control. The purpose of 5S is to eliminate waste through bringing order and cleanliness to the workplace.


![Process Capability[1]](https://cdn.slidesharecdn.com/ss_thumbnails/processcapability1-1226090261326164-9-thumbnail.jpg?width=640&height=640&fit=bounds)