Lean Six Sigma applications in healthcare require an understanding of how the tools and methodologies translate to the people-intensive processes of patient care. Once applied, the possibilities are endless. Using real-world examples of the most common types of errors in clinical services, participants will learn how the DMAIC structure within Lean Six Sigma will lead them to solutions that will prevent future errors.
Application of Six Sigma on the Cricket Field.
This is a sample case study to demonstrate the application of Six Sigma methodology and tools for process improvement.
Six Sigma is
the powerpoint presentaion that i make during my 3rd yr. The format of
this presentation is truly professional. You can adopt this format for
your future presentations. You too can modify these. Alright.
So just keep going.
Live in flow
~rise and shine~
FISH BONE DIAGRAM IS OFTEN USED FOR SOLVING PROBLEMS AND IS ALSO AN IMPORTANT TOPIC FOR M.D. COMMUNITY MEDICINE POST GRADUATES .THIS PRESENTATION COULD BE OF SOME HELP TO THEM .
Quality and safety improvement leads directly to
better patient outcomes, improves operational productivity,
increases patient and staff satisfaction, and reduces costs.
This unique program is designed to advance quality and
safety in your organization.
Government ministries, hospitals, health systems,
and universities are working with Joint Commission
International® ( JCI) to bring evidence-based education
to staff through JCI’s Health Care Quality Management
& Patient Safety Diploma Program.
ATHENTECH hospital information management system is one of the india's fastest growing technology company. This software fully automated and it create paper less environment for your organization. for demo call radhakrishna ::9866111173
Improvement of Hospital Project Cost and Schedule Mgmt Final RptEd Kozak
Of pressing concern to the CFO of our client hospital were the spending issues and schedule
slippages of internal implementation projects--issues that he felt contributed to the
current cash flow problem of the hospital that would grow to an even greater problem if
EMR capabilities weren’t fully implemented and operational by 2015. The CFO solicited
external help to 1) validate why there has existed such a level of overspending and
schedule slippage on projects, 2) propose a recommendation for solutions, and 3) change
the existing process to ensure better project budget and schedule control in the long run.
Successful Projects For Leaders (SP4L) had been hired as a consultant to assess what
went wrong with that implementation and to improve how projects in general would be
conducted so that it could move forward with the EMR project successfully. By using a systematic approach, we identified several areas in the project Initiation-Planning-Execution-Control-Closing process that needed modification. The net result is
better project cost and schedule performance, leading to better cash flow budgeting and
planning, with an expected savings of more than $350,000 annually as well as improved
acceptance and ownership by the end-users. Based on the proactive response to their
issues, the CFO, CNO, and PCCs are satisfied and are serving as excellent centers of
influence for the rest of Senior Management and the nursing staff, respectively.
Six Sigma Project Case Study Overview, from the General Electric "At the Customer, For the Customer" Six Sigma Program, led by Lean Six Sigma Master Black Belt and President of the International Standard for Lean Six Sigma (ISLSS) and Owner of the Lean Six Sigma Group
Workflow Continuity—Moving Beyond Business Continuityin a Mu.docxambersalomon88660
Workflow Continuity—Moving Beyond Business Continuity
in a Multisite 24–7 Healthcare Organization
Brian J. Kolowitz & Gonzalo Romero Lauro &
Charles Barkey & Harry Black & Karen Light &
Christopher Deible
Published online: 6 July 2012
# Society for Imaging Informatics in Medicine 2012
Abstract As hospitals move towards providing in-house
24×7 services, there is an increasing need for information
systems to be available around the clock. This study inves-
tigates one organization’s need for a workflow continuity
solution that provides around the clock availability for in-
formation systems that do not provide highly available
services. The organization investigated is a large multifacil-
ity healthcare organization that consists of 20 hospitals and
more than 30 imaging centers. A case analysis approach was
used to investigate the organization’s efforts. The results
show an overall reduction in downtimes where radiologists
could not continue their normal workflow on the integrated
Picture Archiving and Communications System (PACS)
solution by 94 % from 2008 to 2011. The impact of un-
planned downtimes was reduced by 72 % while the impact
of planned downtimes was reduced by 99.66 % over the
same period. Additionally more than 98 h of radiologist
impact due to a PACS upgrade in 2008 was entirely elimi-
nated in 2011 utilizing the system created by the workflow
continuity approach. Workflow continuity differs from high
availability and business continuity in its design process and
available services. Workflow continuity only ensures that
critical workflows are available when the production system
is unavailable due to scheduled or unscheduled downtimes.
Workflow continuity works in conjunction with business
continuity and highly available system designs. The results
of this investigation revealed that this approach can add
significant value to organizations because impact on users
is minimized if not eliminated entirely.
Keywords Workflow continuity . Business continuity .
PACS planning . PACS integration . PACS downtime
procedures . PACS administration . PACS . PACS service .
Software design . Systems integration . Workflow .
Productivity . Management information systems .
Information system . Image retrieval . Health level 7 (HL7) .
Efficiency
Background
Recently, the US government mandated the use of health
information technology for healthcare providers [1]. The
legislation outlines financial penalties for providers that
choose not to adopt technologies as well as benefits for
those that do adopt the technologies. As the adoption of
health information technology increases, so will the need for
information systems that allow critical organizational work-
flows to continue when those systems are unavailable due to
either scheduled or unscheduled system downtimes.
This paper is a case analysis of one organization’s solu-
tion to a need for a system that provides workflow continu-
ity around the clock. Workflow continuity moves beyond.
This is a study case in all the photosthe SIPOC diagram bel.pdfjkcs20004
This is a study case in all the photos
the SIPOC diagram bellow is incomplete and wrong I need to fix it
Perfect Match TEAM APPLIES n January 2008, the University of Toledo Medical Center
(UTMC) in northwest Ohio collaborated with the University of Toledo's Industrial SIX SIGMA
TO Engineering Department to analyze and improve the preoperational processes for patients
undergoing kidney transplants. Six Sigma was applied to the REDUCE TIME project, and the
following goals were established: IT TAKES TO - Optimize cycle times. QUALIFY PATIENTS
- Enhance customer satisfaction. - Improve efficiencies. FOR KIDNEY - Reduce costs.
TRANSPLANTS - Streamline administrative processes. - Eliminate errors. - Improve protocol
execution and effectiveness. The project's primary metric was the number of days required from
the date a patient was referred to UTMC for a kidney transplant to the date the hospital staff
declared the patient a suitable transplant candidate. The research By Matthew was needed and
the project selected because of an increase in the number of Franchetti and year because of the
increased service area for UTMC. Because of a waiting list of nearly 500 patients, it was
determined a reduced cycle time would save lives. Kyle Bedal, Background and terminology
University of For more than 30 years, UTMC has performed adult and pediatric kidney Toledo
transplants as one of the treatment options for end-stage renal disease. Since UTMC's first
kidney transplant operation in 1972, more than 1,500 kidney transplant operations have been
performed there, with an average patient survival rate of 98% and a graft survival rate of 94%.
The program relies on advanced surgical techniques-including laparoscopic kidney donation,
improved anti-rejection medications and high-quality patient care-to make it one of the most
successful programs in the country. There are a number of steps patients must complete before
receiving a kidney transplant. Generally, the patient must be referred to a medical center and
complete required labs and tests to determine if he or she is suitable. The labs and tests are
usually similar among all transplant centers and among patients. The labs include tuberculosis
(TB) tests, dental clearance, a colonoscopy, chest X-rays, electrocardiography tests, stool
samples, blood work, mammograms, pap smears and diabetes tests. Once the patient fulfills the
requirements, a committee reviews the results and determines whether the patient is a good
candidate. The patient is then allowed to receive a kidney; this is called being "listed," or placed
on the waiting list.
Fil TB EK Often, the time required to complete these health Partnering With Your Transplant
Team, The Patient's Guide screenings is up to nine months. In addition, another to
Transplantation. 2 two years may pass after the patient is listed before a The team deployed the
define, measure, analyze, kidney transplant is performed. improve and control (DMAIC)
approach for this Six It is.
1. Patient Safety is a health care professionals’ duty. A sur.docxSONU61709
1. Patient Safety is a health care professionals’ duty. A surgical team’s duty is the “…functioning of the unit and provide safety and well-being to the person who will submit to a surgical procedure” (Ventin Amorim Oliveira, Nunes Oliveira, Guedes Fontoura, et al, 2017). Surgical and treatment errors occur due to underlying causes. For instance, the failure to properly sterilize medical instruments following surgeries. Porter Adventist Hospital in Denver have notified some patients whom have been exposed to HIV, hepatitis B or hepatitis C in breaches that occurred during the time frame of July 21, 2016 and February 20th (CNN Wire, 2018).
2. Due to this error, stakeholders that were affected were the possible affected patients. The article from CNN Wire stated that the surgeries were “…found to be inadequate, which may have compromised the sterilization of the instruments” (CNN Wire, 2018). Highest risk is in hospital surgical rooms at which, “In patients who went through surgical interventions, 14-17% all hospital-acquired infections are comprised of “Surgical Area Infections”” (Ay & Gencturk, 2018). Due to the complex environments of hospitals and operating rooms, preventative factors must be to follow protocols and assure patients that they are in a safe environment to undergo the surgical procedures.
3. What information is needed to perform a root cause analysis?
Quality improvement involves numerous perspectives to detect root causes and develop optimum solutions for triumph. “A root cause analysis is used to find out what happened, why it happened, and determine what changes need to be made to improve performance” (U.S. Department of Veterans Affairs, 2018). Several pieces of information are required to perform a root cause analysis. Some of the information that might be helpful consists of “incident reports, risk management referrals, patient or family complaints, and health department citations” (Centers for Medicare & Medicaid Services, 2011). Collecting data helps prove there is a problem and helps determine how long the problem has existed, as well as how it has impacted the organization.
4. Which tool would you use to create a root cause analysis? Why?
“Root cause analysis is increasingly being used in health and social services to improve safety and quality and minimize adverse events” (Pearson, 2005). The tool that would best work to create a root cause analysis would be a cause and effect chart such as a fishbone analysis. “This process elicits root causes rather than just symptoms and results in a detailed visual diagram of all the possible causes of a particular problem” (Phillips & Simmonds, 2013). The reason a fishbone analysis would be used to create a root cause analysis is because it helps explore the issue in detail, which often will demonstrate possible solutions that might have been previously excluded. “Fishbone analysis provides a template to separate and categorize possible causes of a probl ...
Develop a schedule for a healthcare website redesign project. Where .pdfSALES97
Develop a schedule for a healthcare website redesign project. Where the scope of the project is to
create a new portal for an enhanced healthcare management system that would be available to all
Doctors when treating a resident of the current state of practice. This software will make a
person medical record readily assessable to all Medical Doctors with a current and valid NPI
(National Practitioner .
Data to include:
• Phases and Activities/Tasks/Work Packages
• Key milestones • Names and descriptions for defined activities
• Start and End Dates
• Assigned Resources
• Duration in days
• Effort (in Microsoft Project, this is called Work) in hours In defining resources, include a total
for all work assigned to each resource in hours and a total cost for each resource. Aggregated
costs:
• Materials (if used)
• Staff
• Facilities (if appropriate) In assessing the final project, you will be expected to include the
following:
• Decomposition of project work into Phases and Activities
• Tasks that are linked using predecessor/successor dependencies
• Balanced resources -- no one resource is carrying the whole project or constraining the
schedule
• Effort, resources, and duration defined for every defined lowest-level task has. In addition,
consider the effect on the project of adjusting the schedule to deal with the status problems you
selected for the assignment in Module 6. Provide a paragraph describing the tactics you would
use to revise or crash the project schedule to respond to each problem, and include an assessment
of the overall impact on the project and its completion date. Include an additional paragraph
discussing at least one possible idea for shortening the project duration, with an assessment of
how much earlier you might be able to complete the work and what the overall costs and other
consequences would be to the project.
Solution
The delivery of health care has been quantified with the model, \"structure + process =
outcome.\"14 Present measurement systems may focus on any one of the components.
\"Structure\" in health care delivery can refer to the physical plant or the organizational structure
such as in credentialing. The Joint Commission for Accreditation of Healthcare Organizations
(JCAHO), despite the recent emphasis on performance improvement, is an example of an
association examining structure. 15 \"Processes\" are specific patient interventions performed by
health care professionals and resulting in an outcome. Some examples of processes are childhood
immunization, use and timing of thrombolytic agents in acute myocardial infarction (AMI),
mammography, and patient length of stay in the emergency department. \"Outcomes\" are the
result of the patient\'s interaction with health care professionals. Examples of clinical outcome
measures include mortality or length of stay associated with medical diagnoses or surgical
procedures, readmission rates, morbidity measures such as stroke after carotid endarterectomy,
and unplanned.
Stellar Performer Seattle Childrens Hospital and Regional Medica.docxwhitneyleman54422
Stellar Performer: Seattle Children's Hospital and Regional Medical Center Hospital wide Process Redesign Virginia Klamon The growth in project management is powered by the speed of change in every sector of the American economy. The techniques traditionally applied to the manufacturing or aerospace industries are proving equally valuable in the services sector, particularly when applied to process redesign or improvement efforts.
Children's Hospital of Seattle, Washington, a regional leader in pediatric medical services, initiated a large-scale redesign of its patient management process due to mounting customer complaints and signs of deteriorating employee morale. The hospital organized a team to undertake the effort of redesigning patient management systems and named the project “Encounters.” The new system would streamline and standardize processes such as admitting, registration, scheduling, and insurance verification. The goal was to make things easier and more efficient at Children's, from the initial call from a family or doctor to the visit or stay, and following discharge.
Stage One: Diagnostic Assessment From August to November the project team performed a diagnostic assessment as stage one of the effort. The team gathered customer feedback data, interviewed key organization stakeholders, created a process map of the current system, and identified external business needs driving current industry changes. The primary deliverable from this stage was the project charter. This document included a scope definition, process goals and objectives, project approach, resource requirements, cost-benefit assessment, and risk matrix. The project scope definition included the boundaries of the organizational change and the work required to accomplish it.
Stage Two: Preliminary Design The project team quickly moved to the second stage— preliminary design— once the project charter was drafted and approved. Using creative thinking and proven process modeling tools, the team was ready to move forward to design a new patient management system. During this stage each new process link was painstakingly identified and documented. An iterative approach allowed successive design ideas to be layered in on top of the ever-developing process model. Patient scenarios were used to test the evolving design, allowing the team to walk through each step patients would encounter as they were admitted or treated. Stakeholder involvement is critical to organizational redesign, particularly during the development of the preliminary design, the new conceptual process model. To promote involvement and stakeholder input, a display room was open 24 hours a day, seven days a week. From March through July, employees, patients, and physicians were invited to view the new preliminary design. Feedback was encouraged and received, creating repeated design adjustments throughout the phase.
Stage Three: Detailed Design From July through December the team drilled the new processe.
Data/image9-45.png
Data/image7-31.png
Data/image4-47.png
Data/image5-43.jpeg
Data/image1-39.jpeg
Data/image6-37.jpeg
Data/image8-35.jpeg
Data/image3-33.jpeg
Data/image2-41.jpeg
Data/PresetImageFill5-29.jpg
Data/PresetImageFill2-26.jpg
Data/PresetImageFill4-28.jpg
Data/image9-small-46.png
Data/PresetImageFill0-24.jpg
Data/PresetImageFill1-25.jpg
Data/PresetImageFill3-27.jpg
Data/image7-small-32.png
Data/image4-small-48.png
Data/image5-small-44.jpeg
Data/image1-small-40.jpeg
Data/image3-small-34.jpeg
Data/image6-small-38.jpeg
Data/image8-small-36.jpeg
Data/image2-small-42.jpeg
Data/bullet_gbutton_gray-30.png
Index/Document.iwa
Index/ViewState.iwa
Index/CalculationEngine.iwa
Index/DocumentStylesheet.iwa
Index/AnnotationAuthorStorage.iwa
Index/DocumentMetadata.iwa
Index/Metadata.iwa
Metadata/Properties.plist
Metadata/DocumentIdentifier
6DB344BA-86A7-41D7-B3DF-990FCE2BFAB3
Metadata/BuildVersionHistory.plist
docx
M11.0-7030.0.94-2
preview.jpg
preview-micro.jpg
preview-web.jpg
HSA-6197 Health Information System and Electronic Health Records Week 4
Critical Reflection Paper: Chapters 7 & 8
·
Objective: To judgmentally reflect your understanding of the readings and your skill to apply them to your Health care Setting.
ASSIGNMENT GUIDELINES (10%):
Students will censoriously scrutinize the readings from Chapter 7and 8 in your textbook. This project is planned to help your assessment, analysis, and apply the readings to your Health Care Organization as well as become the foundation for all your outstanding jobs.
You need to read the chapters assigned for week 4 and develop a 2-3-page paper reproducing your understanding and ability to apply the readings to your Health Care Organization. Each paper must be typewritten with 12-point font and double-spaced with standard margins. Follow APA style 7th edition format when referring to the selected articles and include a reference page.
EACH PAPER SHOULD INCLUDE THE FOLLOWING:
1. Introduction (25%) Deliver a short-lived synopsis of the meaning (not a description) of each Chapter and articles you read, in your own words.
2. Your Critique (50%)
What is your reaction to the content of the articles?
What did you learn about Medical Coding and the Purpose of ICD-9-CM?
What did you learn about PPO, HMO and POS Health Plans?
Did these Chapter and articles change your thoughts about Third-Party Payers? If so, how? If not, what remained the same?
3. Conclusion (15%)
Briefly summarize your thoughts & conclusion to your critique of the articles and Chapter you read. How did these articles and Chapters impact your thoughts on the purpose of an electronic encounter form in an EHR.
Evaluation will be based on how clearly you respond to the above, in particular:
a) The clarity with which you critique the chapters.
b) The depth, scope, and organization of your paper; and,
c) Your conclusions, including a description of the impact of these articles and Chapters on any He ...
Requirements Workshop Agenda
eGrants Project
Date, Time & Location
Objective and Scope
To …
Item
Person/Role
Minutes
1
2
3
4
5
6
lean.org Lean Enterprise Institute 1
Medtronic Neruomodulation at a Glance
Minneapolis HQ
$1.5 billion (FY2010) revenue
10% of Medtronic‟s revenue
140 suppliers
Developed from Medtronic‟s expertise in
heart electrical stimulation
Key products:
o implantable neurostimulators send mild
electrical impulses to the spine, masking
pain messages
o implantable drug pumps deliver pain
medication directly to the fluid around
the spinal cord at a fraction of an oral
dose.
Implantable treatments are reversible; a
doctor can turn off or remove the system.
Patients can try therapies temporarily to test
effectiveness before getting a permanent
implant.
Lean management case studies series
Using Plan-Do-Check-Act as a Strategy and Tactic for Helping
Suppliers Improve
Lean Thinkers are familiar with the scientific process of plan-do-check act (PDCA) as a method
that guides problem solving on the shop floor or office. But Medtronic‟s Neuromodulation
business not only uses PDCA for shop-floor problem solving, it also uses the process to guide
overall strategy for selecting and developing key suppliers.
As a maker of surgically implantable medical devices, such as electrical stimulators and drug
pumps, that alleviate pain, Neuromodulation (Neuro) depends on suppliers, many of whom
deliver critical components or finished goods. Continuously improving their performance is vital.
“Medtronic is on a lean journey and we‟d
like our strategic suppliers to be on that
journey with us,” said William Hooper,
Medtronic vice president of operations and
supply chain. “We can‟t be successful
unless our strategic suppliers are
successful.” For example, he noted that
analyses of field reliability problems
showed that “a quarter to a third” were
attributable to supplier quality issues.
“Not only do we have to lift our capability
in quality and field performance, but we
need to lift our suppliers‟ performances,”
Hooper said.
Besides improving supplier performance, a
strategic PDCA approach helps Neuro:
Align supplier development
activities with business
requirements as defined by Neuro‟s
director of global supply chain.
Create a standard approach to the selection, status, and tracking of supplier development
activities.
lean.org Lean Enterprise Institute 2
Plan-do-check-act is
often illustrated as a
continuous cycle.
Deliver real-time visual status of activities to Neuro stakeholders.
The approach is “modeled after the Toyota Production System strategy of treating suppliers as
partners,” said Jeff Hans, director of Neuro‟s global supply chain. Before adopting a strategic
PDCA methodology two years ago, engineers developing suppliers worked in a “heads-down,
.
Organize a ProjectTop of FormBottom of FormAssignment Conten.docxLacieKlineeb
Organize a Project
Top of Form
Bottom of Form
Assignment Content
Top of Form
This assignment is intended to help you use leadership skills to gather project members from cross-functional departments and skill sets and lead them in the fulfillment and implementation of a mock project.
Discover the various responsibilities of a project manager by organizing a project. See Chapter 19, sections 19.9 and Cases.
Apply project management tools and a PM outline type of your choice to structure and plan the project by defining, planning, and controlling. The project will be a continuation of how to improve the process you chose in Weeks 1 and 2.
Essay will include 10 – 12 paragraphs with the following as subtitles:
· Introduction
· Project description
· Project Management Charts (Critical Path, Gant Chart, etc.)
· Improved Process Flowchart from Week 1
· Meeting cadence/rhythm and timing
· Metrics to measure the project’s success
· Financial and budgetary considerations
· Description of the project reporting structure
· Conclusion
Cite at least four (4) peer-reviewed references to support your assignment.
Format your assignment according to APA guidelines.
Bottom of Form
image7.png
image8.png
image1.png
image2.png
image3.png
image4.png
image5.png
image6.png
OPS/574 v1
Process Improvement Flowchart
OPS/574 v1
Page 2 of 2
Process Improvement FlowchartAs-Is Process Flowchart Evaluation
Select a process from an organization you work for or are familiar with. You will use this process in your Week 2 and Week 4 Assignments as well.
Create a flowchart of the as-is process using Microsoft® Word, PowerPoint®, Visio®, or Excel®. Insert your flowchart below this line.
Patient arrives at the hospital
Check-in at registration desk
Registration asks the patient for ID and insurance card(s)
Not on schedule, walk-in
New registration
On schedule
Recorded on the records book
Presents the issued notebook to the various departments for recording
Presents the book and receives the prescribed treatment
Patient leaves the hospital
Evaluate the efficacy of your process using process improvement techniques. Write your evaluation below this line.
I think that the current method for registration is outdated. To arrive a patient for services, the technique is currently straight forward and organized as the flowchart. Additional step could be taken to increase data transmission and accelerate the overall registration processes.Process Improvement Flowchart
Determine how the process can be improved
based on the results of your evaluation.
I could improve this approach by asking comprehensive questions during each patient encounter. This is so I could learn the registration process as much as possible. Learning through observation and physically registering patients would be the most informative Furthermore, this will reduce the number of call.
OPS574 v1Process Improvement FlowchartOPS574 v1Page 2 of 2.docxLacieKlineeb
OPS/574 v1
Process Improvement Flowchart
OPS/574 v1
Page 2 of 2
Process Improvement FlowchartAs-Is Process Flowchart Evaluation
Select a process from an organization you work for or are familiar with. You will use this process in your Week 2 and Week 4 Assignments as well.
Create a flowchart of the as-is process using Microsoft® Word, PowerPoint®, Visio®, or Excel®. Insert your flowchart below this line.
Patient arrives at the hospital
Check-in at registration desk
Registration asks the patient for ID and insurance card(s)
Not on schedule, walk-in
New registration
On schedule
Recorded on the records book
Presents the issued notebook to the various departments for recording
Presents the book and receives the prescribed treatment
Patient leaves the hospital
Evaluate the efficacy of your process using process improvement techniques. Write your evaluation below this line.
I think that the current method for registration is outdated. To arrive a patient for services, the technique is currently straight forward and organized as the flowchart. Additional step could be taken to increase data transmission and accelerate the overall registration processes.Process Improvement Flowchart
Determine how the process can be improved
based on the results of your evaluation.
I could improve this approach by asking comprehensive questions during each patient encounter. This is so I could learn the registration process as much as possible. Learning through observation and physically registering patients would be the most informative Furthermore, this will reduce the number of calls that must be made when information s missed.
Define metrics and measure the current process. Insert the metrics and measures below this line.
"A process metric is a quantitative indicator of a process's efficiency and effectiveness. For every observer or creator of a process, the three most important indicators are inventory, flow rate, and flow time (Cachon & Terwiesch, 2020, Chapter 2).
Improve the process by employing process improvement techniques. Make a process flowchart of the revised procedure using Word, PowerPoint, Vizio, or Excel. If you take measurements of a process and then use your expertise to predict how it will function in the future, you will succeed.
Use process improvement techniques to improve the process. Create a flowchart of the improved process using
Microsoft Word, PowerPoint, Visio, or Excel. Use your professional judgment to ascertain how the future process will perform according to your metrics. Insert new flowchart below this line.
Patient arrives at the hospital
Check-in at registration desk
Registration asks the patient for ID and insurance card(s)
On schedule
Not on schedule, walk-in
New registration
Registration locates patent’s medical record in the system
Patient waits to be called for services
Patient receives treatment
Leaves th.
Case Study Stellar Performer Seattle Children’s Hospital and Regi.docxwendolynhalbert
Case Study Stellar Performer: Seattle Children’s Hospital and Regional Medical Center Hospital-wide Process Redesign
Virginia Klamon
The growth in project management is powered by the speed of change in every sector of the American economy. The techniques traditionally applied to the manufacturing or aerospace industries are proving equally valuable in the services sector, particularly when applied to process redesign or improvement efforts. In 1996, Children’s Hospital of Seattle, Washington, a regional leader in pediatric medical services, realized it needed to dramatically improve its patient management process. Customer complaints were mounting and employee morale was suffering. The hospital organized a team to undertake the effort of redesigning patient management systems and named the project “Encounters.” The new system would streamline and standardize processes such as admitting, registration, scheduling, and insurance verification. The goal was to make things easier and more efficient at Children’s, from the initial call from a family or doctor, to the visit or stay, and following discharge.
STAGE ONE: DIAGNOSTIC ASSESSMENT From August to November the project team performed a diagnostic assessment as stage one of the effort. The team gathered customer feedback data, interviewed key organization stakeholders, created a process map of the current system, and identified external business needs driving current industry changes. The primary deliverable from this stage was the project charter. This document included a scope definition, process goals and objectives, project approach, resource requirements, cost-benefit assessment, and risk matrix. The project scope definition included the boundaries of the organizational change and the work required to accomplish it.
STAGE TWO: PRELIMINARY DESIGN The project team quickly moved to the second stage—preliminary design—once the project charter was drafted and approved. Using creative thinking and proven process modeling tools, the team was ready to move forward to design a new patient management system. During this stage each new process link was painstakingly identified and documented. An iterative approach allowed successive design ideas to be layered in on top of the ever-developing process model. Patient scenarios were used to test the evolving design, allowing the team to walk through each step patients would encounter as they were admitted or treated. Stakeholder involvement is critical to organizational redesign, particularly during the development of the preliminary design, the new conceptual process model. To promote involvement and stakeholder input, a display room was open 24 hours a day, seven days a week. From March through July 1997, employees, patients, and physicians were invited to view the new preliminary design. Feedback was encouraged and received, creating repeated design adjustments throughout the phase.
STAGE THREE: DETAILED DESIGN from July through December the team ...
Six Sigma Case Cart Project Final Report Jan. 2011
1. Six-Sigma Project Report
Hospital Surgical
Case Cart Completion
Six-Sigma Project
By Dan Johnson
Final Report
January 2011
Six Sigma Project Final Report Jan. 2011.doc 1
2. Six-Sigma Project Report
TABLE OF CONTENTS
Executive Review……………………………………………………………...3
1. Overview; Project Selection
1.1 Background Information…………………………………….…………..4
1.2 Problems and Symptoms………………………………………………...5
2. Define
2.1 Goals and Expected Results……………………………………………...6
2.2 Framework………………………………………………………………10
2.3 Assumptions ……………………………………………………….……17
3. Measurement
3.1 Study, Late Case Carts, Missing Items, Case Delays……………….…18
3.2 Statistical Results and Sigma Level Calculation……………..………..23
4. Analysis
4.1 Cause and Effect…………………………………………….…………..24
4.2 Pareto………………………………………………………………...…..24
4.3 Action Item List……………………………..…………………………..26
5. Improvement…………………………………………………………………27
6. Control
6.1 Process, Standardized Work…………………………...……………….30
6.1 Metrics…………………………………………………………………....30
7. Conclusion and Outlook
7.1 Sigma Calculation……………………………………………….………33
7.2 Savings Summary………………………………………….……………34
Appendix: Process Flow
Six Sigma Project Final Report Jan. 2011.doc 2
3. Six-Sigma Project Report
Executive Review
This hospital‟s Surgical Services and associated Operating Room (OR) and Sterile
Processing and Distribution (SPD) are faced with many strategic growth decisions that
provide both challenges and rewards. While there are many positive attributes within the
Sterile Processing Department, surgical staff, hospital administration and the surgeon‟s
committees have made keenly known their concern and dissatisfaction with the delays
and time wasted due to lack of complete and ready surgical case carts, or case supplies.
The hospital hasn‟t established a Lean or 6-sigma based process improvement
methodology, however C-level executives are aware of the power of the approaches in
facilitating improvement and therefore sanctioned a process improvement project focused
on these concerns. For purposes of external publication, the facilities name and location
is omitted and will simply be referred to as “the hospital” or similar designation.
A team was assembled under my direction and consisted of eight individuals,
participating as necessary over the course of the project. One of the team members is
concurrently pursuing a green belt certification, although not through Aveta. The team
applied the DMAIC methodology to the process of supplying the Operating Room (OR)
with supplies and equipment required in the performance of surgical procedures (cases)
with the intent of improving the number of cases for which all supplies are available at
the time of need. The team drew upon some Lean knowledge, as well during the
implementation phase. The project report is presented in alignment with the DMAIC 6-
sigma phases.
In the Define phase, we drew up a project charter, specified and quantified our goals and
determined a method to track savings. We continued with a project plan and high-level
task list outlining each team member‟s responsibilities. A rough process map was
developed to ensure our understanding of the process and to provide a framework for
improvement activities.
An early discovery during the Measurement phase showed that the reporting capability in
the OR limited the use of historical information for measurement or performance
analysis, therefore the team was required to conduct detailed observations to understand
the true nature of the delays being reported by the OR. During this phase we also began
soliciting suggestions from SPD and OR personnel. A SIPOC and a HOQ were
developed to assist the team in better understanding the relationships of the inputs and
outputs to the process, its vendors and customers.
During the Analyze phase Ishakawa charting was used to understand cause and affect
relationships. This lead to brainstorming of the possible root-causes and ultimately was
used to populate an Action Item List that is still in use to facilitate and monitor the
ongoing process changes. A significant change brought about by the team involved
completing a spaghetti diagram of the supply pick process; the results which included the
implementation of a 2-bin kanban system and reorganization of the supplies storage area
to align with the pick ticket sequence. During this phase the team reviewed the data
collected during the observation period and quantified the scope of the incomplete case
Six Sigma Project Final Report Jan. 2011.doc 3
4. Six-Sigma Project Report
cart issues. Note: case carts refer to the system of picking and delivering all supplies and
instruments needed for the performance of a surgical case.
The Improvement phase allowed the team the opportunity to implement a large number
of the process improvement items detailed in their Action Item List and to begin
measuring their impact. Detailed process flows were developed to help in the change
process and to enlist buy-in from the technicians responsible. While many items remain
to be accomplished the team focused on those that would have the greatest or most
immediate impact to the process with the intent of quickly improving the satisfaction
levels of the OR surgical personnel. A series of metrics closely aligned with the key data
from the Measurement phase was installed at the same time, so impact could be
quantified from the onset.
The series of metrics mentioned before is now used daily to track and trend performance
against an established baseline. This provides the Control element for the processes and
allows for the quantification of impact as well as ensuring that the gains made will be
sustained.
1. Overview; Project Selection
1.1. Background Information
The hospital is one of a network of hospitals located in the southern US. The hospital
offers general healthcare and wide variety surgical services including reconstructive,
cardiovascular, urology, etc, utilizing 29 OR suites. Approximately 22% of its surgical
caseload is in the fields of orthopedics and spine, both heavily supply and instrument
intensive. The case volume for 12 calendar months ending July 2010 was about 33,000,
split nearly equal in-patient to out-patient, although the trend for the past few years has
been increasing the out-patient percentage. The OR conducts business typically from 7:30
am to 5:00 pm Monday through Friday, but often extends late into the evening. Saturday
cases are not considered scheduled, but several routinely occur each weekend.
A key support service to the OR caseload is the reprocessing of surgical instrumentation
and the assembly and distribution of Case Carts (customized kitting of supplies and
instruments) by the Sterile Processing Department (SPD). The SPD is responsible for the
cleaning, reassembly and sterilization of surgical instruments following a case and in
preparation for those instruments to be reused. The SPD is also tasked with
supply/inventory control and preparing case carts for use in the OR. The SPD operation
runs 24-7.
Quality is thought of in the relative terms of Clean and Sterile, Complete and On-time
and is quickly becoming a focus within hospitals as accrediting agencies begin to look
more closely at this part of the operation than ever before. Recently the noise level from
surgeons and the hospital‟s surgical staff about the state of affairs regarding incomplete
case carts and instruments sets had increased to the point of administrative concern. It
was generally felt that something needed to be done, but efforts internal to the SPD had
Six Sigma Project Final Report Jan. 2011.doc 4
5. Six-Sigma Project Report
proved fruitless and the department was taking a serious rap for its poor quality and
delivery reliability, though no supporting numbers were presented.
The hospital doesn‟t have an established process improvement methodology, but
executives are acutely aware of improvements made in other hospitals using Lean or 6-
Sigma methodologies, or a combination and believe that the 6-sigma approach may be a
powerful tool to detect and reduce errors in the process. While not setting themselves up
with a process improvement department they did agree to support the team approach to
addressing these issues. That the process involved here is more service than production
oriented it seems a challenge to utilize many of the 6-sigma statistical tools. However, it
is their hope that the DMAIC provides the blueprint for solving and eliminating the
problems they now face.
1.2. Problems and Symptoms
It is important to separate the noise from the real issues. Many of the same stories of case
delays (late starts) are heard time and again throughout the hospital hallways. Weekly
review after weekly review raised many of the same concerns. The OR record keeping
system contains some information related to reasons for delays. However the system is
inconclusive as it allows only a single reason code to be entered for case delay and while
this is considered to be the primary reason there may be multiple factors and reality is
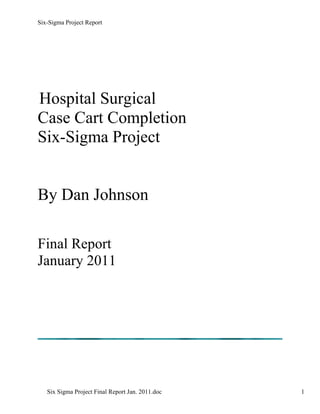
that input often serves the person recording the code. The team initially created a Pareto
from the OR data to begin to understand the opportunities rough order of magnitude. See
Figure 1.
Figure 1. OR Case Delay by Reason Code
OR Recorded Case Delay by Reason Code
Percentage
PREVIOUS CASE OVER SCHEDULED TIME
SURGEON LATE
OTHER
OTHER
PREFERENCE CARD DISCREPANCY
OTHER
ANESTHESIA LATE
PATIENT LATE TO HOSPITAL
INSTRUMENTS NOT STERILE
EQUIPMENT/INSTS NOT REQUESTED WHEN SCHEDULED
H&P NOT DICTATED-WRITTEN IN HOLDING
OTHER
SURGEON DELAYED IN OTHER ROOM
LABS NOT AVAILABLE
TRANSPORT TEAM DELAY
IMPLANTS NOT AVAILABLE
ROOM NOT SET UP PROPERLY
EQUIPMENT NOT AVAILABLE
PHYSICIAN REQUEST CHANGE IN LINE UP
PATIENT DELAYED IN ADMITTING
EKG NOT DONE/AVAILABLE
NO MD ORDERS
DIFFICULT INTUBATION
EMERGENCY BUMP
INSTRUMENTS NOT ORDERED
SCHEDULING CONFLICT
BLOOD BANK DELAY
PHARMACY MEDS NEEDED
CONSENT INCOMPLETE/INACCURA TE
H&P DICTATED NOT TRANSCRIBED
PATIENT DELAYED IN OPSU
C SECTION BUMP
XRAYS NOT DONE/UNAVAILABLE
ANESTHESIA NOT AVAILABLE
ADDITIONAL TESTS REQUESTED BY SURGEON/ANESTHESIA
DIFFICULT IV START
PATIENT DIRECT ON A VENT/ISOLATION
PATIENT REQUESTED TO SPEAK TO MD
PATIENT WAITING FOR FAMILY
PACU SATURATED
NOT ENOUGH STAFF TO START CASE
CONSENT DOES NOT MATCH SCHEDULE
UNANTICIPATED MULTIPLE LINES
PROCTOR NOT AVAILABLE
ASSISTANT NOT AVAILABLE
ADDITIONAL MD CONSULT REQUESTED
PATIENT NOT NPO
NEEDS TRANSLATOR
TRAUMA BUM
BED NOT AVAILABLE ON ICU
BED NOT AVAILABLE ON FLOOR
SCRUB PERSON NOT READY
BIOMED DELAY IN CHECKING EQUIPMENT
EQUIPMENT MALFUNCTION
OUTSIDE SERVICE PROVIDER DELAY
SURGICAL CHECKLIST NOT COMPLETE FROM SENDING UNIT
XRAY TECH/CARM UNAVAILABLE
0.00% 5.00% 10.00% 15.00% 20.00% 25.00%
Six Sigma Project Final Report Jan. 2011.doc 5
6. Six-Sigma Project Report
Note that the highlighted reasons are each related to the proper availability of supplies or
instruments needed for the case. While no single reason recorded would lead a team to
tackle it as the top offender, the aggregate of all related to supplies supports the concern
of the hospital administration. This chart indicates that approximately 13% of delayed
cases are so by virtue of missing supplies or instruments. The story is compelling enough
to move forward with a project and ultimately drove the project more than adequate ROI
analysis and comparison to other opportunities.
2. Define
2.1. Goals and Expected Results
Prior to assemblage of a 6-sigma team the Green Belt candidate and I developed a charter
and had it approved and sponsored by the Sr. VP Perioperative Service. See Figure 2.1.
The primary goal of the team is to decrease the number of surgical case carts that are
delivered to the OR incomplete. The goal is further broken down into 1st and 2nd Cases
and all other cases. The thought behind this is two-fold. First, getting a good start to the
day helps ensure surgeon satisfaction. Second, the availability of some instrument sets is
impacted by the timing of their use in cases earlier in the day. The lack of adequate
instrumentation may be a focal point of the team during the project. The business case for
this improvement is that improved service and delivery of complete case carts reduces the
hours spent by both OR and SPD personnel in later searching for the missing items and
may result in the recapture of enough OR time to provide availability for additional
revenue generation.
As well as the OR Pareto shown in Figure 1, a Project Evaluation and Cash Flow
projection is developed along with a set of base data and savings projection. The base
and savings projection are compiled through the course of the Define and Measurement
phases and is finalized upon completion of the base data analysis. See Figures 2.2, 2.3
and 2.4.
The cash flow projection is predicated on the estimated FTE weeks that specific team
members will be utilized across the course of the project. Salary considerations are
expected to be about $76,900 over 3 months and we plan to have a couple of team
dinners and minor project expenses. The sponsor wasn‟t concerned about capturing costs
associated with hospital conference rooms as some are nearly always available for the
team meetings and working sessions. Overall ROI is anticipated to be 4.4 to 1, assuming
all hard and soft-savings targets are hit.
Six Sigma Project Final Report Jan. 2011.doc 6
7. Six-Sigma Project Report
Figure 2.1 6-Sigma Project Charter
Six-Sigma Project Charter / Client Hospital
Product or Service Case Cart OR Delivery Expected Project Savings ($) $ 350,000
Impacted
Facilitator Dan Johnson Business Unit CSP/OR
Champion Ms. Jackson Phone Number for Facilitator 602-448-5704
Start Date 8/10/10 Target Completion Date 11/30/10
Element Description Team Charter
1. Process: Case Cart Assembly and Delivery Need to reduce the overall number of case carts
delivered incomplete to less than 25% and 1st and 2nd
cases to less than 5% by end of November 2010
2. Project Description: Problem and goal statement (project‟s purpose) Eliminate the causes of case carts being delivered
what is the Case Cart delivered to the ORs missing trays incomplete and wet.
“Practical Problem” and supplies. Wet case carts
3. Objective: Improvement is sought in 1) ensuring that all Project
„available” items are picked to the case cart, Y’s Baseline GOAL Unit of units
Measure
2) “items unavailable‟ at time of pick are 1st and 82 95 # Case %
recorded and follow-up accomplished, 2nd case Carts
comple
tion
3) Reasons for “items unavailable” documented Overall 60 75 # Case %
and used for next steps. case Carts
comple
tion
OR 194; 1st 2nd 54 # Delay #
Delay cases Mins
(Mins / 274 all 171
Day) others
Savings Metrics will include OR Delay minutes OR 324; 1st 2nd 90 # Staff #
per case resulting in increased OR utilization Staff cases mins
and OR Staff minutes used tracking the missing Time 456 all 285
items. (Mins / others
Day)
4. Business Cases: Expected financial improvement, or other Improved service to the OR and decreased OR Starts
justification. delayed due to incomplete cases carts. Will decrease
labor hours spent on location and recovery.
5. Stakeholder Team Names and roles of team members? CSP Case Cart Tech(X2) – M. Hendersen, J. Maliford
members: OR Staff – J. Rodriguez, C. Nestman (Greenbelt)
CSP Leadership – R. Sanchez
6. Project Scope: Which part of the process will be investigated Case Cart Assembly, Transport and Staging.
and excluded. Storage Location Control
Completeness of reporting
7. Benefit to External Who are the final customers, what are their key Patients, OR Staff and Surgeons; Improved delivery
Customers: measures, and what benefits will they see? performance, improved OR Start Times
8. Schedule: Give the key milestones/dates. Project Kick-off, August 10, 2010
Define, Set Goals,
Proc Map & AIL
Review
M- Measurement, Metrics validation, Success “M” Completion August 25,2010
Metrics
A- Analysis “A” Completion September 18, 2010
I- Improvement “I” Completion September 25, 2010
C- Control “C” Completion October 10,2010
Note: Schedule appropriate Safety Reviews. Safety Reviews October 10, 2010
Project Completion November 30,2010
9. Support Required: Will any special capabilities, hardware, trials, Meeting room, LCD Overhead, Flip Charts
etc be needed?
Six Sigma Project Final Report Jan. 2011.doc 7
8. Six-Sigma Project Report
Figure 2.2 Project Evaluation
Score Interpretation
10 Sponsorship
10 External Customer
3 Shareholder
3 Employee or Internal Customer
3 Other (supplier, environment, etc.)
4.75 - Total Benefit
3 Availabilty of resources other than team
3 Scope in terms of Black Belt effort
10 Deliverable
3 Time to Complete
3 Team
10 Project Charter
10 Value of Six Sigma Approach
59.225 Total
Six Sigma Project Final Report Jan. 2011.doc 8
9. Base Data and Savings Projection Summary
Baseline Goal Delay Goal
Delay Delay OR OR Staff Cost per Minutes Goal OR
Incomplete OR Lost Lost Cost per Cost Daily Minutes OR Staff Staff Total Delay Saved Daily Cost Staff Cost Goal Total
Resulting Delayed Minutes Minutes OR Delay Lost per Minutes Minute Cost Daily Cost per (50% Delay Saving Minutes Saving Savings per
# Cases Complete Incomplete in OR Delay Cases per Case per Day Minute OR Min Case per Day (Burdened) Staff Min Day Complete Minutes Per Goal Saved Goal Day
Daily Avg. % # # % # Min Min $ $ Min Min $ $ $ % # Min $ Min $ $
1st & 2nd Cases 60 82% 49 11 15% 1.6 18 29 $ 40 $ 1,166 30 324 $ 0.63 $ 205 $ 1,372 95% 57 14.58 $ 583 234 $ 148 $ 731
Six-Sigma Project Report
Remaining Cases 38 60% 23 15 10% 1.5 18 27 $ 40 $ 1,094 30 456 $ 0.63 $ 289 $ 1,383 75% 29 13.68 $ 547 171 $ 108 $ 656
Total Daily 98 73% 72 26 3.1 56.52 $ 2,261 780 $ 494 $ 2,755 86 28.26 $ 1,130 405 $ 257 $ 1,387
Average Annual @
260 surgical days 25480 18720 6760 816 14695 $ 587,808 202800 $ 128,440 $ 716,248 22230 7348 $293,904 105300 $ 66,690 $ 360,594
Figure 2.3 Base and Savings
27 Day Month 2646 1944 702 84.78 1526.04 $ 61,042 21060 13338 74380 2309 763.02 $ 30,521 10935 $ 6,925.5 $ 37,446.3
Estmated % case delays resulting in a lost case = 20%
Plan to recover 50% of that potential
Total
Six Sigma Project Final Report Jan. 2011.doc
Recoverable project
OR Minutes Daily Cast Savings
Annually worth
28 $ 1,130 $293,904 $ 360,594
9
10. Six-Sigma Project Report
Figure 2.4 Cash Flow Projections
Project Cash Flow Projection
Case Cart Completion Project
$400,000 Approximate Annual Savings: $350,000
$350,000 Project Cost: $78, 781
$300,000 ROI: 4.4 to 1
$250,000
$200,000
$150,000
$100,000
$50,000
$0
1 3 5 7 9 11 13 15 17 19 21 23 25 27 29 31 33 35 37 39 41 43 45 47 49 51
Project Week
Cum Projected Savings Cum Project Cost Planned Out-of-Pocket
2.2. Project Framework
A high-level task plan (fig. 2.5) laid out the team members primary responsibilities and
tasks for the project and was later detailed in the Project Gantt Chart for schedule
adherence and reporting (fig. 2.6)
Six Sigma Project Final Report Jan. 2011.doc 10
11. Six-Sigma Project Report
Figure 2.5 Task Plan
High Level Task and Responsibility
TASK Responsibility Date Due Complete
Charter
___ Indentify Opportunity Dan Johnson 25-Jul
___ Identify Sponsor Dan Johnson 25-Jul
___ Estimate Savings Dan Johnson 29-Jul
___ Draft Charter Dan / Ms. Jackson 2-Aug
___ Sponsor project review (weekly) Dan / Ms. Jackson 2-Aug
Define
___ Team selection Dan / Ms. Jackson 3-Aug
___ Complete Charter Dan Johnson 4-Aug
___ Team Training Dan Johnson, Green belt ( Cory Nestman) 12-Aug
___ Review existing documentation Dan Johnson, Cory nestman 15-Aug
Define objectives and develop
___ plan Team 8-Aug
___ Develop Plan Gannt Chart Cory Nestman 10-Aug
Present objectives and plan to
___ management Cory Nestman 10-Aug
___ Map As-Is process Team 15-Aug
Review and redefine
___ problem/opportunity Team 20-Aug
___ Sponsor sign-off Ms. Jackson 22-Aug
Measure
___ Identify CTQs Cory Nestman 15-Aug
Collect data on event tasks and
___ cycle time Team 22-Aug
Determine and validate
___ measurement system Dan Johnson, Cory Nestman 25-Aug
Analyze
Prepare baseline graphs on event
___ tasks and cycle time Dan Johnson, Cory Nestman 25-Aug
Analyze impacts on tasks and cycle
___ times Dan Johnson, Cory Nestman 5-Sep
Evaluate time and value, risk
___ management Team 5-Sep
___ Benchmark other companies Malik 10-Sep
___ Discuss team's preliminary findings Team 12-Sep
Consolidate team's findings and
___ analysis (additional brainstorming) Team 16-Sep
Improve
Present recommendations to
___ process owners and operators Team 18-Sep
Review recommendations and
___ formulate beta Team 18-Sep
___ Prepare Beta Dan Johnson, Cory Nestman 21-Sep
___ Run beta (test improved process) Team 24-Sep
___ Analyze beta and results Dan Johnson, Cory Nestman 24-Sep
___ Present final presentation Team 25-Sep
Present final recommendations to
___ management team Team 28-Sep
Control
___ Develop Control Metrics Dan Johnson, Cory Nestman 21-Sep
___ Develop metrics collection tool Cory Nestman 21-Sep
___ Roll out improved process Team 29-Sep
___ Roll out metrics Team 29-Sep
Monitor process monthly, using
___ control metrics Team 10-Oct
Six Sigma Project Final Report Jan. 2011.doc 11
12. Six-Sigma Project Report
Figure 2.6 Project Gantt Chart
Six Sigma Project Final Report Jan. 2011.doc 12
13. Six-Sigma Project Report
The SIPOC is used to focus the team‟s scope of work. Figure 2.7 illustrates this project‟s
SIPOC ensuring that the team doesn‟t try to resolve issues with the entire instrument and
supply flow from between the SPD and the OR. For example, while purchasing and
warehouse distribution certainly have an impact on the availability of supplies, it is
considered outside the scope of this project. The focus will be on the interrelationship
between the SPD and the OR and the staff‟s ability to accomplish the task of completing
case carts and delivering them on time to the OR.
Figure 2.7 Case Cart SIPOC
SIPOC DIAGRAM
Case Cart Completion Improvement Project
SIPOC Help
Supplier ► Input ► Process ► Output ► Customer
Surgeon's offices Call to OR Planners Surgical Schedule OR Planners and Team Leaders
Print Surgery
OR Planners OR Surgery Scheduling System Or Schedule for Reference Case Pick Technicians
Schedule
Surgeon's offices
Surgery Equipment, Instruments Print Preference Pick Lists OR Planners
and Supplies req'd Cards / Pick Lists Priority / Conflict Management Case Pick Technicians
Case Pick Technicians Schedule Assign CSP
CSP Management Pick assignments to technicians OR Staff
and assignment
Resources to Pick
Case Carts clean and staged
OR; Post use Decontamination cart wash Obtain Clean, Dry ready for use
Case Pick Technicians
Case Carts
Complete Case Carts; Ready for
Cardinal HSS Warehouse / distribution Pick Soft Goods and OR Staff
surgical use
Document on
Preference Card
Pick Instrumemts
Complete Case Carts; Ready for
OR and Vendors (Loaners) CSP and Document on surgical use
OR Staff
Preference Card Priority Needs List CSP Staff
Sign Pick List and Completeness acknowledged and
Case Pick Techs Completed and signed pick list Surgery Schedule OR Staff
accounted for by tech
On time case starts, satisfied
Case Pick Techs Complete Case Carts Deliver to the OR customers OR, Doctors, Patients
Metrics Metrics
-Surgeon's scheduling -Surgery Schedule
Timeliness Timeliness and accuracy
-Surgeon's Need's -Needs List Percentage
accuracy
-CSP Absentee rate -Case Cart Completion
Rate
-CSP case Pick Technician -OR On-time Starts
skills set
-Cardinal and HSS
distribution Fill Rates
-Vendor delivery
performance (Timeliness
and accuracy)
-Case Cart Completion
Percentage
Six Sigma Project Final Report Jan. 2011.doc 13
14. Six-Sigma Project Report
Along with the SIPOC a House of Quality was used to correlate and weight the various
customer requirements with the functional “Hows” of the process. This tool with the
later used fishbone helped the team to identify and quantify specific issues and eventually
determine the tasks required to address the problems. Figure 2.8 is the HOQ developed
and being two layers is spread over the next several pages.
Figure 2.8 House of Quality
Six Sigma Project Final Report Jan. 2011.doc 14
16. Six-Sigma Project Report
The team assembled and produced an initial Process Flow to ensure that they understood
the process and breakdowns that occurred. This was built and displayed as a working
model on a roll of kraft brown paper, a portion of which is shown in figure. 2.8. This
methodology kept the team involved since the flow continued to be a work in process and
didn‟t feel like an end product.
Critical to Quality was assessed and the following was determined to be the key metrics.
Quality
Sets missing Instruments
Case Carts Missing Supplies / Instruments
Schedule
Case Carts Missing Supplies / Instruments
Cost
Missing Item Recovery Time
Revenue Potential
Case Pick Time
Six Sigma Project Final Report Jan. 2011.doc 16
17. Six-Sigma Project Report
Figure 2.8 Process Flow
2.3. Assumptions
The Pareto of case delay cause codes reviewed in section 1.2 is inherently flawed due to
its subjective nature. The system that the OR staff uses to capture delay reasons is first
limited to a single input, while there may be numerous contributing factors to the delay,
or additional reasons that as stand-alone would have caused a delay. This puts the staff
member in the position of need to identify a „primary‟ reason for the delay. The
subjective nature is also heightened by the perception that a staff member may wish to
use a delay reason to “protect or incriminate” individuals. For this, the team determined
that it must conduct an in-depth study of the delay reasons.
While there have been threats from surgeons to leave the hospital and take their business
elsewhere and while their patience is limited, none have taken this option, but do make
life miserable for the staffs.
Case Cart assembly begins at about 5:00 pm the afternoon prior to the scheduled cases,
after the schedule has been finalized by the OR office staff. The case carts are assembled
Six Sigma Project Final Report Jan. 2011.doc 17
18. Six-Sigma Project Report
in accordance with the surgery schedule, but the schedule is subject to change for a wide
variety of reasons.
The perception of what is late seems to be in constant debate. The OR staff will record
late case carts depending on whom and when the pre-case audit is done. This varies from
the time that the case is ready to commence to hours prior to case start. For purposes of
the team‟s study, late is defined as “1/2 hour prior to need in the room, potentially
prompting a case delay”
The amount of instrumentation is not unlimited. This is true and impacts the availability
of instruments for cases later in the day, as those same sets may be in use in earlier cases.
The ability to see that need and prioritize the “quick turn‟ of those sets is an important
step in the process. Standard supplies should never be an issue, if the replenishment
system is used and working correctly. Special order supplies may be a cause of delay,
but doesn‟t impact this study as they are outside the norm and out of the control of the
SPD staff.
Case carts delivered complete and on time remain complete. This is not a true
assumption as OR staff is known to cannibalize other case carts for supplies and
instruments when they feel a need or want to have extra “just in case”.
For purposes of savings calculation a standard value of $40 per OR minute is used. This
is based on the financial office‟s input that an hour of surgery in the OR puts $2,400 to
the bottom line.
3. Measurement
3.1. Study; Late Case Carts, Missing Items, Case Delays
Based on the initial process flow developed the team set out to quantify the process and
the effects of incomplete and late case carts to the OR. Part of the reason for the
approach taken was to fill the void of case delay reasons contained within the OR data.
The team observed and documented the timing and completeness of case carts for a
period of 27 days and conducted interviews with the surgery staff to determine the actual
reasons for case delay. Figure 3.1 contains the summary data from the study.
Six Sigma Project Final Report Jan. 2011.doc 18
20. Six-Sigma Project Report
From the data collected we tracked daily a number of key defect measurables including:
number of case carts incomplete
# Items missing from case carts
# Items missing per Case
Total Delay Minutes
# / % Instrument Sets missing instruments
Use of Attribute Control Charts:
Since all existing data points were used and the subgroups contained data from each
scheduled surgery for the day the sample size was inconsistent, varying from 90 to 105
across 27 subgroups. In the control charts (p) average sample size of 98 was used. NP
and C charts were not used due to sample size variance.
Used a false LCL to show methodology. In reality, there is no LCL as any item not
delivered could cause an unacceptable case delay.
U chart was used to show the number of items missing
There is a mix both in terms of types of cases being and 8 different technicians
responsible for the assembly of Case Carts. Note that in nearly all samples the technician
responsible isn‟t documented.
The p chart indicates a process out of control as it alternates data points up and down,
although over the center line.
The charts below contain the daily results the team found significant.
Incomplete case carts ranged between 15.7% and 40.8% daily with a mean of 26.6%. Each of
these incomplete case carts represents a potential case delay. Actual case delay is a function of
Six Sigma Project Final Report Jan. 2011.doc 20
21. Six-Sigma Project Report
many other variables, including the critical nature of the specific item missing from the case. For
purposes of this study, that detail was not factored. Actual number of cases delayed due to
incomplete case carts was 85. This chart and data was later used to set up the first control chart
and the upper and lower control limits were calculated and included on this chart. During the
improvement phase this data was correlated to the individual tech and deficiencies in standard
process, training and motivation were addressed.
Items missing per ranged from .43 to 1.238 (.8) per total daily case count with a mean of .804
items per case. Factored against only those cases missing items the mean is 3.003 items per case
with a range of 1.19 (2.26 to 3.45). This correlation caused the team to consider that once a case
has a missing item, the technician picking the case failed to focus on completing as much of the
case as possible.
Six Sigma Project Final Report Jan. 2011.doc 21
22. Six-Sigma Project Report
The two charts correlating the number of items missing to the delay time demonstrated that the
average case delay was 18.1 minutes and 6 minutes per missing item. There was a noticeable
increase following Labor Day that we attributed to unusual staff shortages and a delay in the
receipt of a supply shipment. A phenomenon noted was that contrary to expectation, days with
more items missing didn‟t necessarily result in longer case delays. This, presumably, is due to
an „all hands on deck‟ approach when items are missing. It did, of course, result in more staff
time to locate the multiple items.
Six Sigma Project Final Report Jan. 2011.doc 22
23. Six-Sigma Project Report
As mentioned earlier, during the observation process the team noted the high number of
instrument sets not included in the case carts because the sets themselves were incomplete. Data
was collected from the SPD‟s instrument management system to get a picture of how prevelent
this issue was. The Missing instrument chart shows that over the course of 4 months an average
of 18% of all instruments sets assembled were incomplete. This became a major focus for
improvement.
Incomplete Case Carts Statistical Results
Over 27 days, between August 16 and September 15 there were 2648 surgery
cases conducted
o Daily case volumes ranged from 90 to 105
Of these 1620 (61.1%) were 1st or 2nd cases for the room for the day
704 (26.6%) cases were picked incomplete
o 292 of these impacting 1st or 2nd cases (11.3% of total cases)
85 (3.2%) cases were actually delayed due to incomplete case picks
Average OR case delay due to incomplete cases carts; 18.1 minutes
o Results in an mean delay to all cases of 4.8 minutes
Given $40 per OR minute lost the opportunity is $61.042 per month
66424 Items were required for the cases
2129 (3.2%) Items were missing
3.2 Sigma Calculation
Opportunities for Defect: 66424
Defects: 2129
DPMO: 32052
Failure Rate: .321
Accuracy Rate: .968
--------------------------------------
Sigma Level: 3.35
Six Sigma Project Final Report Jan. 2011.doc 23
24. Six-Sigma Project Report
4. Analysis
4.1 Cause and Effect
Upon completion of the observations and base development, the team conducted a
brainstorming session utilizing the Ishakawa Cause and Effect diagram to detail the
variety of reasons for the incomplete case carts. Each entry was then weighted, after
lengthy discussion, to determine which had the highest likelihood of impact. See Figure
4.1.
Figure 4.1
Case Cart Completion Brainstorming Session Fishbone Diagram (the 6 M's)
E E U
Priority 1,2,3 N R E
2I Lack of priority / Conflict management 3U Audit vs. OR Feedback 2 I Block scheduling
1H Picklists incomplete, inaccurate, extra items 1 S Individual Measurement 3 L Existing Carts not adequate
3C Implants not listed on Count sheet 3 A Method of Accurate Measure 3 I Late reprocessing
Problem Description:
Interruptions to Pick (Phone & Delivery)
1A Soft-goods need to be in T-Doc? 2E No Consistent Definition of"Complete" 1M Impacts focus accuracy
Case Carts sent M M
Sets "Called For"
to OR Incomplete 3 M in other Rooms 3M Out-of-Service Sets 1M Different methods of documenting pick
"Called for" Sets, not used, not
2 A returned to CSP 2A Carry-Over Sets 1E Lack of Job Expectation
1N Lack of Knowledge - Location 1T Loaners not available on time 1T Quick Reference needed?
2 Lack of Knowledge - Material 1E Soft goods not available at pick time 1H Lack of follow-up
Use of Priority List,
"Called-For"sets not Inconsistent
1 Sets not put-away in right location 2R returned to CSP 1O Management follow-up
1 Staff indifference to assignment 3I Instruments not available at pick time 1 D Lack of standardized process
2 Staff inexperience 1A Loaners not available in time for processing
1L Incomplete / Inaccurate Pref. Cards
4.2 Pareto Revised
The reason code results from the team‟s observations were then entered into a new
pareto, figure 4.2 and compared to the initial results from the OR data system. While the
numbers were greater, the rating of the items didn‟t differ significantly.
Six Sigma Project Final Report Jan. 2011.doc 24
25. Six-Sigma Project Report
Figure 4.2
Case Cart Incomplete
# Times Reason Code Assigned
Instruments not available at pick time
Loaners not available in time for processing
Interruptions to Pick (Phone & Delivery) Impacts focus accuracy
Picklists incomplete, inaccurate, extra items
Sets not put-away in right location
Staff indifference to assignment
Method of Accurate Measure
Individual Measurement (Accountability)
Lack of Knowledge - Location
Lack of Knowledge - Material
Lack of standardized process
Quick Reference needed?
No Consistent Definition of"Complete"
Use of Priority List,
Sets "Called For" in other Rooms
Out-of-Service Sets
Late reprocessing
Lack of priority / Conflict management
Lack of Job Expectation
Implants not listed on Count sheet
Carry-Over Sets
Audit vs. OR Feedback
Different methods of documenting pick
"Called for" Sets, not used, not returned to CSP
Block scheduling
Inconsistent Management follow-up
Staff inexperience
Soft goods not available at pick time
Existing Carts not adequate
Source: Case cart Incomplete, 6-Sigma Tracker. Dates August 15, 2010 - Sept 14, 2010
0 10 20 30 40 50 60 70 80 90 100
These breakouts were then further defined into actionable steps and were entered into the
team‟s Action Item Log. The log eventually contained over 160 entries and remains in
use at the time of this writing. A portion of the Action Item Log is shown in figure 4.4.
Key actions taken by the team will be reviewed in the upcoming Improvement section.
Six Sigma Project Final Report Jan. 2011.doc 25
26. Six-Sigma Project Report
Figure 4.4 Project Action Item List – Sample Page
Effect: Case carts are not 100% complete, accurate and available on time
Category Cause Subcause Recommendation
Not a value alignment Use dedicated staff for case
Staffing Staff indifferent
picking
No feeling that they are being measured,
Use dedicated staff for case
Staffing Staff indifferent watched or held accountable for case cart
picking
defects
No negative impact to them while working in
case (by the time they do relief everything is Use dedicated staff for case
Staffing Staff indifferent
fixed) picking
Not all staff has scrubbed all cases therefore Use dedicated staff for case
Staffing Staff inexperienced
they are not familiar with all supplies & trays picking
Descriptions on work sheets are not always Have existing staff highlight
Staffing Staff inexperienced clear & user friendly routine problem items &
allocate staff to fix daily
No place for staff to reference locations for items Pick cases using pick lists &
Staffing Staff inexperienced ensure all items have location
list
No place for staff to reference where locations
Staffing Staff inexperienced Post master list of locations
are in relation to the core (master location list)
No existing process diagram or work instructions
Make work instruction & share
Staffing Staff inexperienced for how cases are to be picked.
process flow with staff
Staff for case picking not dedicated. PM staff
Use dedicated staff for case
Staffing Staff inadequate used prior to 2:30pm when they get pulled to do
picking
lunch relief
Cases are booked after 5pm when staff is more Use dedicated staff for case
Staffing Staff inadequate limited and/or in rooms picking
Staff picks the cases they are familiar with and Use dedicated staff for case
Staffing Staff inadequate can do fast picking
Items for case are placed on open carts (with 3
Case Carts & Existing case carts not procedures per shelf) due to lack of availability of Use dedicated closed case
environment adequate carts carts on each case
Case carts are not numbered or identified as Label each cart with SHJC ID
Case Carts & Existing case carts not
SJHC with numbering system number and reference back to
environment adequate
manufacture's SR #
Case carts have gotten lost or removed over the Label each cart with SHJC ID
Case Carts & Existing case carts not
years see above reason. number and reference back to
environment adequate
manufacture's SR #
Case carts are not being cleaned between each
Case Carts & Existing case carts not Use dedicated closed case
use unless they are used for soiled transport to
environment adequate carts on each case
SPD
No other system (totes or bins) available to Use dedicated closed case
Case Carts & Existing case carts not contain smaller cases such as eye cases. carts on each case but make
environment adequate an exception for eyes and put
three per cart.
Case Carts & Existing case carts not Case carts are not closed therefore present Use dedicated closed case
environment adequate challenge with separation of clean and dirty carts on each case
Case carts are not being maintained wheels
Using SJHC cart ID number, set
need lubricant
Case Carts & Existing case carts not up PM system with Biomed to
environment adequate have carts inspected annually.
Monitor and report.
Six Sigma Project Final Report Jan. 2011.doc 26
27. Six-Sigma Project Report
The opportunity to observe the Case Cart process caused us to revise the process flow a
number of times. The end result was a cleaner, streamlined version of the process and it
is included in the appendix. This exercise prompted the team to recognize that the case
cart process is highly variable and statistically out of control and generated a need for not
only improved processes but also standardized practices, which they developed in the
way of Work Instructions for each of the key components.
One of the top reasons for case carts not being completed was the SPD‟s inability to
complete instruments sets on time. While staffing appropriately across the day to handle
the incoming workload was an issue to be addressed, a significant factor was that the staff
had developed the habit of not putting up incomplete sets, making them unavailable and
not adequately communicating this to the OR. During the observation period a second
set of metrics and trending was initiated to begin to understand the magnitude of this
problem. A review of several months‟ data of sets missing instruments was captured
from the SPD‟s instrument tracking system. It was determined that for the period
extracted 18% of the sets put up were incomplete. The OR staff had complained often
enough that the SPD staff determined not to send the incomplete sets with the case cart,
further extenuating the problem. This became the focus of a major improvement
initiative which we will cover shortly.
While the availability of supplies would not have seemed to a major issue, it was
discovered that some case cart assemblers were not addressing all the supply needs.
Reasons ranged from:
They thought the supplies were actual stored in the OR
Were unfamiliar with the supply layout to
Supplies not listed with locations on the pick tickets
If one item is missing, less focus came to picking all the remaining items.
This then lead to another major improvement initiative by the team and began with a
spaghetti diagram detailing the typical paths taken by the case assemblers to pick all
supplies.
5. Improvement
This is where the proverbial rubber meets the road. Beginning with the brainstorming,
process flow review and Paretos used in the measurement and analyze phases of the
project the team constructed an action plan that eventually grew to over 160 separate
items covering the following areas:
Staff experience , skills, training, motivation
Case Cart condition and size
Space for storage, picking and staging
Standardized procedures and work instructions
Pick sequence and flow
Pick list updates
Completion of instrument sets
Six Sigma Project Final Report Jan. 2011.doc 27
28. Six-Sigma Project Report
Availability of loaner and consignment sets
It‟s important to the team to set and follow a structured approach or risk losing
themselves in the myriad possibilities and tasks. Many of the improvement tasks
identified are beyond the team‟s scope and will remain for the SPD leadership to continue
to facilitate or move to another improvement initiative.
A Test of Change approach was used to introduce process changes. The team determined
the change, its method of measurement to see whether the change resulted in
improvement, then communicated to the SPD and OR staffs the change and how it would
be implemented. Critical to the team‟s thinking was to over communicate in order to
gain buy-in.
Using the tools the team set to determine a priority for the solutions, establish the
improvement method, define the implementation steps and communicate.
It is clear that standardization of process and practice is key to any sustainable
improvement. First steps included cleaning up the process flow and using it to
demonstrate the opportunities and the revised or new elements to the SPD staff,
developing a set of Standard Work Instructions detailing the „hows and whys‟ of each
associated task. For the Case Cart Technicians these include instrument set put-away,
pick sequence and documentation. Standard Work Instructions were also developed for
the SPD Instrument Set Assembly process. The document took the form of a step-by-
step manual with photos correlated to each step. The process steps were reviewed with
each staff member during training sessions and are visibly posted in the work space for
quick reference. The simplified process flow is included in the appendix.
As part of the effort to complete instrument sets it was deemed necessary to identify the
critical instruments in each set. This information is then entered into the SPD‟s
instrument management system and guides the assembly technician to not complete the
assembly if a critical instrument is missing, but to complete it if a non-critical instrument
is missing. This should result in fewer sets being left unavailable for use in a case. An
additional step added to this work sequence is a required supervisor sign-off for any set
assembled incomplete. While this is contrary to Lean thinking, it was determined to be
pragmatic and necessary in the short-term to ensure awareness and adherence to the
process. The identification of critical instruments is a painstaking chore, accomplished by
OR personnel, so it will be a work-in progress for some time.
A result of the focus on instrument set completion highlighted the negligence of the SPD
management to effectively replace instrument that were lost or damaged. A significant
expenditure needed to be made in order to elevate the inventories to the point that a daily
impact could be made. The team sponsor agreed that the expenditure had been needed for
some time and measures were put in place to monitor the needs going forward, so the
cost associated are not included in the cost-benefit analysis or savings projections for the
project.
Six Sigma Project Final Report Jan. 2011.doc 28
29. Six-Sigma Project Report
Process changes in the Case Cart Assembly process includes re-layout of the supplies
inventory from a product-family based to alignment with the pick ticket sequence and the
addition of stores location on the pick ticket printout. A Quick Reference Locator was
also produced and made available in various supply areas. This later change addresses
needs that occur more often after the case carts have been picked, for add-on or
emergency cases or when unforeseen needs arise.
In addition to the change in the stores layout a 2-bin Kanban was installed. In this system
each item‟s inventory is evenly split between two compartments. The items are picked
from the „active‟ compartment. Once this is empty, pickers select from the second or
backup compartment. Empty compartments or containers are replenished. For small
items, bins are used as the kanban signal. For larger items cards are used.
The realignment of the stores, integration of the kanban system and inclusion of item pick
locations has resulted in a pick time reduction of an average of two minutes, from 18 to
16 per case. At 98 cases per day the savings equates to 196 minutes each day.
Kanban Pictures
Swinging Compartment Door
With the above key process changes the team still needed to address the control and
compliance issues within the Case Cart assembly process itself. Consistency is important,
but it comes at a cost. Introduced were the requirements that the picking technician
record each pick ticket they assemble. While not a fix, it was hoped that the requirement
would raise awareness. Case carts required, by timing, to be sent to the OR incomplete
Six Sigma Project Final Report Jan. 2011.doc 29
30. Six-Sigma Project Report
required a supervisor‟s sign-off and a communication call to the OR control desk. This
helped preemptively set in motion any schedule change or recovery action needed.
Highlighted in the brainstorming session was the need for cross-training. The department
suffered when primary Case Cart Assemblers were absent, especially if more than one.
Other areas within the SPD had similar issues. It was determined to begin a cross-
training program and soon to begin a position rotation that would allow for staff to gain
competency in all areas. It is beyond the scope of this team to provide the train or set up
the schedules and this will be left to the department management. They are documented
on the project action item list for future follow-up.
Daily controls and metrics were introduced to track case cart and instrument set
completion rates. These are displayed daily at a department level and fed into a Quality
Dashboard at an individual as well as department level. Note: The dashboard is now
expanding to track quality, productivity and service across the entire SPD.
6. Control
Controls are integral to the success of any implementation ensuring compliance to
practices and standards, monitoring improvement progress and sustaining the gains. First
and foremost are the Standard Work Instructions highlighted before and training provided
to gain understanding and compliance.
Among the controls implemented was the Case Cart Audit mentioned in the prior section.
This audit provided near real-time feedback from the OR to the SPD. The results were
posted daily in the Incomplete Case Carts Daily-Monthly Control Chart. Figure 6.1
shows the actual charts for the months of October and November.
For purposes of this exercise, both Upper and Lower Control Limits were calculated, but
the team and staff recognizes that the target for incomplete case carts is zero. In the two
months since initiating the project steady progress has been made. The last two weeks of
November shows the incomplete carts steady at about 16.4 % versus 26.6 during the
observation period. Still work to do, but showing a 38% improvement.
Six Sigma Project Final Report Jan. 2011.doc 30
31. Six-Sigma Project Report
Figure 6.1 Incomplete Case Carts Control Chart
The second control chart installed is a daily tracker of instrument sets assembled
incomplete. Figure 6.2 contains the charts from October and November and demonstrates
significant improvement. November versus the base period shows an improvement from
18% to 9.9% of Instruments Sets assembled incomplete for a 45% improvement. This
trend is expected to continue as many eyes are focused, now, on the problem.
Six Sigma Project Final Report Jan. 2011.doc 31
32. Six-Sigma Project Report
Figure 6.2 Incomplete Instrument Sets Control Chart
Additionally, a daily report was established to actively monitor case delays recorded to
incomplete case carts. While the OR recording methodology hasn‟t changed and
therefore the inherent inconsistencies still exist, the renewed awareness and diligence by
the OR staff, coupled with improved review from OR management may provide better
insight. For the month of November the OR statistics reported versus the base period:
OR Stats Base November Imp %
Total Cases 2648 2725
# Incomplete Case Carts 702 26.5% 447 16.4% 38%
# Caused Delayed Cases 85 3.2% 68 2.5% 22%
Six Sigma Project Final Report Jan. 2011.doc 32
33. Six-Sigma Project Report
7. Conclusion and Outlook
The 6-sigma methodology proved a useful approach to identifying, quantifying and
providing a framework to address the many issues related to incomplete case carts at this
hospital. Using the DMAIC roadmap the SPD can increase its accuracy and therefore
dependability in customer service.
While we have not yet met our goals, it is believed that with continuing perseverance that
they may be over the next 4 to 8 months. We‟ve seen our metrics improve:
Incomplete Case Carts down from 26.6% to 16.4 %, a 38% improvement
Incomplete Instruments Sets, while not an initial goal, became a significant factor
in incomplete case carts: down from 18% to 9.9%, a 45% improvement.
Sigma level
Sigma Calculation Base November
Opportunities for Defect: 66424 69387
Defects: 2129 1370
DPMO: 32052 20625
Failure Rate: .321 .197
Accuracy Rate: .968 .980
---------------------------------------------------------
Sigma Level: 3.35 3.56
Six Sigma Project Final Report Jan. 2011.doc 33
34. Six-Sigma Project Report
Base Data Normalized to November Actuals and Savings Projection Summary
Baseline
Delay Delay OR Cost per
Incomplete OR Lost Lost Cost per Cost Daily OR Staff OR Staff Staff Total Delay
Resulting Delayed Minutes Minutes OR Delay Lost Minutes Minutes Minute Cost Daily Cost per
# Cases Complete Incomplete in OR Delay Cases per Case per Day Minute OR Min per Case per Day (Burdened) Staff Min Day
Daily Avg. % # # % # Min Min $ $ Min Min $ $ $
1st & 2nd Cases 60 82% 49 11 15% 1.6 18 29 $ 40 $ 1,166 30 324 $ 0.63 $ 205 $ 1,372
Remaining Cases 38 60% 23 15 10% 1.5 18 27 $ 40 $ 1,094 30 456 $ 0.63 $ 289 $ 1,383
Total Daily 98 73% 72 26 3.1 56.52 $ 2,261 780 $ 494 $ 2,755
Average Annual @ 260
surgical days 25480 18720 6760 816 14695 $ 587,808 202800 $ 128,440 $ 716,248
Base 27 Day Month 2648 1944 702 85 1526.04 $ 61,042 21060 13338 $ 74,380
November 2725 447 68
Impact at Base 722 87
Improvement and Savings Impact 275 19 18 346.42 $ 40 $ 13,857 30 8262 0.63 $ 5,205 $ 19,062
Direct Project Savings Annualized $ 166,279 $ 62,464 $ 228,743
Addition Soft Savings
# Case Base Saved Std Prod Mean FTE
Carts Assm. Nov. Assm. Mins / FTE Equiv. Payroll
SPD Case Cart Pick Time Daily Mins Mins Improvement Day Min/Day FTEs (Annual) Savings
Subtotal 98 18 16 2 196 390 0.5 $ 32,000 $ 16,082 $ 16,082
11.1%
SPD Saved Std Prod Mean FTE
SPD/OR Time recovered due to # Sets Base Nov. Mins per Mins / FTE Equiv. Payroll
improved set completion Daily Missing Missing Improvement set Day Min/Day FTEs (Annual) Savings
910 164 121 43 25 1075 390 2.8 $ 32,000 $ 88,205
18% 13% 26.2%
Saved Std Prod Mean FTE
OR Mins Mins / FTE Equiv. Payroll
per set Day Min/Day FTEs (Annual) Savings
Subtotal 12 516 390 1.3 43,000 $ 56,892 $ 145,097
Subtotal Soft Savings (not verified) $ 161,179
Potential Total Project Savings $ 389,922
Using the base data for comparison to the results in November we can ascertain that we are on
track to save $228,743 annually. While the impact on staff minutes spent searching for missing
items is nearly on track, it‟s difficult to tell if the lost OR time will be sufficiently recovered.
Shown also are soft savings calculated based on the reduction in time to pick and assemble case
carts and reduction in the time SPD uses search for instruments from incomplete sets. These lines
are excluded from the Direct Project savings for two reasons; first they are difficult to verify on a
consistent basis and no labor has actually been reallocated from the department and second, they
were not part of the original savings projections. However it is important to recognize the
impact that the 6-sigma team had relative to the entire process. It is too early to definitively state
that the project will result in the savings projected, however at the time of this writing all
indicators are moving in the right direction and the gains made are being sustained.
Six Sigma Project Final Report Jan. 2011.doc 34