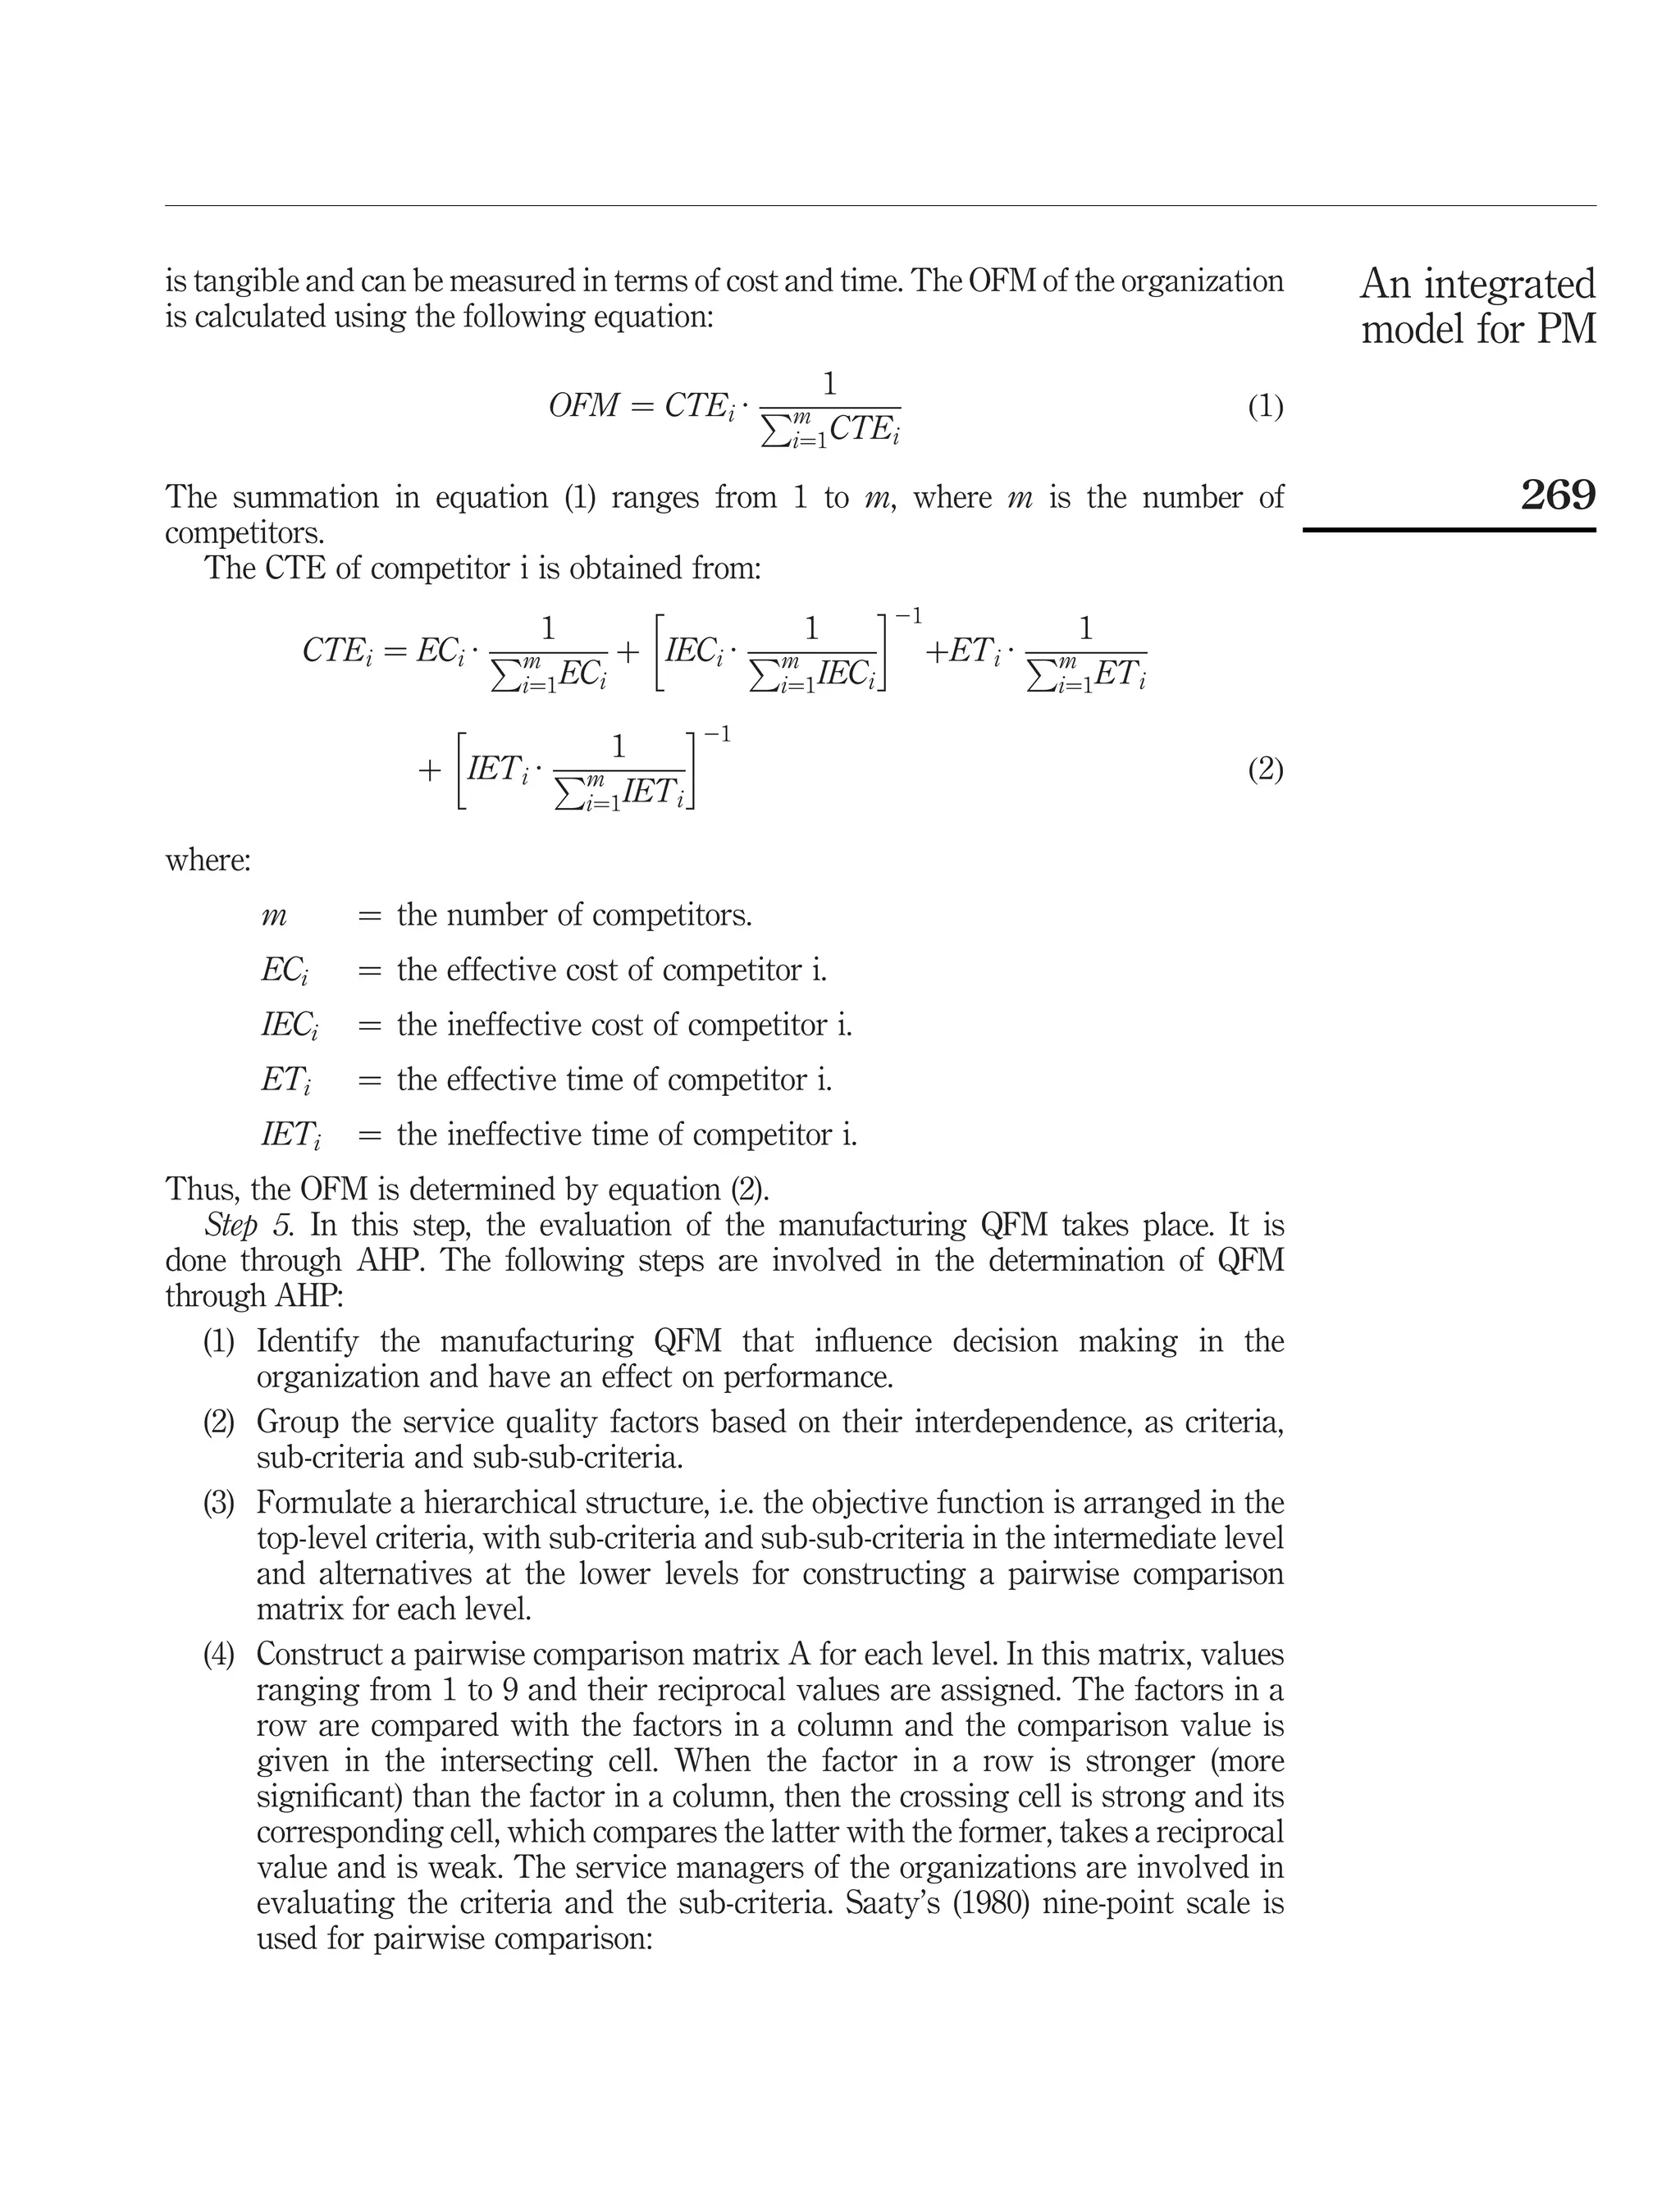
The current issue and full text archive of this journal is available at
                                         www.emeraldinsight.com/1463-5771.htm


                                                                                                                         An integrated
           An integrated model                                                                                           model for PM
      for performance management
          of manufacturing units
                                                                                                                                            261
                                          P. Parthiban
   Department of Production Engineering, National Institute of Technology,
                        Tiruchirappalli, India, and
                                            Mark Goh
   NUS Business School, National University of Singapore, Singapore and
  School of Management, University of South Australia, Adelaide, Australia

Abstract
Purpose – The objective of this paper is to develop an integrated model for performance management
(PM) of manufacturing industries.
Design/methodology/approach – The proposed integrated model consists of performance
measurement by the extended Brown Gibson model by considering the objective and the service
quality factors. The quality factor measure has been evaluated by using the analytic hierarchy
process. On the non-compliance of the performance measures with the satisfactory levels, quality
function deployment is used to redesign the existing manufacturing process.
Findings – This study provides a way to identify the current performance of an organization and a
methodology for further improvement. An important contribution of this model is that it combines
both the qualitative and quantitative dimensions of manufacturing performance measurement. Both
the objective and manufacturing quality factors have been converted into consistent dimensionless
indices to measure system performance.
Practical implications – This study has demonstrated the applicability of the model to support a
manufacturing unit. It has shown how performance measures have been identified and how they can be
used to calculate the two different manufacturing units using time, cost and service quality dimensions.
Improving performance is a never-ending process and organizations should strive to achieve it to attain
the optimal level of cost and profit, as well as increase customer satisfaction and goodwill, and gain
potential future business. Hence, the process of measuring and redesigning manufacturing performance
measures needs to be monitored and the implementation plans reviewed often, which is successfully
done by this integrated model.
Originality/value – We contend that the integrated model for PM, illustrated with a practical case in
this paper makes a contribution to the never-ending process of performance enhancement for both
theory and application, and assists in expanding the boundaries of theory and practicality in this area,
thus highlighting the novelty of our approach.
Keywords Analytical hierarchy process, House of quality, Quality function deployment,
Performance management
Paper type Research paper


1. Introduction                                                                                                       Benchmarking: An International
Globalisation and liberalisation create a need for having a manufacturing management                                                           Journal
                                                                                                                                   Vol. 18 No. 2, 2011
system to estimate the performance of the manufacturing industry. Amaratunga and                                                           pp. 261-281
Baldry (2002) define performance management (PM) as the use of performance                                          q Emerald Group Publishing Limited
                                                                                                                                            1463-5771
measurement information to effect a positive change in the organizational culture,                                    DOI 10.1108/14635771111121702
BIJ    systems and processes, by helping to set agreed-upon performance goals, allocating and
18,2   prioritizing resources, informing managers to either confirm or change current policy or
       programs direction to meet these goals and sharing the results of performance
       in pursuing these goals. PM both precedes and follows performance measurement.
       The effective conduct of PM is generally divided into two stages:
          (1) performance measurement; and
262       (2) performance improvement.

       Performance measurement is recognized as an important part of the manufacturing
       strategy literature. It is a process of quantifying actions, where measurement is the
       process of quantification and action correlates with performance. The definitions of
       three important terms in the context of performance measurement as given by Neely et al.
       (1995) are the process of quantifying the efficiency and effectiveness of action.
       A performance measurement system can be examined at three different levels: the
       individual performance measures, the performance measurement system as an entity,
       the relationship between the performance measurement system and the environment in
       which it operates. The key to the evaluation of performance measurement in our view
       has to be based first and foremost on identifying the function of the performance
       measurement system; and this, again, depends largely on the organizational context and
       the organizational culture management intent and strategy. Thus, performance
       measurement sets the agenda for bringing the more relevant-, integrated-, balanced-,
       strategic- and improvement-oriented PM (Tangen, 2004).
          Performance improvement is the positive change which is brought about by process
       re-engineering, reflecting the concern of the customer. Process improvement identifies
       the redundant and missing performance measures, as well as identifies potential
       conflicts between performance measures and targets for each performance measure.
       Quality function deployment (QFD) has been used to improve the manufacturing
       process improvement. This technique converts the “voice of the customer” into design,
       engineering, manufacturing and production terms to ensure the product meets the needs
       of the customer. Therefore, it is an effective tool to integrate marketing strategy with
       product development process. The QFD procedure uses a series of matrices called house
       of quality (HOQ), to express the linkages between the inputs and outputs of the different
       phases of development (Hauser and Clausing, 1988). The HOQ typically contains
       information on the “what to do” (customer requirements), “how to do”
       (engineering characteristics), relation measures between customer requirements and
       engineering characteristic’s, as well as the correlation measures among the engineering
       characteristics and benchmarking data compared to competitors (Tan et al., 2004;
       Tang et al., 2002). In the redesign process, the HOQ needs to be developed and the
       optimal set of service requirements needs to be determined.
          Thus, the objective of this paper is to demonstrate the need for the manufacturing
       PM model, integrating performance measurement and performance improvement.
       Moreover, it explores the relationship between the measuring variables considering the
       objective and service quality factors, which are based not only on costumer focus but
       also on the technical parameters based on the operational system.
          The paper is organized as follows. A brief theoretical background is presented on
       the performance measurement framework, and performance measuring tools are
discussed followed by the problem identification and research methodology. A case             An integrated
study of two manufacturing units to illustrate the applicability of the model follows.       model for PM
2. Theoretical background
The following reviews serve as the background within which measurement of
manufacturing performance is undertaken and the subsequent development of the
integrated model is proposed. Next, the framework and dimensions on PM are presented.                263

2.1 Review on performance measurement framework
Performance measurement has not received much attention from researchers and
practitioners, however, organizational performance has always exerted considerable
influence on the working and decisive actions of companies. Garvin (1993) coined a phrase
in the Harvard Business Review that has become paradigmatic for this view: “If you cannot
measure it, you cannot manage it”. Thus, the ways and means of accurately measuring the
performance is perceived as being an increasingly important field of research for both
organizations and academics alike. Indeed, in the past 15 years, performance measurement
has been seen to make its mark, reflecting its importance in an increasing number of fields
(Rouse and Putterill, 2003). The mid to late 1990s seem to have seen the peak of this
activity. Consequently, numerous frameworks on performance measurement have been
developed in many fields (Yeniyurt, 2003). One of the first frameworks put forward for the
process of performance measurement was by Sink and Tuttle (1989), it describes a six-step
procedure for performance measurement in the planning phase: effectiveness, efficiency,
and quality, and productivity, quality of work life, innovation and profitability/budget
ability. Keegan et al. (1989) developed a model which presented the structural performance
measurement matrix that examined external/internal and cost/non-cost performance
measures, while the results and determinants framework proposed by Fitzgerald et al.
(1991) described the financial performance competitiveness, quality, flexibility, resource
utilization, and innovation as the determinants. Lockamy (1998) has proposed four
theoretical performance measurement system models for the dimensions of cost, quality,
lead time, and delivery based on research into the linkages between the operational and
strategic PM systems in a small number of world-class manufacturing companies. Lynch
and Cross (1991) proposed the structural performance pyramid, which highlights a
hierarchical view of business performance measurement, and a ten-step procedural model
encompassing vision, market, financial, customer satisfaction, flexibility, productivity,
quality, delivery, cycle time, and waste to describe what needs to be done in terms of PM.
Both Kaydos (1991) and Wisner and Fawcett (1991) have proposed procedural stepwise
framework models, while the structural-balanced scorecard attempts to introduce the
concept of producing a “balanced” set of measures (i.e. non-financial “balanced” against
financial measures). Berrach and Cliville (2007) proposed building performance
measurement systems by linking an overall performance expression to elementary
ones. As global frameworks, the analytic hierarchy process (AHP) or MACBETH
methodologies were suggested. Neely et al. (1997) emphasized the role of performance
measurement and matrices in setting objectives for evaluating performance, and
determining future courses of action. They further suggested that “time” can be used as a
strategic metric in PM. Folan and Browne (2005) described the evolution of the
performance measurement in four sections: recommendations, frameworks, systems,
and inter-organizational performance measurement. A holistic analysis with cost,
BIJ    time, and service quality as the coherent dimensions of performance measure is rarely
18,2   found in the literature.
          The next section discusses the literature on the various tools namely AHP, QFD and
       the extended Brown-Gibson (EBG) model used in the paper.

       2.2 Review on AHP
264    AHP, developed by Saaty (1980), is a decision-making tool that can help to describe the
       general decision operation by decomposing a complex problem into a multi-level
       hierarchical structure of objectives, criteria, sub-criteria, and alternatives. The wide
       applicability is due to its simplicity, ease of use and great flexibility. AHP consists of
       three main operations, including hierarchy construction, priority analysis, and
       consistency verification. AHP has been designed for situations in which ideas, feelings
       and emotions are quantified based on subjective judgement to provide a numeric scale
       for prioritizing decision alternatives. The usability of AHP in solving multiple criteria
       problems can be appreciated with its diverse applications in various fields (Vaidya and
       Kumar, 2006). Some applications include education systems (Lam and Zhao, 1998),
       quality control systems (Badri, 2001), plant layout design (Yang and Kuo, 2003), flexible
       manufacturing systems (Aravindan and Punniyamoorthy, 2002; Punniyamoorthy and
       Ragavan, 2003), material planning and control systems (Razmi et al., 2006); modelling
       supply chains (Gunasekaran et al., 2001), manufacturing systems (Harker, 1987),
       activity-based costing (Schniederjans and Garvin, 1997), and hospitals (Lee and Kwak,
       1999). More researchers are realizing that AHP is an important generic method and are
       applying it to various manufacturing areas (Andijani and Anwarul, 1997). Ghodsypour
       and O’Brien (1998) adopted the AHP to determine the relative importance weights of the
       suppliers with respect to three criteria: cost, quality, and service. Saaty (2003) studied the
       resource allocation problem in two merging companies.

       2.3 EBG model
       The Brown-Gibson model (Brown and Gibson, 1972) was developed for evaluating
       alternative plant locations using certain objective and subjective factors. This
       quantitative model helped in selecting the best location from a given set of alternatives.
          Aravindan and Punniyamoorthy (2002) and Punniyamoorthy and Ragavan (2003)
       used the modified Brown-Gibson model for the justification of technology selection in a
       manufacturing system. This EBG model has been used to assist in the strategic
       decision-making process considering both objective and subjective factors influencing the
       decision and addresses both time and cost dimensions in its objective factor measure (OFM).

       2.4 Quality deployment function
       QFD is an overall concept that provides a means of translating customer requirements
       into the appropriate technical requirements for each stage of product development and
       production (i.e. marketing strategies, planning, product design and engineering,
       prototype evaluation, production process development, production, and sales).
          QFD has been used since the early 1970s with the purpose of making the product
       development process more efficient (Govers, 2000). QFD may be used as a means for
       developing new products and to modify existing products (Nilsson, 1990). According to
                            ¨
       Bergman and Klevsjo (1994), the aim of QFD is to transfer the wants and needs of the
       customers into product and process characteristics by systematically letting the wishes
be reflected at every level of the product development process. As a means of                 An integrated
identifying the customer needs, questionnaire surveys are suggested. The importance          model for PM
of the different product characteristics also are analysed and ranked, and the most
important characteristic receives the highest ranking. This ranking often is carried out
by the company staff but should be made by actual customers. Further, the ranking
scales are insufficient due to the fact that the importance of the product characteristics
is estimated individually. The drawback using this method is that the product is not                 265
judged as a whole. In the QFD analysis, a matrix is used which is called the HOQ,
where the analysis is carried out in a number of steps.

3. Problem identification
Various authors have through their papers explored the application of AHP-QFD
combined tools in a variety of fields that range from education to sports. Koksal and
Egitman (1998) applied the combined AHP-QFD approach to improve the education
quality for a Middle East Technical University. Lam and Zhao (1998) used the combined
AHP-QFD approach to identify appropriate teaching techniques. The AHP was used to
evaluate the relative importance weightings of the students’ requirements with respect
to three criteria: skills development, interest and knowledge, and examination and job.
Wang et al. (1998) suggested that the HOQ can be represented as a hierarchy if AHP was
used together with QFD. The customer requirements and technical/design requirements
in QFD can therefore be regarded as the criteria and alternatives in the AHP,
respectively. Partovi (1999) applied the combined AHP-QFD approach to aid in project
selection. Partovi and Epperly (1999) used the combined AHP-QFD approach to
determine the composition of the US peacekeeping force deployed in Bosnia. Zakarian
and Kusiak (1999) evaluated and selected the multi-functional teams using the combined
AHP-QFD approach. Badri (1999) and Chuang (2001) applied the combined AHP-QFD
approach in the facility location problem. Kwong and Bai (2003) used the combined
AHP-QFD approach to aid in new product development. Lu et al. (1994) applied the
combined AHP-QFD approach to evaluate and select the functional characteristics of
environmentally friendly products. Partovi and Corredoira (2002) used the combined
AHP-QFD approach to prioritize and design rule changes for the game of soccer.
The objective was to increase the attractiveness to soccer enthusiasts. Myint (2003)
proposed the combined AHP-QFD approach to aid in product design. Bhattacharya et al.
(2005) applied the combined AHP-QFD approach to aid in robot selection. Partovi (2006)
used the combined AHP-QFD approach to evaluate and select facility location for a
company producing digital mass measurement weighted products for industrial use.
Hanumaiah et al. (2006) presented the combined AHP-QFD approach to deal with the
rapid tooling process selection.
    Our literature review shows that there is a research gap in the application of the
integrated AHP-QFD tool in the PM of the manufacturing sector.
    With this background, paper intends to exploit this unexplored area by using this tool
to create an integrated closed loop model for PM in the manufacturing sector. The
research seeks to devise an integrated methodology to evaluate and analyse the PM of
manufacturing organizations through the process of performance measurement aided
by multi-criterion decision-making tools such as AHP and EBG and the subsequent
improvement of the performance measures using QFD by constructing a suitable
HOQ matrix. The EBG model has been used to quantify the performance considering
BIJ    the objective and service quality factors. These factors are further evaluated by AHP
18,2   required for the EBG model. Whenever required, QFD has been used to redesign the
       existing processes. The developed model is further exemplified using a case study on
       two similar manufacturing units.

       4. Research method
266    The proposed model for PM in manufacturing organizations consists of two phases,
       the fundamental idea is to first measure the performance and if required set a strategy
       for performance improvement. The detailed discussion on the methodology is listed in
       a subsequent section.
           Phase 1. This phase is related to the manufacturing performance measurement. This
       will involve identifying the parameters and classifying them into objective and quality
       factors. The objective factors include the cost and time dimensions which can be further
       classified into effective or ineffective. A structured survey will then be conducted at the
       organizations included in the study. An OFM and quality measure will then be calculated.
       The EBG model is used to quantify the manufacturing performance measure. AHP is used
       to evaluate the manufacturing quality factor measure (QFM) required for the EBG model.
           Phase 2. This phase is related to the manufacturing performance improvement.
       In this phase, QFD is used to improve manufacturing performance. The basic steps for
       manufacturing performance improvement include:
           (1) Identifying the customer requirements.
           (2) Identifying the manufacturing design requirements (MDRs).
           (3) Relating customer requirements to MDRs.
           (4) Conducting an evaluation of competing manufacturers.
           (5) Evaluating the MDRs and development of targets.

       The processes that have been redesigned need to be implemented in the organization
       and need to be periodically reviewed so that the overall improvement of the
       performance quality of the organization can take place. The flowchart provided in
       Figure 1 illustrates the process.

       4.1 Manufacturing performance measurement
       Step 1. The organizations to be studied are decided and the various parameters that
       influence the performance are identified in this stage. Fundamentally, these are the
       variables required to measure the performance of an organization. Gomes et al. (2004)
       have identified about 65 parameters or measures classified under the following groups:
          .
             financial;
          .
             product quality and customer satisfaction;
          .
             process efficiency;
          .
             product and process innovation;
          .
             competitive environment;
          .
             quality/independence of management;
          .
             human resource management; and
          .
             social responsibility.
An integrated
          Identification of manufacturing performance parameters                     model for PM
                    based on the organization under study


  Classification of the above parameters into:
       • Objective factors: concern cost and time
                                                                                                  267
       • Quality factors: concern customer satisfaction


                                                                        PM
       Preparing a questionnaire incorporating the above factors and
                  conducting a survey in the organization


       1. Objective factor measure is calculated using the parameters
          involving cost and time
       2. Evaluation of quality factors using AHP


       Calculation of the system performance measure using EBG


                              Is the above
                                  value
YES                           satisfactory?

                                              NO


       Identification of characteristics to meet the new customer
                              requirements
                                                                             PI


                      Develop HOQ for the above


      Determination, development and deployment of the optimum
            requirements and strategies for process redesign


                    Review of implementation plan                                              Figure 1.
                                                                                  Decision-making process
BIJ    Some of the important performance measures that can be used are:
18,2     .
            operating cost per employee;
         .
            cost of goods sold per inventory;
         .
            product development time;
         .
            rejection ratio;
268      .
            actual production per planned production;
         .
            capacity utilization;
         .
            number of new products (past three years);
         .
            percent of products protected by patents;
         .
            customer surveys;
         .
            customer complaints;
         .
            service responsiveness; and
         .
            percent of returned orders.

       These parameters are the performance indicators of a manufacturing organization and
       can be effectively used for PM.
          Step 2. The parameters that are identified for the purpose of performance
       measurement are classified into objective and quality factors. These parameters
       depend on the overall operational structure of the manufacturing organization.
          4.1.1 Objective factors measurement. These factors measure an organization’s
       performance in terms of cost and time. The cost factors can be classified as effective
       and ineffective cost. Similarly, the time factors can also be classified as effective and
       ineffective time factors. The explanations of cost and time factors are given below:
          .
             Effective cost (EC). It involves the costs that need to be maximised in order to
             improve the performance, e.g. actual production vs planned production.
          .
             Ineffective cost (IEC). It involves the costs that need to be minimised in order to
             improve the performance, e.g. operating cost per employee.
          .
             Effective time (ET). All the productive time that goes into improving the
             performance of an organization is known as effective time, e.g. product
             development time.
          .
             Ineffective time (IET). All the non-productive time is known as ineffective time,
             e.g. age of plant and equipment.

       4.1.2 Quality factors measurement. These are the factors that pertain to the quality of
       the manufactured products and influence the performance of the organization. These
       factors are also identified by having discussions with certain groups in the organization
       involved in the process. These factors are then provided ratings on a fixed scale in
       relation to the customer’s perspective and the group’s response.
           Step 3. A structured survey is then conducted at the organization by preparing a
       suitable questionnaire for the purpose of incorporating the various parameters identified
       in terms of the respective factors.
           Step 4. After getting the required data from the organizations, the OFM is calculated.
       It is obtained in terms of cost and time effectiveness (CTE). The measure of effectiveness
is tangible and can be measured in terms of cost and time. The OFM of the organization        An integrated
is calculated using the following equation:                                                   model for PM
                                                      1
                               OFM ¼ CTE i · Pm                                        ð1Þ
                                                   i¼1 CTE i

The summation in equation (1) ranges from 1 to m, where m is the number of                            269
competitors.
  The CTE of competitor i is obtained from:
                                                       21
                            1                   1                      1
          CTE i ¼ EC i · Pm        þ IEC i · Pm             þET i · Pm
                          i¼1 EC i            i¼1 IEC i              i¼1 ET i
                                          21
                                 1
                    þ IET i · Pm                                                       ð2Þ
                               i¼1 IET i

where:
         m      ¼ the number of competitors.
         ECi    ¼ the effective cost of competitor i.
         IECi   ¼ the ineffective cost of competitor i.
         ETi    ¼ the effective time of competitor i.
         IETi   ¼ the ineffective time of competitor i.
Thus, the OFM is determined by equation (2).
   Step 5. In this step, the evaluation of the manufacturing QFM takes place. It is
done through AHP. The following steps are involved in the determination of QFM
through AHP:
   (1) Identify the manufacturing QFM that influence decision making in the
       organization and have an effect on performance.
   (2) Group the service quality factors based on their interdependence, as criteria,
       sub-criteria and sub-sub-criteria.
   (3) Formulate a hierarchical structure, i.e. the objective function is arranged in the
       top-level criteria, with sub-criteria and sub-sub-criteria in the intermediate level
       and alternatives at the lower levels for constructing a pairwise comparison
       matrix for each level.
   (4) Construct a pairwise comparison matrix A for each level. In this matrix, values
       ranging from 1 to 9 and their reciprocal values are assigned. The factors in a
       row are compared with the factors in a column and the comparison value is
       given in the intersecting cell. When the factor in a row is stronger (more
       significant) than the factor in a column, then the crossing cell is strong and its
       corresponding cell, which compares the latter with the former, takes a reciprocal
       value and is weak. The service managers of the organizations are involved in
       evaluating the criteria and the sub-criteria. Saaty’s (1980) nine-point scale is
       used for pairwise comparison:
BIJ                   .
                         1 – equally preferred;
18,2                  .
                         2 – equally to moderately preferred;
                      .
                         3 – moderately preferred;
                      .  4 – moderately to strongly preferred;
                      .
                         5 – equally preferred;
270                   .
                         6 – strongly to very strongly preferred;
                      .
                         7 – very strongly preferred;
                      .
                         8 – very to extremely strongly preferred; and
                      .
                         9 – extremely preferred.
                  (5) Determine the maximum eigenvalue (lmax) and its corresponding eigenvector
                      using the following equation:
                                                      A £ W ¼ lmax £ W                             ð3Þ
                      where:
                          A      ¼ observed matrix of pairwise comparison.
                          lmax ¼ largest eigenvalue of A.
                          W      ¼ principal eigenvector (a measure of relative importance weight –
                                   age of the criteria or sub-criteria or the alternative).
                  (6) Determine the consistency ratio (CR), the ratio between consistency index and
                      the random index using the following equation:
                                                             CI lmax 2 n
                                                      CR ¼      ¼                                  ð4Þ
                                                             RI   n21
                      where:
                          CI ¼ consistency index of A.
                          RI ¼ random index of A.
                          n ¼ order of matrix A.
               The random index value corresponding to n is determined from Table I.
                  When the CR is less than 0.10, the matrix is accepted as consistent.
                  Another comparison matrix B is constructed by comparing the alternatives with
               respect to each of the factors at the lowest level of the hierarchy. Using the survey
               results from the customers, matrix B is found as per Step 4. Steps 5 and 6 are carried
               out again in order to check the consistency of matrix B. The service factor measure
               (SFM) measure is calculated using matrices A and B. The SFM for competitor i with
               respect to j service quality factors is evaluated through the following equation:

Table I.       Order of matrix    1      2      3        4       5      6      7      8      9     10
Random index
calculation    Random index      0.00   0.00   0.58     0.90    1.12   1.24   1.32   1.41   1.45   1.49
X
   SFMi ¼    ðlocal weight of competitor w:r:t: criterion j from matrix BÞ                    An integrated
                                                                                        ð5Þ
            £ ðlocal weight of criterion j from matrix AÞ:                                    model for PM

Step 6. The system performance measure (SPM) is calculated in this step. For the
calculation, the EBG approach is used. In the EBG approach, both the objective and
quality factors found in the above steps are converted into consistent and dimensionless              271
indices to measure the SPM. The SPM of competitor i is found from equation (6):

                           SPM i ¼ aðOFM i Þ þ ð1 2 aÞSFM i                             ð6Þ

where, 0 , a , 1, a ¼ the objective factor weight and 1 –a ¼ the quality factor
weight.
   Step 7. The SPM is analysed in this step and the decisions about the manufacturing
design process is made. When the evaluated SPM value is found to be satisfactory,
then the organization can strive for the perfection in the quality of the services offered.
The measurement process needs to be continuously repeated and further improvement
opportunities need to be analysed. When the evaluated SPM value falls below a
satisfactory level, the design of the process itself is faulty and the redesigning of the
entire process becomes essential.

4.2 Manufacturing performance improvement
In the second phase, QFD is used to improve the service performance. The QFD
procedure uses a series of HOQ matrices to express the linkages between the inputs and
outputs of the different phases of development (Hauser and Clausing, 1988). In the
redesigning process, the HOQ needs to be developed and the optimum set of service
requirements needs to be determined. Building the first HOQ consists of five basic steps:
   (1) Identifying the customer requirements.
   (2) Identifying the service design requirements.
   (3) Relating the customer requirements to the service design requirements.
   (4) Conducting an evaluation of competing service providers.
   (5) Evaluating the service design requirements and development of targets.

Thus, new strategies have to be deployed and the implementation plans have to be
reviewed periodically.

5. Model validation by case study
To demonstrate the applicability of the model in manufacturing organizations, we rely
on a case study approach on two identical valve manufacturing companies, namely,
Unit A and Unit B, located at the Tiruchirappalli Regional Engineering College Science
and Technology Entrepreneurs Park in Tiruchirappalli, India. The details of the study
are provided below.

5.1 Manufacturing performance measurement
Step 1. The performance measures that influence the performance of the two companies
are identified through discussions with the company managers. About 15 factors were
BIJ    shortlisted and identified. These factors are grouped according to their respective
18,2   categories as:
          (1) Process efficiency:
               .
                  operating cost per employee;
               .
                  cost of goods sold;
272            .
                  product development time;
               .
                  rejection ratio;
               .
                  actual production against planned production;
               .
                  age of plant and equipment; and
               .
                  capacity utilization.
          (2) Product and process innovation:
               .
                  RD expenditure;
               .
                  number of new products in the last three years; and
               .
                  percent of products protected by patents.
          (3) Product quality and customer satisfaction:
               .
                  customer surveys and warranty claims;
               .
                  customer complaints;
               .
                  service responsiveness; and
               .
                  percent of returned orders.

       Step 2. The performance measures were classified into objective and quality factors as
       follows.
           Objective factors:
           (1) Effective cost:
               .
                  cost of goods sold;
               .
                  actual production against planned production;
               .
                  RD expenditure; and
               .
                  capacity utilization.
           (2) Ineffective cost:
               .
                  operating cost per employee;
               .  rejection ratio; and
               .
                  age of plant and equipment.

       Step 3. A structured survey was conducted at the two organizations, Unit A and Unit B
       using the sample questionnaire as shown in the methodology.
          Step 4. The OFM was now calculated in terms of CTE, from the structured survey
       conducted in Unit A and Unit B. The data from both manufacturing units are shown in
       Tables II and III.
The above data were collected and calculated from the above questionnaire:
                                                                                               An integrated
                                            58; 168                                              model for PM
  Cost Time Effectiveness ðCTEÞA ¼
                                       58; 168 þ 52; 800
                                                                      21          
                                                           825                 90
                                         þ                                þ
                                                 {ð1=1; 071Þ þ ð1=825Þ}     90 þ 120                         273
                                                                  21
                                                         4:5
                                         þ
                                                 {ð1=4:5Þ þ ð1=8:4Þ}

                                 ¼ 0:52142 þ 0:000003 þ 0:42857 þ 0:07584
                                 ¼ 1:02583
                                                     
                                          52; 800
  Cost Time Effectiveness ðCTEÞB ¼
                                     58; 168 þ 52; 800
                                                                      21               
                                                    1; 071                        120
                                         þ                                þ
                                           {ð1=1; 071Þ þ ð1=825Þ}              90 þ 120
                                                                  21
                                                   8:4
                                         þ
                                           {ð1=4:5Þ þ ð1=8:4Þ}

                                        ¼ 0:47581 þ 0:000002 þ 0:57143 þ 0:04063
                                        ¼ 1:0879
                                                                       
                                                          1:02583
       Objective Factor Measure ðOFMÞA ¼                                  ¼ 0:48532
                                                    1:02583 þ 1:08789
                                                                       
                                                          1:08789
        Objective Factor Measure ðOFMÞB ¼                                 ¼ 0:51468
                                                   1:02583 þ 1:08789
Step 5. Prioritization using AHP
   The criteria are prioritized in this step. The priorities are set by comparing each set
of elements pairwise with respect to each of the elements on a higher level (Table IV).
   This yields lmax ¼ 1:3431 þ 1:0485 þ 0:6298 þ 0:4294 þ 0:3168 þ 2:4720 þ
2:8186 þ 0:2142 ¼ 9:2724

Parameter                                  Cost of unit A                       Cost of unit B
                                                                                                          Table II.
Average effective cost                           58,168                             52,800           Cost data from
Average ineffective cost                            825                              1,071       manufacturing units


Parameter                           Time of unit A (days)                Time of unit B (days)

Average effective time                       90                                  120                      Table III.
Average ineffective time                      4.5                                  8.4                    Time data
BIJ
                                                                                                                                          18,2


                                                                                                                              274


  criteria
  Table IV.
  AHP matrix and its
  eigenvalues for various
                            Timely     Employee    Modern     Return on Cost of goods sold/ Work done right the    Process     Warranty   Eigen
                            delivery    morale    equipment     sales       inventory           first time         efficiency     claims    vector

Timely delivery                1          3           3           3              5                  1/3              1/5            5     1.343
Employee morale               1/3         1           5           3              3                  1/3              1/3            3     1.049
Modern equipment              1/3        1/5          1           3              3                  1/5              1/7            5     0.629
Return on sales               1/3        1/3         1/3          1              3                  1/7              1/7            3     0.429
Cost of goods sold/
inventory                     1/5        1/3         1/3         1/3             1                  1/7              1/5            3     0.317
Work done right the
first time                      3          3           5           7              7                   1                1             7     2.472
Process efficiency              5          3           7           7              5                   1                1             7     2.819
Warranty claims               1/5        1/3         1/5         1/3            1/3                 1/7              1/7            1     0.214
Order of the Matrix A ðnÞ ¼ 8:                                     An integrated
                                                 9:2724 2 8                                   model for PM
                    Consistency Index ðCIÞ ¼                ¼ 0:181
                                                    821
                                                  CI 0:181
                     Consistency Ratio ðCRÞ ¼        ¼      ¼ 0:12
                                                  RI   1:41                                           275
As per the AHP process, if the CR is less than or equal to 10 percent or 0.1, the matrix is
deemed consistent. The QFM is found from the principal eigenvector of the comparison
matrix A and individual factor comparison matrix B. The calculations are shown below:

   QFMA ¼ ð0:1395 £ 0:16Þ þ ð0:1094 £ 0:16Þ þ ð0:0724 £ 0:125Þ þ ð0:0505 £ 0:25Þ
          þ ð0:0386 £ 0:25Þ þ ð0:2687 £ 0:125Þ þ ð0:2945 £ 0:75Þ
             þ ð0:0252 £ 0:125Þ ¼ 0:329

   QFMB ¼ ð0:1395 £ 0:84Þ þ ð0:1094 £ 0:84Þ þ ð0:0724 £ 0:875Þ þ ð0:0505 £ 0:75Þ
             þ ð0:0386 £ 0:75Þ þ ð0:2687 £ 0:875Þ þ ð0:2945 £ 0:25Þ
             þ ð0:0252 £ 0:875Þ ¼ 0:67
Step 6. For a manufacturing industry, the value of a is taken as 0.4 because more
importance is given to the QFM than to the OFM. Using the SPM equation, the service
SPM for both units is calculated as:
               SPMA ¼ ð0:4 * 0:48532Þ þ ð1 2 0:4Þ * 0:3290 ¼ 0:391
               SPMB ¼ ð0:4 * 0:51468Þ þ ð1 2 0:4Þ * 0:67 ¼ 0:608
Using the EBG model, the performance of the manufacturing unit is measured.
From SPM, the performance of Unit A is lowered than Unit B (Table V). Hence, to
improve the performance of Unit A, the manufacturing parameter has to be redesigned.

5.2 Manufacturing performance improvement
From the system performance measurement values, we conclude that Unit A which has a
lower SPM value needs to be improved. QFD has been employed to facilitate this process.
This is useful in establishing the priority of actions within the overall re-engineering
strategy. A cascade of charts can be created dealing with the manufacturing process
hierarchy. In this way, all manufacturing design processes at whatever level may be
traced back to the customer and the effect of changes at any level in the performance
checked against the overall company strategy. Thus, QFD has the voice of the customer
in the manufacturing design improvements.
    Building of the first HOQ for Unit A consists of the following steps:
   (1) Identifying the customer requirements. The basic model of HOQ incorporates the
        customer requirements. This has already been ascertained in the EBG model.
        From the absolute weight column in the AHP matrix, it is very clear that the
        prioritized customer requirements are in the following order: process efficiency,
        work done right the first time, timely delivery, modern equipments, employee
        morale, return on sales, cost of goods sold per inventory and warranty claims.
BIJ
                    Quality parameters                      Unit A            Unit B            Eigenvector
18,2
                    Timely delivery
                    Unit A                                    1                 1/5                 0.16
                    Unit B                                    5                  1                  0.83
                    Employee morale
276                 Unit A                                    1                 1/5                 0.16
                    Unit B                                    5                  1                  0.83
                    Modern equipment
                    Unit A                                    1                 1/7                0.125
                    Unit B                                    7                  1                 0.875
                    Return on sales
                    Unit A                                    1                 1/3                 0.25
                    Unit B                                    3                  1                  0.75
                    Cost of goods sold per inventory
                    Unit A                                    1                 1/3                 0.25
                    Unit B                                    3                  1                  0.75
                    Work done right the first time
                    Unit A                                    1                 1/7                0.125
                    Unit B                                    7                  1                 0.875
                    Process efficiency
                    Unit A                                    1                 3                   0.75
                    Unit B                                   1/3                1                   0.25
                    Warranty claims
Table V.            Unit A                                    1                 1/7                0.125
Comparison matrix   Unit B                                    7                  1                  0.88


                       (2) Identifying the MDRs. The QFD team identifies the MDRs that are most needed
                           to fulfil the customer requirements. The MDRs identified are as follows: quality
                           characteristic, technical expertise development, strategic investment policy,
                           correct and thorough workmanship development, job scheduling, clarification
                           with the customer on the work to be done, an environment of attitudinal change,
                           rewards and recognition rules.
                       (3) Relating customer requirements to MDRs. The customer requirements are related
                           to MDRs through the central matrix construction. The central matrix provides the
                           degree of influence between each of the MDRs and the customer requirements.
                           The degree of the relationship has been identified and tabulated in Table VI.
                       (4) Conducting an evaluation of competing manufacturers. The customer
                           competitive assessment in the HOQ provides a good way to determine
                           whether the customer requirements have been met. It also indicates areas to be
                           concentrated upon during the next design review. It contains an appraisal of
                           where an organization stands relative to its major competitors in terms of each
                           requirement. The assessment values are obtained from the EBG model.
                       (5) To meet the customer requirements, the manufacturing organization has to
                           prioritize the MDRs and fix the targets for each MDRs.

                    After developing the HOQ for Unit A, we obtain the relative absolute weights of the
                    various design requirements with respect to the customer requirements. Thus, the design
                    requirements are prioritized according to their absolute weights in the HOQ matrix.
An
                                                                                           Clarification  environment Rewards
                                      Technical   Strategic  Correct and                     with the         of         and
                        Quality        expertise investment   thorough        Job        customer on the attitudinal recognition
                     characteristics development   policy   workmanship    scheduling    work to be done   change       rules

Timely
delivery                  W               †                       †            †               †              †           †          0.83     0.139
Modern
equipment                  †                          †           W                                                                  0.83     0.109
Employee
morale                    W              W                        †                                           †           †        0.875      0.724
Return on
sales                      †                          †                        W                                          †          0.75     0.0505
Cost of
goods
sold/
inventory                 W                           †                        †                                                     0.75     0.0386
Work
done right
the first
time                      W               †                       †                            W              D           D          0.88     0.2687
Process
efficiency                  †             W            D           D            †                                                     0.25     0.2945
Warranty
claims                     D                                      D                                                                0.875      0.0252
Absolute
weights                    5.67          4.77        2.07        4.75          4.3            1.52            2.17        2.63
Targets                  Process     One training   Policy    Continuous      Better     Organizational     Regular    Incentives Target    Absolute
                     reliability and   in two       review     training     operations    accessibility   motivational and bonus value       weight
                     improvement       months       once in                management                      programs     schemes             from ahp
                                                      two                                                                                   matrix (w)
                                                    months
Notes: W – Moderately related (three points); † – strongly related (nine points); D – weakly related (one point)
                                                                                                                                               An integrated


  House of quality
                                                                                                                               277
                                                                                                                                               model for PM


       Table VI.
BIJ    Further, in accordance with these prioritized MDRs, the targets to meet these MDRs have
18,2   been identified and employed by the QFD team. The prioritized orders of the MDRs and
       the targets to achieve are listed below.
          The priority orders of the MDRs are: quality characteristics, technical expertise
       development, correct and thorough workmanship, job scheduling, rewards and
       recognition rules, an environment for attitudinal change, strategic investment policy,
278    and clarification with the customer on the work to be done. The targets are as follows:
          .
             Quality characteristics – process reliability improvement.
          .
             Technical expertise development – training once in two months.
          .
             Correct and thorough workmanship – continuous training.
          .
             Job scheduling – better operations management.
          .
             Rewards and recognition rules – company policy of bonuses and incentives.
          .
             An environment of attitudinal change – motivational programs every month.
          .
             Strategy investment policy – policy review once in two months.
          .
             Clarification with the customer on the work to be done – organizational
             accessibility.

       6. Conclusion
       This paper demonstrates the need for a manufacturing PM model. A literature survey has
       been carried out on the various frameworks and tools used. An integrated closed model to
       enhance PM has been proposed. It also provides a means to identifying the current
       performance of an organization and a methodology to improve it further. An important
       contribution of this model is that it combines both qualitative and quantitative
       dimensions of manufacturing performance measurement. The proposed model provides
       an opportunity to operationalise the relationship among the cost, time, and service
       quality dimensions. Both objective and manufacturing quality factors have been
       converted into consistent dimensionless indices to measure the system performance.
          The case study presented in this paper has demonstrated the applicability of the
       model to support a manufacturing unit. It has shown how performance measures are
       identified and how they can be calculated for two different units using time, cost, and
       service quality dimensions. The case study proves the usability of the EBG model for
       the PM process. From the SPM, the performance of the manufacturing organizations is
       analysed and manufacturing parameters is redesigned using QFD wherever necessary.
          Improving performance is a never-ending process and organizations should strive
       to achieve it for attaining the optimal level of cost and profit, as well as increase
       customer satisfaction and goodwill, and gain potential future business. Hence, the
       process of measuring and redesigning the manufacturing performance measures needs
       to be monitored and the implementation plans reviewed often. Finally, this model
       for PM can be extended to the service sector.

       References
       Amaratunga, D. and Baldry, D. (2002), “Moving from performance measurement to performance
             management”, Facilities, Vol. 20 Nos 5/6, pp. 217-23.
       Andijani, A. and Anwarul, M. (1997), “Manufacturing blocking discipline: a multi-criterion approach
             for buffer allocations”, International Journal of Production Economics, Vol. 51, pp. 155-63.
Aravindan, P. and Punniyamoorthy, M. (2002), “Justification of advanced manufacturing                 An integrated
      technology (AMT)”, International Journal of Advanced Manufacturing Technology, Vol. 19
      No. 2, pp. 151-6.                                                                              model for PM
Badri, M.A. (1999), “Combining the analytic hierarchy process and goal programming for global
      facility location-allocation problem”, International Journal of Production Economics,
      Vol. 62 No. 3, pp. 237-48.
Badri, M.A. (2001), “A combined AHP-GP model for quality control systems”, International                     279
      Journal of Production Economics, Vol. 72 No. 1, pp. 27-40.
                          ¨
Bergman, B. and Klevsjo, B. (1994), Quality from Customer Needs to Customer Satisfaction,
      McGraw-Hill, London.
Berrach, L. and Cliville, V. (2007), “Towards an aggregation performance measurement system
      model in a supply chain context”, Computers in Industry, Vol. 58, pp. 709-19.
Bhattacharya, A., Sarkar, B. and Mukherjee, S.K. (2005), “Integrating AHP with QFD for robot
      selection under requirement perspective”, International Journal of Production Research,
      Vol. 43 No. 17, pp. 3671-85.
Brown, P.A. and Gibson, D.F. (1972), “A quantified model for facility site selection application to
      multi-plant location problem”, AIIE Transactions, Vol. 4 No. 1, pp. 1-10.
Chuang, P.T. (2001), “Combining the analytic hierarchy process and quality function deployment
      for a location decision from a requirement perspective”, International Journal of Advanced
      Manufacturing Technology, Vol. 18 No. 11, pp. 842-9.
Fitzgerald, L., Johnson, R., Brignall, S., Silvestro, R. and Voss, C. (1991), Performance
      Measurement in Service Business, CIMA, London.
Folan, P. and Browne, J. (2005), “A review of performance measurement: towards performance
      management”, Computers in Industry, Vol. 56, pp. 663-80.
Garvin, D.A. (1993), “Building a learning organization”, Harvard Business Review, Vol. 71 No. 4,
      pp. 78-91.
Ghodsypour, S.H. and O’Brien, C. (1998), “A decision support system for supplier selection using
      an integrated analytic hierarchy process and linear programming”, International Journal
      of Production Economics, Vol. 56-57, pp. 199-212.
Gomes, C.F., Yasin, M.M. and Lisboa, J.V. (2004), “A literature review of manufacturing
      performance measures and measurement in an organizational context: a framework and
      direction for future research”, Journal of Manufacturing Technology Management, Vol. 15
      No. 16, pp. 511-30.
Govers, C.P.M. (2000), “QFD is not only a tool but also a way of quality management”,
      International Journal of Production Economics, Vol. 7 No. 1, pp. 151-9.
Gunasekaran, A., Patel, C. and Tirtirogulu, E. (2001), “Performance measures and metrics in
      supply chain environment”, International Journal of Operations  Production
      Management, Vol. 21 Nos 1/2, pp. 71-87.
Hanumaiah, N., Ravi, B. and Mukherjee, N.P. (2006), “Rapid hard tooling process selection using
      QFD-AHP methodology”, Journal of Manufacturing Technology Management, Vol. 17
      No. 3, pp. 332-50.
Harker, P.T. (1987), “Incomplete pairwise comparisons in the analytic hierarchy process”,
      Mathematical Modeling, Vol. 9 No. 11, pp. 837-48.
Hauser, J.R. and Clausing, D. (1988), “The house of quality”, Harvard Business Review, Vol. 66,
      May/June, pp. 63-73.
Kaydos, W. (1991), Measuring, Managing and Maximising Performance, Productivity Press,
      Cambridge, MA.
BIJ    Keegan, D., Eiler, R. and Jones, C. (1989), “Are your performance measures obsolete”,
             Management Accounting, Vol. 70 No. 12, pp. 45-50.
18,2
       Koksal, G. and Egitman, A. (1998), “Planning and design of industrial engineering education
             quality”, Computers  Industrial Engineering, Vol. 35 Nos 3/4, pp. 639-42.
       Kwong, C.K. and Bai, H. (2003), “Determining the importance weights for the customer
             requirements in QFD using a fuzzy AHP with an extent analysis approach”,
280          IIE Transactions, Vol. 35 No. 7, pp. 619-26.
       Lam, K. and Zhao, X. (1998), “An application of quality function deployment to improve the
             quality of teaching”, International Journal of Quality  Reliability Management, Vol. 15
             No. 4, pp. 389-413.
       Lee, C.W. and Kwak, N.K. (1999), “Information resource planning for a health care system using
             an AHP-based goal programming method”, Journal of the Operational Research Society,
             Vol. 50 No. 12, pp. 1191-8.
       Lockamy, A. III (1998), “Quality-focused performance measurement systems: a normative model”,
             International Journal of Operations  Production Management, Vol. 18 No. 8, pp. 740-66.
       Lu, M., Madu, C.N., Kuei, C. and Winokur, D. (1994), “Integrating QFD, AHP and benchmarking
             in strategic marketing”, Journal of Business  Industrial Marketing, Vol. 91, pp. 41-50.
       Lynch, R. and Cross, K. (1991), Measure Up: Yardsticks for Continuous Improvement, Blackwell,
             Cambridge, MA.
       Myint, S. (2003), “A framework of an intelligent quality function deployment (IQFD) for discrete
             assembly environment”, Computers  Industrial Engineering, Vol. 45 No. 2, pp. 269-83.
       Neely, A., Gregory, M. and Platts, K. (1995), “Performance measurement system design a
             literature review and research agenda”, International Journal of Operations  Production
             Management, Vol. 15 No. 4, pp. 80-116.
       Neely, A., Richards, H., Mills, J., Platts, K. and Bourne, M. (1997), “Designing performance
             measures: a structured approach”, International Journal of Operations  Production
             Management, Vol. 17 No. 11, pp. 1131-52.
                                                                               ¨          ¨
       Nilsson, C. (1990), Handbok in QFD, Mekanresultat 90002, Mekanforbundets forlag, Stockholm,
             Sverige (in Swedish).
       Partovi, F.Y. (1999), “A quality function deployment approach to strategic capital budgeting”,
             The Engineering Economist, Vol. 44 No. 3, pp. 239-60.
       Partovi, F.Y. (2006), “An analytic model for locating facilities strategically”, Omega, Vol. 34 No. 1,
             pp. 41-55.
       Partovi, F.Y. and Corredoira, R.A. (2002), “Quality function deployment for the good of soccer”,
             European Journal of Operational Research, Vol. 137 No. 3, pp. 642-56.
       Partovi, F.Y. and Epperly, J.M. (1999), “A quality function deployment approach to task
             organization in peacekeeping force design”, Socio-economic Planning Sciences, Vol. 33
             No. 2, pp. 131-49.
       Punniyamoorthy, M. and Ragavan, V.P. (2003), “A strategic decision model for the justification of
             technology selection”, International Journal of Advanced Manufacturing Technology,
             Vol. 21, pp. 72-8.
       Razmi, J., Zairi, M. and Gunasekaran, A. (2006), “The application of analytic hierarchy process in
             classification of material planning and control systems”, International Journal of Services
             and Operations Management, Vol. 2 No. 4, pp. 352-66.
       Rouse, P. and Putterill, M. (2003), “An integral framework for performance measurement”,
             Management Decision, Vol. 41 No. 8, pp. 791-805.
Saaty, T.L. (1980), The Analytic Hierarchy Process, McGraw-Hill, New York, NY.                        An integrated
Saaty, T.L. (2003), “Decision-making with the AHP: why is the principal eigenvector necessary”,       model for PM
      European Journal of Operational Research, Vol. 145 No. 1, pp. 85-91.
Schniederjans, M.J. and Garvin, T. (1997), “Using the analytic hierarchy process and
      multi-objective programming for the selection of cost drivers in activity-based costing”,
      European Journal of Operational Research, Vol. 100 No. 1, pp. 72-80.
Sink, D.S. and Tuttle, T.C. (1989), Planning and Measurement in Your Organisation of the                      281
      Future, Industrial Engineering and Management, Norcross, GA.
Tan, B.L., Tang, K.H. and Forrester, P.L. (2004), “Application of QFD for e-business planning”,
      Production Planning  Control, Vol. 15 No. 8, pp. 802-18.
Tang, J., Fung, R.Y.K., Xu, B. and Wang, D. (2002), “A new approach to quality function
      deployment planning with financial consideration”, Computer and Operations Research,
      Vol. 29 No. 11, pp. 1447-63.
Tangen, S. (2004), “Performance measurement: from philosophy to practice”, International
      Journal of Productivity and Performance Management, Vol. 53 No. 8, pp. 726-37.
Vaidya, O.S. and Kumar, S. (2006), “Analytic hierarchy process: an overview of applications”,
      European Journal of Operational Research, Vol. 169 No. 1, pp. 1-29.
Wang, H., Xie, M. and Goh, T.N. (1998), “A comparative study of the prioritization matrix method
      and the analytic hierarchy process technique in quality function deployment”,
      Total Quality Management, Vol. 9 No. 6, pp. 421-30.
Wisner, J. and Fawcett, S. (1991), “Linking firm strategy to operating decisions through performance
      measurement”, Production  Inventory Management Journal, Vol. 32 No. 3, pp. 5-11.
Yang, T. and Kuo, C. (2003), “A hierarchical AHP/DEA methodology for the facilities layout
      design problem”, European Journal of Operational Research, Vol. 147 No. 1, pp. 128-36.
Yeniyurt, S. (2003), “A literature review and integrative performance measurement framework
      for multinational companies”, Marketing Intelligence  Planning, Vol. 21 No. 3, pp. 134-42.
Zakarian, A. and Kusiak, A. (1999), “Forming teams: an analytic approach”, IIE Transactions,
      Vol. 31 No. 1, pp. 85-97.

Further reading
Madu, C.N. (2000), House of Quality in a Minute, CHI, Fairfield, CT.
Tyagi, R. and Das, C. (1997), “A methodology for cost versus service tradeoffs in whole sale
     location-distribution using mathematical programming and analytic hierarchy process”,
     Journal of Business Logistics, Vol. 18 No. 2, pp. 77-99.

Corresponding author
Mark Goh can be contacted at: bizgohkh@nus.edu.sg


To purchase reprints of this article please e-mail: reprints@emeraldinsight.com
Or visit our web site for further details: www.emeraldinsight.com/reprints

5.an integrated

  • 1.
    The current issueand full text archive of this journal is available at www.emeraldinsight.com/1463-5771.htm An integrated An integrated model model for PM for performance management of manufacturing units 261 P. Parthiban Department of Production Engineering, National Institute of Technology, Tiruchirappalli, India, and Mark Goh NUS Business School, National University of Singapore, Singapore and School of Management, University of South Australia, Adelaide, Australia Abstract Purpose – The objective of this paper is to develop an integrated model for performance management (PM) of manufacturing industries. Design/methodology/approach – The proposed integrated model consists of performance measurement by the extended Brown Gibson model by considering the objective and the service quality factors. The quality factor measure has been evaluated by using the analytic hierarchy process. On the non-compliance of the performance measures with the satisfactory levels, quality function deployment is used to redesign the existing manufacturing process. Findings – This study provides a way to identify the current performance of an organization and a methodology for further improvement. An important contribution of this model is that it combines both the qualitative and quantitative dimensions of manufacturing performance measurement. Both the objective and manufacturing quality factors have been converted into consistent dimensionless indices to measure system performance. Practical implications – This study has demonstrated the applicability of the model to support a manufacturing unit. It has shown how performance measures have been identified and how they can be used to calculate the two different manufacturing units using time, cost and service quality dimensions. Improving performance is a never-ending process and organizations should strive to achieve it to attain the optimal level of cost and profit, as well as increase customer satisfaction and goodwill, and gain potential future business. Hence, the process of measuring and redesigning manufacturing performance measures needs to be monitored and the implementation plans reviewed often, which is successfully done by this integrated model. Originality/value – We contend that the integrated model for PM, illustrated with a practical case in this paper makes a contribution to the never-ending process of performance enhancement for both theory and application, and assists in expanding the boundaries of theory and practicality in this area, thus highlighting the novelty of our approach. Keywords Analytical hierarchy process, House of quality, Quality function deployment, Performance management Paper type Research paper 1. Introduction Benchmarking: An International Globalisation and liberalisation create a need for having a manufacturing management Journal Vol. 18 No. 2, 2011 system to estimate the performance of the manufacturing industry. Amaratunga and pp. 261-281 Baldry (2002) define performance management (PM) as the use of performance q Emerald Group Publishing Limited 1463-5771 measurement information to effect a positive change in the organizational culture, DOI 10.1108/14635771111121702
  • 2.
    BIJ systems and processes, by helping to set agreed-upon performance goals, allocating and 18,2 prioritizing resources, informing managers to either confirm or change current policy or programs direction to meet these goals and sharing the results of performance in pursuing these goals. PM both precedes and follows performance measurement. The effective conduct of PM is generally divided into two stages: (1) performance measurement; and 262 (2) performance improvement. Performance measurement is recognized as an important part of the manufacturing strategy literature. It is a process of quantifying actions, where measurement is the process of quantification and action correlates with performance. The definitions of three important terms in the context of performance measurement as given by Neely et al. (1995) are the process of quantifying the efficiency and effectiveness of action. A performance measurement system can be examined at three different levels: the individual performance measures, the performance measurement system as an entity, the relationship between the performance measurement system and the environment in which it operates. The key to the evaluation of performance measurement in our view has to be based first and foremost on identifying the function of the performance measurement system; and this, again, depends largely on the organizational context and the organizational culture management intent and strategy. Thus, performance measurement sets the agenda for bringing the more relevant-, integrated-, balanced-, strategic- and improvement-oriented PM (Tangen, 2004). Performance improvement is the positive change which is brought about by process re-engineering, reflecting the concern of the customer. Process improvement identifies the redundant and missing performance measures, as well as identifies potential conflicts between performance measures and targets for each performance measure. Quality function deployment (QFD) has been used to improve the manufacturing process improvement. This technique converts the “voice of the customer” into design, engineering, manufacturing and production terms to ensure the product meets the needs of the customer. Therefore, it is an effective tool to integrate marketing strategy with product development process. The QFD procedure uses a series of matrices called house of quality (HOQ), to express the linkages between the inputs and outputs of the different phases of development (Hauser and Clausing, 1988). The HOQ typically contains information on the “what to do” (customer requirements), “how to do” (engineering characteristics), relation measures between customer requirements and engineering characteristic’s, as well as the correlation measures among the engineering characteristics and benchmarking data compared to competitors (Tan et al., 2004; Tang et al., 2002). In the redesign process, the HOQ needs to be developed and the optimal set of service requirements needs to be determined. Thus, the objective of this paper is to demonstrate the need for the manufacturing PM model, integrating performance measurement and performance improvement. Moreover, it explores the relationship between the measuring variables considering the objective and service quality factors, which are based not only on costumer focus but also on the technical parameters based on the operational system. The paper is organized as follows. A brief theoretical background is presented on the performance measurement framework, and performance measuring tools are
  • 3.
    discussed followed bythe problem identification and research methodology. A case An integrated study of two manufacturing units to illustrate the applicability of the model follows. model for PM 2. Theoretical background The following reviews serve as the background within which measurement of manufacturing performance is undertaken and the subsequent development of the integrated model is proposed. Next, the framework and dimensions on PM are presented. 263 2.1 Review on performance measurement framework Performance measurement has not received much attention from researchers and practitioners, however, organizational performance has always exerted considerable influence on the working and decisive actions of companies. Garvin (1993) coined a phrase in the Harvard Business Review that has become paradigmatic for this view: “If you cannot measure it, you cannot manage it”. Thus, the ways and means of accurately measuring the performance is perceived as being an increasingly important field of research for both organizations and academics alike. Indeed, in the past 15 years, performance measurement has been seen to make its mark, reflecting its importance in an increasing number of fields (Rouse and Putterill, 2003). The mid to late 1990s seem to have seen the peak of this activity. Consequently, numerous frameworks on performance measurement have been developed in many fields (Yeniyurt, 2003). One of the first frameworks put forward for the process of performance measurement was by Sink and Tuttle (1989), it describes a six-step procedure for performance measurement in the planning phase: effectiveness, efficiency, and quality, and productivity, quality of work life, innovation and profitability/budget ability. Keegan et al. (1989) developed a model which presented the structural performance measurement matrix that examined external/internal and cost/non-cost performance measures, while the results and determinants framework proposed by Fitzgerald et al. (1991) described the financial performance competitiveness, quality, flexibility, resource utilization, and innovation as the determinants. Lockamy (1998) has proposed four theoretical performance measurement system models for the dimensions of cost, quality, lead time, and delivery based on research into the linkages between the operational and strategic PM systems in a small number of world-class manufacturing companies. Lynch and Cross (1991) proposed the structural performance pyramid, which highlights a hierarchical view of business performance measurement, and a ten-step procedural model encompassing vision, market, financial, customer satisfaction, flexibility, productivity, quality, delivery, cycle time, and waste to describe what needs to be done in terms of PM. Both Kaydos (1991) and Wisner and Fawcett (1991) have proposed procedural stepwise framework models, while the structural-balanced scorecard attempts to introduce the concept of producing a “balanced” set of measures (i.e. non-financial “balanced” against financial measures). Berrach and Cliville (2007) proposed building performance measurement systems by linking an overall performance expression to elementary ones. As global frameworks, the analytic hierarchy process (AHP) or MACBETH methodologies were suggested. Neely et al. (1997) emphasized the role of performance measurement and matrices in setting objectives for evaluating performance, and determining future courses of action. They further suggested that “time” can be used as a strategic metric in PM. Folan and Browne (2005) described the evolution of the performance measurement in four sections: recommendations, frameworks, systems, and inter-organizational performance measurement. A holistic analysis with cost,
  • 4.
    BIJ time, and service quality as the coherent dimensions of performance measure is rarely 18,2 found in the literature. The next section discusses the literature on the various tools namely AHP, QFD and the extended Brown-Gibson (EBG) model used in the paper. 2.2 Review on AHP 264 AHP, developed by Saaty (1980), is a decision-making tool that can help to describe the general decision operation by decomposing a complex problem into a multi-level hierarchical structure of objectives, criteria, sub-criteria, and alternatives. The wide applicability is due to its simplicity, ease of use and great flexibility. AHP consists of three main operations, including hierarchy construction, priority analysis, and consistency verification. AHP has been designed for situations in which ideas, feelings and emotions are quantified based on subjective judgement to provide a numeric scale for prioritizing decision alternatives. The usability of AHP in solving multiple criteria problems can be appreciated with its diverse applications in various fields (Vaidya and Kumar, 2006). Some applications include education systems (Lam and Zhao, 1998), quality control systems (Badri, 2001), plant layout design (Yang and Kuo, 2003), flexible manufacturing systems (Aravindan and Punniyamoorthy, 2002; Punniyamoorthy and Ragavan, 2003), material planning and control systems (Razmi et al., 2006); modelling supply chains (Gunasekaran et al., 2001), manufacturing systems (Harker, 1987), activity-based costing (Schniederjans and Garvin, 1997), and hospitals (Lee and Kwak, 1999). More researchers are realizing that AHP is an important generic method and are applying it to various manufacturing areas (Andijani and Anwarul, 1997). Ghodsypour and O’Brien (1998) adopted the AHP to determine the relative importance weights of the suppliers with respect to three criteria: cost, quality, and service. Saaty (2003) studied the resource allocation problem in two merging companies. 2.3 EBG model The Brown-Gibson model (Brown and Gibson, 1972) was developed for evaluating alternative plant locations using certain objective and subjective factors. This quantitative model helped in selecting the best location from a given set of alternatives. Aravindan and Punniyamoorthy (2002) and Punniyamoorthy and Ragavan (2003) used the modified Brown-Gibson model for the justification of technology selection in a manufacturing system. This EBG model has been used to assist in the strategic decision-making process considering both objective and subjective factors influencing the decision and addresses both time and cost dimensions in its objective factor measure (OFM). 2.4 Quality deployment function QFD is an overall concept that provides a means of translating customer requirements into the appropriate technical requirements for each stage of product development and production (i.e. marketing strategies, planning, product design and engineering, prototype evaluation, production process development, production, and sales). QFD has been used since the early 1970s with the purpose of making the product development process more efficient (Govers, 2000). QFD may be used as a means for developing new products and to modify existing products (Nilsson, 1990). According to ¨ Bergman and Klevsjo (1994), the aim of QFD is to transfer the wants and needs of the customers into product and process characteristics by systematically letting the wishes
  • 5.
    be reflected atevery level of the product development process. As a means of An integrated identifying the customer needs, questionnaire surveys are suggested. The importance model for PM of the different product characteristics also are analysed and ranked, and the most important characteristic receives the highest ranking. This ranking often is carried out by the company staff but should be made by actual customers. Further, the ranking scales are insufficient due to the fact that the importance of the product characteristics is estimated individually. The drawback using this method is that the product is not 265 judged as a whole. In the QFD analysis, a matrix is used which is called the HOQ, where the analysis is carried out in a number of steps. 3. Problem identification Various authors have through their papers explored the application of AHP-QFD combined tools in a variety of fields that range from education to sports. Koksal and Egitman (1998) applied the combined AHP-QFD approach to improve the education quality for a Middle East Technical University. Lam and Zhao (1998) used the combined AHP-QFD approach to identify appropriate teaching techniques. The AHP was used to evaluate the relative importance weightings of the students’ requirements with respect to three criteria: skills development, interest and knowledge, and examination and job. Wang et al. (1998) suggested that the HOQ can be represented as a hierarchy if AHP was used together with QFD. The customer requirements and technical/design requirements in QFD can therefore be regarded as the criteria and alternatives in the AHP, respectively. Partovi (1999) applied the combined AHP-QFD approach to aid in project selection. Partovi and Epperly (1999) used the combined AHP-QFD approach to determine the composition of the US peacekeeping force deployed in Bosnia. Zakarian and Kusiak (1999) evaluated and selected the multi-functional teams using the combined AHP-QFD approach. Badri (1999) and Chuang (2001) applied the combined AHP-QFD approach in the facility location problem. Kwong and Bai (2003) used the combined AHP-QFD approach to aid in new product development. Lu et al. (1994) applied the combined AHP-QFD approach to evaluate and select the functional characteristics of environmentally friendly products. Partovi and Corredoira (2002) used the combined AHP-QFD approach to prioritize and design rule changes for the game of soccer. The objective was to increase the attractiveness to soccer enthusiasts. Myint (2003) proposed the combined AHP-QFD approach to aid in product design. Bhattacharya et al. (2005) applied the combined AHP-QFD approach to aid in robot selection. Partovi (2006) used the combined AHP-QFD approach to evaluate and select facility location for a company producing digital mass measurement weighted products for industrial use. Hanumaiah et al. (2006) presented the combined AHP-QFD approach to deal with the rapid tooling process selection. Our literature review shows that there is a research gap in the application of the integrated AHP-QFD tool in the PM of the manufacturing sector. With this background, paper intends to exploit this unexplored area by using this tool to create an integrated closed loop model for PM in the manufacturing sector. The research seeks to devise an integrated methodology to evaluate and analyse the PM of manufacturing organizations through the process of performance measurement aided by multi-criterion decision-making tools such as AHP and EBG and the subsequent improvement of the performance measures using QFD by constructing a suitable HOQ matrix. The EBG model has been used to quantify the performance considering
  • 6.
    BIJ the objective and service quality factors. These factors are further evaluated by AHP 18,2 required for the EBG model. Whenever required, QFD has been used to redesign the existing processes. The developed model is further exemplified using a case study on two similar manufacturing units. 4. Research method 266 The proposed model for PM in manufacturing organizations consists of two phases, the fundamental idea is to first measure the performance and if required set a strategy for performance improvement. The detailed discussion on the methodology is listed in a subsequent section. Phase 1. This phase is related to the manufacturing performance measurement. This will involve identifying the parameters and classifying them into objective and quality factors. The objective factors include the cost and time dimensions which can be further classified into effective or ineffective. A structured survey will then be conducted at the organizations included in the study. An OFM and quality measure will then be calculated. The EBG model is used to quantify the manufacturing performance measure. AHP is used to evaluate the manufacturing quality factor measure (QFM) required for the EBG model. Phase 2. This phase is related to the manufacturing performance improvement. In this phase, QFD is used to improve manufacturing performance. The basic steps for manufacturing performance improvement include: (1) Identifying the customer requirements. (2) Identifying the manufacturing design requirements (MDRs). (3) Relating customer requirements to MDRs. (4) Conducting an evaluation of competing manufacturers. (5) Evaluating the MDRs and development of targets. The processes that have been redesigned need to be implemented in the organization and need to be periodically reviewed so that the overall improvement of the performance quality of the organization can take place. The flowchart provided in Figure 1 illustrates the process. 4.1 Manufacturing performance measurement Step 1. The organizations to be studied are decided and the various parameters that influence the performance are identified in this stage. Fundamentally, these are the variables required to measure the performance of an organization. Gomes et al. (2004) have identified about 65 parameters or measures classified under the following groups: . financial; . product quality and customer satisfaction; . process efficiency; . product and process innovation; . competitive environment; . quality/independence of management; . human resource management; and . social responsibility.
  • 7.
    An integrated Identification of manufacturing performance parameters model for PM based on the organization under study Classification of the above parameters into: • Objective factors: concern cost and time 267 • Quality factors: concern customer satisfaction PM Preparing a questionnaire incorporating the above factors and conducting a survey in the organization 1. Objective factor measure is calculated using the parameters involving cost and time 2. Evaluation of quality factors using AHP Calculation of the system performance measure using EBG Is the above value YES satisfactory? NO Identification of characteristics to meet the new customer requirements PI Develop HOQ for the above Determination, development and deployment of the optimum requirements and strategies for process redesign Review of implementation plan Figure 1. Decision-making process
  • 8.
    BIJ Some of the important performance measures that can be used are: 18,2 . operating cost per employee; . cost of goods sold per inventory; . product development time; . rejection ratio; 268 . actual production per planned production; . capacity utilization; . number of new products (past three years); . percent of products protected by patents; . customer surveys; . customer complaints; . service responsiveness; and . percent of returned orders. These parameters are the performance indicators of a manufacturing organization and can be effectively used for PM. Step 2. The parameters that are identified for the purpose of performance measurement are classified into objective and quality factors. These parameters depend on the overall operational structure of the manufacturing organization. 4.1.1 Objective factors measurement. These factors measure an organization’s performance in terms of cost and time. The cost factors can be classified as effective and ineffective cost. Similarly, the time factors can also be classified as effective and ineffective time factors. The explanations of cost and time factors are given below: . Effective cost (EC). It involves the costs that need to be maximised in order to improve the performance, e.g. actual production vs planned production. . Ineffective cost (IEC). It involves the costs that need to be minimised in order to improve the performance, e.g. operating cost per employee. . Effective time (ET). All the productive time that goes into improving the performance of an organization is known as effective time, e.g. product development time. . Ineffective time (IET). All the non-productive time is known as ineffective time, e.g. age of plant and equipment. 4.1.2 Quality factors measurement. These are the factors that pertain to the quality of the manufactured products and influence the performance of the organization. These factors are also identified by having discussions with certain groups in the organization involved in the process. These factors are then provided ratings on a fixed scale in relation to the customer’s perspective and the group’s response. Step 3. A structured survey is then conducted at the organization by preparing a suitable questionnaire for the purpose of incorporating the various parameters identified in terms of the respective factors. Step 4. After getting the required data from the organizations, the OFM is calculated. It is obtained in terms of cost and time effectiveness (CTE). The measure of effectiveness
  • 9.
    is tangible andcan be measured in terms of cost and time. The OFM of the organization An integrated is calculated using the following equation: model for PM 1 OFM ¼ CTE i · Pm ð1Þ i¼1 CTE i The summation in equation (1) ranges from 1 to m, where m is the number of 269 competitors. The CTE of competitor i is obtained from: 21 1 1 1 CTE i ¼ EC i · Pm þ IEC i · Pm þET i · Pm i¼1 EC i i¼1 IEC i i¼1 ET i 21 1 þ IET i · Pm ð2Þ i¼1 IET i where: m ¼ the number of competitors. ECi ¼ the effective cost of competitor i. IECi ¼ the ineffective cost of competitor i. ETi ¼ the effective time of competitor i. IETi ¼ the ineffective time of competitor i. Thus, the OFM is determined by equation (2). Step 5. In this step, the evaluation of the manufacturing QFM takes place. It is done through AHP. The following steps are involved in the determination of QFM through AHP: (1) Identify the manufacturing QFM that influence decision making in the organization and have an effect on performance. (2) Group the service quality factors based on their interdependence, as criteria, sub-criteria and sub-sub-criteria. (3) Formulate a hierarchical structure, i.e. the objective function is arranged in the top-level criteria, with sub-criteria and sub-sub-criteria in the intermediate level and alternatives at the lower levels for constructing a pairwise comparison matrix for each level. (4) Construct a pairwise comparison matrix A for each level. In this matrix, values ranging from 1 to 9 and their reciprocal values are assigned. The factors in a row are compared with the factors in a column and the comparison value is given in the intersecting cell. When the factor in a row is stronger (more significant) than the factor in a column, then the crossing cell is strong and its corresponding cell, which compares the latter with the former, takes a reciprocal value and is weak. The service managers of the organizations are involved in evaluating the criteria and the sub-criteria. Saaty’s (1980) nine-point scale is used for pairwise comparison:
  • 10.
    BIJ . 1 – equally preferred; 18,2 . 2 – equally to moderately preferred; . 3 – moderately preferred; . 4 – moderately to strongly preferred; . 5 – equally preferred; 270 . 6 – strongly to very strongly preferred; . 7 – very strongly preferred; . 8 – very to extremely strongly preferred; and . 9 – extremely preferred. (5) Determine the maximum eigenvalue (lmax) and its corresponding eigenvector using the following equation: A £ W ¼ lmax £ W ð3Þ where: A ¼ observed matrix of pairwise comparison. lmax ¼ largest eigenvalue of A. W ¼ principal eigenvector (a measure of relative importance weight – age of the criteria or sub-criteria or the alternative). (6) Determine the consistency ratio (CR), the ratio between consistency index and the random index using the following equation: CI lmax 2 n CR ¼ ¼ ð4Þ RI n21 where: CI ¼ consistency index of A. RI ¼ random index of A. n ¼ order of matrix A. The random index value corresponding to n is determined from Table I. When the CR is less than 0.10, the matrix is accepted as consistent. Another comparison matrix B is constructed by comparing the alternatives with respect to each of the factors at the lowest level of the hierarchy. Using the survey results from the customers, matrix B is found as per Step 4. Steps 5 and 6 are carried out again in order to check the consistency of matrix B. The service factor measure (SFM) measure is calculated using matrices A and B. The SFM for competitor i with respect to j service quality factors is evaluated through the following equation: Table I. Order of matrix 1 2 3 4 5 6 7 8 9 10 Random index calculation Random index 0.00 0.00 0.58 0.90 1.12 1.24 1.32 1.41 1.45 1.49
  • 11.
    X SFMi ¼ ðlocal weight of competitor w:r:t: criterion j from matrix BÞ An integrated ð5Þ £ ðlocal weight of criterion j from matrix AÞ: model for PM Step 6. The system performance measure (SPM) is calculated in this step. For the calculation, the EBG approach is used. In the EBG approach, both the objective and quality factors found in the above steps are converted into consistent and dimensionless 271 indices to measure the SPM. The SPM of competitor i is found from equation (6): SPM i ¼ aðOFM i Þ þ ð1 2 aÞSFM i ð6Þ where, 0 , a , 1, a ¼ the objective factor weight and 1 –a ¼ the quality factor weight. Step 7. The SPM is analysed in this step and the decisions about the manufacturing design process is made. When the evaluated SPM value is found to be satisfactory, then the organization can strive for the perfection in the quality of the services offered. The measurement process needs to be continuously repeated and further improvement opportunities need to be analysed. When the evaluated SPM value falls below a satisfactory level, the design of the process itself is faulty and the redesigning of the entire process becomes essential. 4.2 Manufacturing performance improvement In the second phase, QFD is used to improve the service performance. The QFD procedure uses a series of HOQ matrices to express the linkages between the inputs and outputs of the different phases of development (Hauser and Clausing, 1988). In the redesigning process, the HOQ needs to be developed and the optimum set of service requirements needs to be determined. Building the first HOQ consists of five basic steps: (1) Identifying the customer requirements. (2) Identifying the service design requirements. (3) Relating the customer requirements to the service design requirements. (4) Conducting an evaluation of competing service providers. (5) Evaluating the service design requirements and development of targets. Thus, new strategies have to be deployed and the implementation plans have to be reviewed periodically. 5. Model validation by case study To demonstrate the applicability of the model in manufacturing organizations, we rely on a case study approach on two identical valve manufacturing companies, namely, Unit A and Unit B, located at the Tiruchirappalli Regional Engineering College Science and Technology Entrepreneurs Park in Tiruchirappalli, India. The details of the study are provided below. 5.1 Manufacturing performance measurement Step 1. The performance measures that influence the performance of the two companies are identified through discussions with the company managers. About 15 factors were
  • 12.
    BIJ shortlisted and identified. These factors are grouped according to their respective 18,2 categories as: (1) Process efficiency: . operating cost per employee; . cost of goods sold; 272 . product development time; . rejection ratio; . actual production against planned production; . age of plant and equipment; and . capacity utilization. (2) Product and process innovation: . RD expenditure; . number of new products in the last three years; and . percent of products protected by patents. (3) Product quality and customer satisfaction: . customer surveys and warranty claims; . customer complaints; . service responsiveness; and . percent of returned orders. Step 2. The performance measures were classified into objective and quality factors as follows. Objective factors: (1) Effective cost: . cost of goods sold; . actual production against planned production; . RD expenditure; and . capacity utilization. (2) Ineffective cost: . operating cost per employee; . rejection ratio; and . age of plant and equipment. Step 3. A structured survey was conducted at the two organizations, Unit A and Unit B using the sample questionnaire as shown in the methodology. Step 4. The OFM was now calculated in terms of CTE, from the structured survey conducted in Unit A and Unit B. The data from both manufacturing units are shown in Tables II and III.
  • 13.
    The above datawere collected and calculated from the above questionnaire: An integrated 58; 168 model for PM Cost Time Effectiveness ðCTEÞA ¼ 58; 168 þ 52; 800 21 825 90 þ þ {ð1=1; 071Þ þ ð1=825Þ} 90 þ 120 273 21 4:5 þ {ð1=4:5Þ þ ð1=8:4Þ} ¼ 0:52142 þ 0:000003 þ 0:42857 þ 0:07584 ¼ 1:02583 52; 800 Cost Time Effectiveness ðCTEÞB ¼ 58; 168 þ 52; 800 21 1; 071 120 þ þ {ð1=1; 071Þ þ ð1=825Þ} 90 þ 120 21 8:4 þ {ð1=4:5Þ þ ð1=8:4Þ} ¼ 0:47581 þ 0:000002 þ 0:57143 þ 0:04063 ¼ 1:0879 1:02583 Objective Factor Measure ðOFMÞA ¼ ¼ 0:48532 1:02583 þ 1:08789 1:08789 Objective Factor Measure ðOFMÞB ¼ ¼ 0:51468 1:02583 þ 1:08789 Step 5. Prioritization using AHP The criteria are prioritized in this step. The priorities are set by comparing each set of elements pairwise with respect to each of the elements on a higher level (Table IV). This yields lmax ¼ 1:3431 þ 1:0485 þ 0:6298 þ 0:4294 þ 0:3168 þ 2:4720 þ 2:8186 þ 0:2142 ¼ 9:2724 Parameter Cost of unit A Cost of unit B Table II. Average effective cost 58,168 52,800 Cost data from Average ineffective cost 825 1,071 manufacturing units Parameter Time of unit A (days) Time of unit B (days) Average effective time 90 120 Table III. Average ineffective time 4.5 8.4 Time data
  • 14.
    BIJ 18,2 274 criteria Table IV. AHP matrix and its eigenvalues for various Timely Employee Modern Return on Cost of goods sold/ Work done right the Process Warranty Eigen delivery morale equipment sales inventory first time efficiency claims vector Timely delivery 1 3 3 3 5 1/3 1/5 5 1.343 Employee morale 1/3 1 5 3 3 1/3 1/3 3 1.049 Modern equipment 1/3 1/5 1 3 3 1/5 1/7 5 0.629 Return on sales 1/3 1/3 1/3 1 3 1/7 1/7 3 0.429 Cost of goods sold/ inventory 1/5 1/3 1/3 1/3 1 1/7 1/5 3 0.317 Work done right the first time 3 3 5 7 7 1 1 7 2.472 Process efficiency 5 3 7 7 5 1 1 7 2.819 Warranty claims 1/5 1/3 1/5 1/3 1/3 1/7 1/7 1 0.214
  • 15.
    Order of theMatrix A ðnÞ ¼ 8: An integrated 9:2724 2 8 model for PM Consistency Index ðCIÞ ¼ ¼ 0:181 821 CI 0:181 Consistency Ratio ðCRÞ ¼ ¼ ¼ 0:12 RI 1:41 275 As per the AHP process, if the CR is less than or equal to 10 percent or 0.1, the matrix is deemed consistent. The QFM is found from the principal eigenvector of the comparison matrix A and individual factor comparison matrix B. The calculations are shown below: QFMA ¼ ð0:1395 £ 0:16Þ þ ð0:1094 £ 0:16Þ þ ð0:0724 £ 0:125Þ þ ð0:0505 £ 0:25Þ þ ð0:0386 £ 0:25Þ þ ð0:2687 £ 0:125Þ þ ð0:2945 £ 0:75Þ þ ð0:0252 £ 0:125Þ ¼ 0:329 QFMB ¼ ð0:1395 £ 0:84Þ þ ð0:1094 £ 0:84Þ þ ð0:0724 £ 0:875Þ þ ð0:0505 £ 0:75Þ þ ð0:0386 £ 0:75Þ þ ð0:2687 £ 0:875Þ þ ð0:2945 £ 0:25Þ þ ð0:0252 £ 0:875Þ ¼ 0:67 Step 6. For a manufacturing industry, the value of a is taken as 0.4 because more importance is given to the QFM than to the OFM. Using the SPM equation, the service SPM for both units is calculated as: SPMA ¼ ð0:4 * 0:48532Þ þ ð1 2 0:4Þ * 0:3290 ¼ 0:391 SPMB ¼ ð0:4 * 0:51468Þ þ ð1 2 0:4Þ * 0:67 ¼ 0:608 Using the EBG model, the performance of the manufacturing unit is measured. From SPM, the performance of Unit A is lowered than Unit B (Table V). Hence, to improve the performance of Unit A, the manufacturing parameter has to be redesigned. 5.2 Manufacturing performance improvement From the system performance measurement values, we conclude that Unit A which has a lower SPM value needs to be improved. QFD has been employed to facilitate this process. This is useful in establishing the priority of actions within the overall re-engineering strategy. A cascade of charts can be created dealing with the manufacturing process hierarchy. In this way, all manufacturing design processes at whatever level may be traced back to the customer and the effect of changes at any level in the performance checked against the overall company strategy. Thus, QFD has the voice of the customer in the manufacturing design improvements. Building of the first HOQ for Unit A consists of the following steps: (1) Identifying the customer requirements. The basic model of HOQ incorporates the customer requirements. This has already been ascertained in the EBG model. From the absolute weight column in the AHP matrix, it is very clear that the prioritized customer requirements are in the following order: process efficiency, work done right the first time, timely delivery, modern equipments, employee morale, return on sales, cost of goods sold per inventory and warranty claims.
  • 16.
    BIJ Quality parameters Unit A Unit B Eigenvector 18,2 Timely delivery Unit A 1 1/5 0.16 Unit B 5 1 0.83 Employee morale 276 Unit A 1 1/5 0.16 Unit B 5 1 0.83 Modern equipment Unit A 1 1/7 0.125 Unit B 7 1 0.875 Return on sales Unit A 1 1/3 0.25 Unit B 3 1 0.75 Cost of goods sold per inventory Unit A 1 1/3 0.25 Unit B 3 1 0.75 Work done right the first time Unit A 1 1/7 0.125 Unit B 7 1 0.875 Process efficiency Unit A 1 3 0.75 Unit B 1/3 1 0.25 Warranty claims Table V. Unit A 1 1/7 0.125 Comparison matrix Unit B 7 1 0.88 (2) Identifying the MDRs. The QFD team identifies the MDRs that are most needed to fulfil the customer requirements. The MDRs identified are as follows: quality characteristic, technical expertise development, strategic investment policy, correct and thorough workmanship development, job scheduling, clarification with the customer on the work to be done, an environment of attitudinal change, rewards and recognition rules. (3) Relating customer requirements to MDRs. The customer requirements are related to MDRs through the central matrix construction. The central matrix provides the degree of influence between each of the MDRs and the customer requirements. The degree of the relationship has been identified and tabulated in Table VI. (4) Conducting an evaluation of competing manufacturers. The customer competitive assessment in the HOQ provides a good way to determine whether the customer requirements have been met. It also indicates areas to be concentrated upon during the next design review. It contains an appraisal of where an organization stands relative to its major competitors in terms of each requirement. The assessment values are obtained from the EBG model. (5) To meet the customer requirements, the manufacturing organization has to prioritize the MDRs and fix the targets for each MDRs. After developing the HOQ for Unit A, we obtain the relative absolute weights of the various design requirements with respect to the customer requirements. Thus, the design requirements are prioritized according to their absolute weights in the HOQ matrix.
  • 17.
    An Clarification environment Rewards Technical Strategic Correct and with the of and Quality expertise investment thorough Job customer on the attitudinal recognition characteristics development policy workmanship scheduling work to be done change rules Timely delivery W † † † † † † 0.83 0.139 Modern equipment † † W 0.83 0.109 Employee morale W W † † † 0.875 0.724 Return on sales † † W † 0.75 0.0505 Cost of goods sold/ inventory W † † 0.75 0.0386 Work done right the first time W † † W D D 0.88 0.2687 Process efficiency † W D D † 0.25 0.2945 Warranty claims D D 0.875 0.0252 Absolute weights 5.67 4.77 2.07 4.75 4.3 1.52 2.17 2.63 Targets Process One training Policy Continuous Better Organizational Regular Incentives Target Absolute reliability and in two review training operations accessibility motivational and bonus value weight improvement months once in management programs schemes from ahp two matrix (w) months Notes: W – Moderately related (three points); † – strongly related (nine points); D – weakly related (one point) An integrated House of quality 277 model for PM Table VI.
  • 18.
    BIJ Further, in accordance with these prioritized MDRs, the targets to meet these MDRs have 18,2 been identified and employed by the QFD team. The prioritized orders of the MDRs and the targets to achieve are listed below. The priority orders of the MDRs are: quality characteristics, technical expertise development, correct and thorough workmanship, job scheduling, rewards and recognition rules, an environment for attitudinal change, strategic investment policy, 278 and clarification with the customer on the work to be done. The targets are as follows: . Quality characteristics – process reliability improvement. . Technical expertise development – training once in two months. . Correct and thorough workmanship – continuous training. . Job scheduling – better operations management. . Rewards and recognition rules – company policy of bonuses and incentives. . An environment of attitudinal change – motivational programs every month. . Strategy investment policy – policy review once in two months. . Clarification with the customer on the work to be done – organizational accessibility. 6. Conclusion This paper demonstrates the need for a manufacturing PM model. A literature survey has been carried out on the various frameworks and tools used. An integrated closed model to enhance PM has been proposed. It also provides a means to identifying the current performance of an organization and a methodology to improve it further. An important contribution of this model is that it combines both qualitative and quantitative dimensions of manufacturing performance measurement. The proposed model provides an opportunity to operationalise the relationship among the cost, time, and service quality dimensions. Both objective and manufacturing quality factors have been converted into consistent dimensionless indices to measure the system performance. The case study presented in this paper has demonstrated the applicability of the model to support a manufacturing unit. It has shown how performance measures are identified and how they can be calculated for two different units using time, cost, and service quality dimensions. The case study proves the usability of the EBG model for the PM process. From the SPM, the performance of the manufacturing organizations is analysed and manufacturing parameters is redesigned using QFD wherever necessary. Improving performance is a never-ending process and organizations should strive to achieve it for attaining the optimal level of cost and profit, as well as increase customer satisfaction and goodwill, and gain potential future business. Hence, the process of measuring and redesigning the manufacturing performance measures needs to be monitored and the implementation plans reviewed often. Finally, this model for PM can be extended to the service sector. References Amaratunga, D. and Baldry, D. (2002), “Moving from performance measurement to performance management”, Facilities, Vol. 20 Nos 5/6, pp. 217-23. Andijani, A. and Anwarul, M. (1997), “Manufacturing blocking discipline: a multi-criterion approach for buffer allocations”, International Journal of Production Economics, Vol. 51, pp. 155-63.
  • 19.
    Aravindan, P. andPunniyamoorthy, M. (2002), “Justification of advanced manufacturing An integrated technology (AMT)”, International Journal of Advanced Manufacturing Technology, Vol. 19 No. 2, pp. 151-6. model for PM Badri, M.A. (1999), “Combining the analytic hierarchy process and goal programming for global facility location-allocation problem”, International Journal of Production Economics, Vol. 62 No. 3, pp. 237-48. Badri, M.A. (2001), “A combined AHP-GP model for quality control systems”, International 279 Journal of Production Economics, Vol. 72 No. 1, pp. 27-40. ¨ Bergman, B. and Klevsjo, B. (1994), Quality from Customer Needs to Customer Satisfaction, McGraw-Hill, London. Berrach, L. and Cliville, V. (2007), “Towards an aggregation performance measurement system model in a supply chain context”, Computers in Industry, Vol. 58, pp. 709-19. Bhattacharya, A., Sarkar, B. and Mukherjee, S.K. (2005), “Integrating AHP with QFD for robot selection under requirement perspective”, International Journal of Production Research, Vol. 43 No. 17, pp. 3671-85. Brown, P.A. and Gibson, D.F. (1972), “A quantified model for facility site selection application to multi-plant location problem”, AIIE Transactions, Vol. 4 No. 1, pp. 1-10. Chuang, P.T. (2001), “Combining the analytic hierarchy process and quality function deployment for a location decision from a requirement perspective”, International Journal of Advanced Manufacturing Technology, Vol. 18 No. 11, pp. 842-9. Fitzgerald, L., Johnson, R., Brignall, S., Silvestro, R. and Voss, C. (1991), Performance Measurement in Service Business, CIMA, London. Folan, P. and Browne, J. (2005), “A review of performance measurement: towards performance management”, Computers in Industry, Vol. 56, pp. 663-80. Garvin, D.A. (1993), “Building a learning organization”, Harvard Business Review, Vol. 71 No. 4, pp. 78-91. Ghodsypour, S.H. and O’Brien, C. (1998), “A decision support system for supplier selection using an integrated analytic hierarchy process and linear programming”, International Journal of Production Economics, Vol. 56-57, pp. 199-212. Gomes, C.F., Yasin, M.M. and Lisboa, J.V. (2004), “A literature review of manufacturing performance measures and measurement in an organizational context: a framework and direction for future research”, Journal of Manufacturing Technology Management, Vol. 15 No. 16, pp. 511-30. Govers, C.P.M. (2000), “QFD is not only a tool but also a way of quality management”, International Journal of Production Economics, Vol. 7 No. 1, pp. 151-9. Gunasekaran, A., Patel, C. and Tirtirogulu, E. (2001), “Performance measures and metrics in supply chain environment”, International Journal of Operations Production Management, Vol. 21 Nos 1/2, pp. 71-87. Hanumaiah, N., Ravi, B. and Mukherjee, N.P. (2006), “Rapid hard tooling process selection using QFD-AHP methodology”, Journal of Manufacturing Technology Management, Vol. 17 No. 3, pp. 332-50. Harker, P.T. (1987), “Incomplete pairwise comparisons in the analytic hierarchy process”, Mathematical Modeling, Vol. 9 No. 11, pp. 837-48. Hauser, J.R. and Clausing, D. (1988), “The house of quality”, Harvard Business Review, Vol. 66, May/June, pp. 63-73. Kaydos, W. (1991), Measuring, Managing and Maximising Performance, Productivity Press, Cambridge, MA.
  • 20.
    BIJ Keegan, D., Eiler, R. and Jones, C. (1989), “Are your performance measures obsolete”, Management Accounting, Vol. 70 No. 12, pp. 45-50. 18,2 Koksal, G. and Egitman, A. (1998), “Planning and design of industrial engineering education quality”, Computers Industrial Engineering, Vol. 35 Nos 3/4, pp. 639-42. Kwong, C.K. and Bai, H. (2003), “Determining the importance weights for the customer requirements in QFD using a fuzzy AHP with an extent analysis approach”, 280 IIE Transactions, Vol. 35 No. 7, pp. 619-26. Lam, K. and Zhao, X. (1998), “An application of quality function deployment to improve the quality of teaching”, International Journal of Quality Reliability Management, Vol. 15 No. 4, pp. 389-413. Lee, C.W. and Kwak, N.K. (1999), “Information resource planning for a health care system using an AHP-based goal programming method”, Journal of the Operational Research Society, Vol. 50 No. 12, pp. 1191-8. Lockamy, A. III (1998), “Quality-focused performance measurement systems: a normative model”, International Journal of Operations Production Management, Vol. 18 No. 8, pp. 740-66. Lu, M., Madu, C.N., Kuei, C. and Winokur, D. (1994), “Integrating QFD, AHP and benchmarking in strategic marketing”, Journal of Business Industrial Marketing, Vol. 91, pp. 41-50. Lynch, R. and Cross, K. (1991), Measure Up: Yardsticks for Continuous Improvement, Blackwell, Cambridge, MA. Myint, S. (2003), “A framework of an intelligent quality function deployment (IQFD) for discrete assembly environment”, Computers Industrial Engineering, Vol. 45 No. 2, pp. 269-83. Neely, A., Gregory, M. and Platts, K. (1995), “Performance measurement system design a literature review and research agenda”, International Journal of Operations Production Management, Vol. 15 No. 4, pp. 80-116. Neely, A., Richards, H., Mills, J., Platts, K. and Bourne, M. (1997), “Designing performance measures: a structured approach”, International Journal of Operations Production Management, Vol. 17 No. 11, pp. 1131-52. ¨ ¨ Nilsson, C. (1990), Handbok in QFD, Mekanresultat 90002, Mekanforbundets forlag, Stockholm, Sverige (in Swedish). Partovi, F.Y. (1999), “A quality function deployment approach to strategic capital budgeting”, The Engineering Economist, Vol. 44 No. 3, pp. 239-60. Partovi, F.Y. (2006), “An analytic model for locating facilities strategically”, Omega, Vol. 34 No. 1, pp. 41-55. Partovi, F.Y. and Corredoira, R.A. (2002), “Quality function deployment for the good of soccer”, European Journal of Operational Research, Vol. 137 No. 3, pp. 642-56. Partovi, F.Y. and Epperly, J.M. (1999), “A quality function deployment approach to task organization in peacekeeping force design”, Socio-economic Planning Sciences, Vol. 33 No. 2, pp. 131-49. Punniyamoorthy, M. and Ragavan, V.P. (2003), “A strategic decision model for the justification of technology selection”, International Journal of Advanced Manufacturing Technology, Vol. 21, pp. 72-8. Razmi, J., Zairi, M. and Gunasekaran, A. (2006), “The application of analytic hierarchy process in classification of material planning and control systems”, International Journal of Services and Operations Management, Vol. 2 No. 4, pp. 352-66. Rouse, P. and Putterill, M. (2003), “An integral framework for performance measurement”, Management Decision, Vol. 41 No. 8, pp. 791-805.
  • 21.
    Saaty, T.L. (1980),The Analytic Hierarchy Process, McGraw-Hill, New York, NY. An integrated Saaty, T.L. (2003), “Decision-making with the AHP: why is the principal eigenvector necessary”, model for PM European Journal of Operational Research, Vol. 145 No. 1, pp. 85-91. Schniederjans, M.J. and Garvin, T. (1997), “Using the analytic hierarchy process and multi-objective programming for the selection of cost drivers in activity-based costing”, European Journal of Operational Research, Vol. 100 No. 1, pp. 72-80. Sink, D.S. and Tuttle, T.C. (1989), Planning and Measurement in Your Organisation of the 281 Future, Industrial Engineering and Management, Norcross, GA. Tan, B.L., Tang, K.H. and Forrester, P.L. (2004), “Application of QFD for e-business planning”, Production Planning Control, Vol. 15 No. 8, pp. 802-18. Tang, J., Fung, R.Y.K., Xu, B. and Wang, D. (2002), “A new approach to quality function deployment planning with financial consideration”, Computer and Operations Research, Vol. 29 No. 11, pp. 1447-63. Tangen, S. (2004), “Performance measurement: from philosophy to practice”, International Journal of Productivity and Performance Management, Vol. 53 No. 8, pp. 726-37. Vaidya, O.S. and Kumar, S. (2006), “Analytic hierarchy process: an overview of applications”, European Journal of Operational Research, Vol. 169 No. 1, pp. 1-29. Wang, H., Xie, M. and Goh, T.N. (1998), “A comparative study of the prioritization matrix method and the analytic hierarchy process technique in quality function deployment”, Total Quality Management, Vol. 9 No. 6, pp. 421-30. Wisner, J. and Fawcett, S. (1991), “Linking firm strategy to operating decisions through performance measurement”, Production Inventory Management Journal, Vol. 32 No. 3, pp. 5-11. Yang, T. and Kuo, C. (2003), “A hierarchical AHP/DEA methodology for the facilities layout design problem”, European Journal of Operational Research, Vol. 147 No. 1, pp. 128-36. Yeniyurt, S. (2003), “A literature review and integrative performance measurement framework for multinational companies”, Marketing Intelligence Planning, Vol. 21 No. 3, pp. 134-42. Zakarian, A. and Kusiak, A. (1999), “Forming teams: an analytic approach”, IIE Transactions, Vol. 31 No. 1, pp. 85-97. Further reading Madu, C.N. (2000), House of Quality in a Minute, CHI, Fairfield, CT. Tyagi, R. and Das, C. (1997), “A methodology for cost versus service tradeoffs in whole sale location-distribution using mathematical programming and analytic hierarchy process”, Journal of Business Logistics, Vol. 18 No. 2, pp. 77-99. Corresponding author Mark Goh can be contacted at: bizgohkh@nus.edu.sg To purchase reprints of this article please e-mail: reprints@emeraldinsight.com Or visit our web site for further details: www.emeraldinsight.com/reprints