1. The current issue and full text archive of this journal is available at
www.emeraldinsight.com/1463-5771.htm
Benchmarking
Benchmarking supplier risks supplier risks
using Bayesian networks
Archie Lockamy III
Brock School of Business, Samford University, Birmingham, Alabama, USA 409
Abstract
Purpose – The purpose of this paper is to provide a methodology for benchmarking supplier risks
through the creation of Bayesian networks. The networks are used to determine a supplier’s external,
operational, and network risk probability to assess its potential impact on the buyer organization.
Design/methodology/approach – The research methodology includes the use of a risk assessment
model, surveys, data collection from internal and external sources, and the creation of Bayesian
networks used to create risk profiles for the study participants.
Findings – It is found that Bayesian networks can be used as an effective benchmarking tool to
assist managers in making decisions regarding current and prospective suppliers based upon their
potential impact on the buyer organization, as illustrated through their associated risk profiles.
Research limitations/implications – A potential limitation to the use of the methodology
presented in the study is the ability to acquire the necessary data from current and potential suppliers
needed to construct the Bayesian networks.
Practical implications – The methodology presented in this paper can be used by buyer
organizations to benchmark supplier risks in supply chain networks, which may lead to adjustments to
existing risk management strategies, policies, and tactics.
Originality/value – This paper provides practitioners with an additional tool for benchmarking
supplier risks. Additionally, it provides the foundation for future research studies in the use of Bayesian
networks for the examination of supplier risks.
Keywords Benchmarking, Suppliers, Risk management, Bayesian statistical decision theory
Paper type Research paper
1. Introduction
In order to mitigate the effects of increasing levels of global competition, demanding
customers and employees, shrinking product lifecycles, and decreasing acceptable
response times on success in the market place, many organizations have become
members of formalized extended enterprises known as supply chains. These structures
can be described as organizational networks designed to help firms achieve a competitive
advantage through improved market responsiveness and cost reductions. Additionally,
supply chains can provide organizations with a means for promoting business
innovation through the adoption of streamlined information flows, restructured business
processes, and enhanced collaboration among network members (Sawhney et al., 2006).
As organizations increase their dependence on supply chain networks, they
become more susceptible to their suppliers’ risk profiles. Supplier risk profiles consist
of risk events that can have an adverse impact on buyer organizations. Risk events
are incidents whose occurrences result in the disruption of overall supply chain Benchmarking: An International
performance. Although it is often not possible to precisely predict the occurrence of such Journal
Vol. 18 No. 3, 2011
events, it is possible to evaluate the probability of their occurrence through the creation pp. 409-427
of supplier risk profiles. Therefore, it is essential that buyer organizations have the q Emerald Group Publishing Limited
1463-5771
ability to internally benchmark the level of risk associated with suppliers currently DOI 10.1108/14635771111137787
2. BIJ contained in their networks. In addition, these organizations must possess the means to
18,3 assess risk levels associated with potential members of their supply networks.
1.1 Purpose
The purpose of this article is to provide a methodology for benchmarking supplier
risks through the creation of Bayesian networks. These networks are used to determine
410 a supplier’s external, operational, and network risk probability for the creation of
supplier risk profiles. These risk profiles can be used to assess a supplier’s potential
impact on the buyer organization. Thus, the methodology is proposed as an analytical
tool to assist organizations in benchmarking risk levels associated with current and
prospective suppliers based upon their associated risk profiles.
1.2 Organization
The first section of the article provided its motivation and purpose. A review of the
literature pertaining to benchmarking and supply chain risks is provided in Section 2
to provide a theoretical basis for the proposed methodology. Section 3 contains an
overview of the research methodology used in this study which includes a discussion
on Bayesian networks and data collection procedures. Results and conclusions are
then offered in Sections 4 and 5, respectively. Finally, Section 6 provides a discussion
on implications regarding study limitations and directions for future research.
2. Literature review
Benchmarking can be described as a framework within which indicators and best
practices are examined in order to determine potential areas of improvement for an
organization (Tavana et al., 2009). In his taxonomy, Zairi (1994) identified the following
types of benchmarking: internal, competitive, functional, and generic. O’Dell and
Grayson (1998a, b) defined internal benchmarking as “the process of identifying,
sharing, and using the knowledge and practices inside one’s own organization.”
Christopher (1998) characterized supply chains as organizational networks linked
through upstream and downstream processes and activities that produce value in the
form of products and services delivered to the hands of the ultimate customer.
A prerequisite to effective supply chain management is the alignment of functional and
supply chain partner activities with firm strategies which are congruent with
organizational structures, processes, cultures, incentives, and people (Abell, 1999). Thus,
it is imperative that buyer organizations have the ability to internally benchmark the
capabilities and performance of its suppliers within the supply chain network to ensure
that supplier activities support the strategic and operational intent of the network.
2.1 Supplier benchmarking
Supplier benchmarking has been used in the selection of suppliers (Choy et al., 2003;
Lau et al., 2006; Che and Wang, 2008), supply base reduction processes (Ogden and
Carter, 2008), and in the assessment of supplier capabilities (Feeny et al., 2005) and
performance (Forker and Mendez, 2001; Narasimhan et al., 2001; Bardy, 2010). Supplier
benchmarking techniques employed by organizations include artificial intelligence tools
(Lau et al., 2006), neural networks (Choy et al., 2003), mathematical models (Che and
Wang, 2008), and other analytical techniques (Forker and Mendez, 2001; Farzippor Saen,
2008). Owing to the integrative and collaborative nature of supply chain networks,
3. Gunasekaran et al. (2001) notes that internal benchmarking among supply chain Benchmarking
members is necessary in order to monitor interactive performance drivers and to ensure
that the network is capability of achieving individual and shared performance targets.
supplier risks
Soni and Kodali (2010) argue that the internal benchmarking of supply chains is
necessary to reduce performance variability among supply chains of the same focal
firm. However, given the dynamic nature of supply chains due to their compositional
changes over time along with environmental changes, it is equally important to 411
internally benchmark collaborative as well as relative individual performance among
all chain members for effective supply chain management (Li and Dai, 2009). Such
activities facilitate improvements in information sharing, decision synchronization,
incentive alignment, and overall supply chain collaboration practices among its
membership (Simatupang and Sridharan, 2004).
Supplier benchmarking can be used as a tool to reveal improvement opportunities
within a supply chain for increased supply chain management effectiveness (Esain,
2000). The benefits of effective supply chain management include enhanced customer
satisfaction and value, along with improved supply chain reactivity (Gaudenzi and
Borghesi, 2006). Supply chain reactivity refers to the network’s ability to compress
lead times, adapt to unanticipated changes in demand, and to cope with environmental
uncertainty in the market place. However, the interdependencies created among
participating organizations via integrated supply chain networks make them more
vulnerable to supply chain disruptions, thus increasing risks.
2.2 Supplier selection and evaluation
Foster and Whiteman (2006) note that there has been a trend towards developing closer
working relationships with fewer suppliers within supply chain networks, resulting
in improved supplier performance. Additionally, Choi and Kim (2008) suggest that
buyer organizations must be not only concerned with a supplier’s performance within
its immediate supply chain network, but also its performance within its own supply
network. Therefore, it is increasingly important for buyer organizations to develop the
capacity to systematically select suppliers as members of its network that are capable
of meeting or exceeding individual and shared performance objectives. In addition,
these organizations must possess the means to routinely evaluate the performance of
the members of their supply networks.
There are a variety of supplier selection and evaluation methodologies offered in the
research literature, which include the use of the analytic hierarchy process (Routroy,
2008), data envelop analysis (Wu et al., 2007a; Wang et al., 2009), fuzzy systems
(Jain et al., 2007; Sen et al., 2010; Sevkli, 2010), multiple regression analysis (Lasch,
2005; Inemek, 2009), and process capability analysis (Chen and Chen, 2006; Wu et al.,
2007b). Recently, sustainability and environmental requirements have become a part of
the supplier selection and evaluation protocol for a growing number of organizations
(Jabbour and Jabbour, 2009). Finally, as organizations continue to increase their level of
risk via interdependencies created by integrated supply chain networks, researchers
have begun to develop risk-based analytical approaches to supplier selection and
evaluation (Guido, 2008; Lee, 2009; Ravindran et al., 2010).
2.3 Supply chain risks
Spekman and Davis (2004) define risk as the probability of variance in an expected
outcome. Therefore, it is possible to quantify risk since it is possible to assign
4. BIJ probability estimates to these outcomes (Khan and Burnes, 2007). On the contrary,
18,3 uncertainty is not quantifiable and the probabilities of the possible outcomes are not
known (Knight, 1921). A joint evaluation of risk and uncertainty conducted by Yates
and Stone (1992) suggests that risk implies the existence of uncertainty associated with
a given outcome, for if the probability of an outcome is known, there is no risk. Thus,
uncertainty can be regarded as a key determinant of risk that may not be entirely
412 eradicated, but can be mitigated through the deployment of risk reduction action
steps (Slack and Lewis, 2001). In business situations, managers are expected to reduce
the organization’s exposure to uncertainty through the deployment of effective risk
management strategies.
Internal and external uncertainties both provide sources for supply chain risks
(Cucchiella and Gastaldi, 2006). Changes in capacity availability, interruptions in
information flows, and reductions in operational efficiencies are all possible sources of
internal uncertainty. External sources of uncertainty leading to increased supply chain
risks include the actions of competitors, price fluctuations, changes in the political
environment, and variations in supplier quality. These sources of uncertainty can be
considered “risk events” that can lead to supply chain disruptions which inhibit
performance. Thus, it is necessary for managers to first understand the various
categories of risks along with the events and conditions that drive them before they
attempt to devise approaches to reduce supply chain risks (Chopra and Sodhi, 2004).
The research literature offers a variety of approaches for categorizing risks in supply
chain networks. For example, Treleven and Schweikhart (1988) have classified
supply chain risk events based upon their association with the following: supply
chain disruptions; price fluctuations; inventory and scheduling changes, technology
advancements, and quality issues. Kleindorfer and Wassenhove (2003) designated
supply chain co-ordination and supply disruptions as categories of supply chain risks,
while Zsidisin et al. (2005) defined supply risk as the probability of an incident associated
with inbound supply from individual supplier failures or the supply market occurring,
in which its outcomes result in the inability of the purchasing firm to meet customer
demand or cause threats to customer life and safety. Paulsson (2004) classified supply
chain risks as operational disturbances, tactical disruptions, and strategic uncertainties.
Giunipero and Eltantawy (2004) categorized these risks based upon conditions which
result in their creation, such as political events, product availability, transportation
distances, changes in technology and labor markets, financial instability, and
management turnover. Supply chain disruptions, delays, systems, forecasts, intellectual
property, procurement, receivables, inventory, and capacity are classifications for
supply chain risks offered by Chopra and Sodhi (2004).
Several researchers have chosen to categorize supply chain risks in the following
manner: demand-side risks resulting from disruptions emerging from downstream supply
chain operations (Suttner, 2005); supply-side risks residing in purchasing, supplier
activities, and supplier relationships (Wu et al., 2006); and catastrophic risks that, when
they materialize, have a severe impact in terms of magnitude in the area of their occurrence
(Wagner and Bode, 2006). Nagurney et al. (2005) defined demand-side risk as the
uncertainty surrounding the random demands that often occur at the retailer stage of the
supply chain. Wu et al. (2006) states that inbound supply risk is defined as the potential
occurrence of an incident associated with inbound supply from individual supplier failures
or the supply market resulting in the inability of the purchasing firm to meet
5. customer demand, and as involving the potential occurrence of events associated with Benchmarking
inbound supply that can have significant detrimental effects on the purchasing firm. supplier risks
Handfield and McCormack (2007) defined operational, network, and external factors
as categories of supply chain risks. Operational risk is defined as the risk of loss
resulting from inadequate or failed internal processes, people or systems. Quality,
delivery, and service problems are examples of operational risks. Network risk is defined
as risk resulting from the structure of the supplier network, such as ownership, 413
individual supplier strategies, and supply network agreements. External risk is defined
as an event driven by external forces such as weather, earthquakes, political, regulatory,
and market forces. In addition, the authors offer three perspectives for the examination
of risks within supply chain networks. A supplier facing perspective examines the
network of suppliers, their markets and their relationship relative to the organization.
A customer facing perspective examines the network of customers and intermediaries,
their markets and their relationships also relative to the organization. Finally, an
internal facing perspective examines the company, their network of assets, processes,
products, systems, and people as well as the company’s markets. This research study
employs the risk categories offered by Handfield and McCormack along with the
supplier facing perspective in the analysis of supply chain risk.
3. Research methodology
The research methodology for this study includes the use of a risk assessment model,
surveys, data collection from internal and external company sources, and the creation
of Bayesian networks used to create risk profiles for the study participants. Following
is an overview of Bayesian networks, along with a discussion of the assessment model
and study sample collection procedures.
3.1 Bayesian networks
A Bayesian network is an annotated directed acyclic graph that encodes probabilistic
relationships among nodes of interest in an uncertain reasoning problem (Pai et al.,
2003). The representation describes these probabilistic relationships and includes a
qualitative structure that facilitates communication between a user and a system
incorporating a probabilistic model. Bayesian networks are based on the work of the
mathematician and theologian Rev. Thomas Bayes who worked with conditional
probability theory in the late 1700s to discover a basic law of probability which came to
be known as Bayes’ theorem. Bayes’ theorem states that:
PðHjcÞ £ PðEjH; cÞ
PðHjE; cÞ ¼
PðEjcÞ
The posterior probability is given by the left-hand term of the equation [P(HjE, c)].
It represents the probability of hypothesis H after considering the effect of evidence E on
past experience c. The term P(Hjc) is the a priori probability of H given c alone. Thus, the
a priori probability can be viewed as the subjective belief of occurrence of hypothesis
H based upon past experience. The likelihood, represented by the term P(EjH,c), gives the
probability of the evidence assuming the hypothesis H and the background information
c is true. The term P(Ejc) is independent of H and is regarded as a normalizing or scaling
factor (Niedermayer, 2003). Thus, Bayesian networks provide a methodology for
combining subjective beliefs with available evidence.
6. BIJ Bayesian networks represent a special class of graphical models that may be used to
18,3 depict causal dependencies between random variables (Cowell et al., 2007). Graphical
models use a combination of probability theory and graph theory in the statistical
modeling of complex interactions between such variables. Bayesian networks have
evolved as a useful tool in analyzing uncertainty. When Bayesian networks were first
introduced, assigning the full probability distributions manually was time intensive.
414 Solving a Bayesian network with a considerable number of nodes is known to be a
nondeterministic polynomial time hard [NP hard] problem (Dagum and Luby, 1993).
However, significant advancements in computational capability along with the
development of heuristic search techniques to find events with the highest probability
have enhanced the development and understanding of Bayesian networks.
Correspondingly, the Bayesian computational concept has become an emergent tool
for a wide range of risk management applications (Cowell et al., 2007). The
methodology has been shown to be especially useful when information about past
and/or current situations is vague, incomplete, conflicting, and uncertain.
3.2 Assessment model
The study participants are comprised of ten casting suppliers to a major US
automotive company. An assessment model developed by Handfield and McCormack
(2007) was used to evaluate the risk of each supplier. This model incorporates data
from several sources to provide a 360 degree view of a supplier’s risk profile. The risk
assessment model is shown in Figure 1.
The risk assessment model identifies and quantifies the risk of a supply disruption
using a framework that describes the attributes of suppliers, their relationships, and
their interactions with the organization performing the assessment. The model consists
of: relationship factors (influence, levels of cooperation, power, alignment of interests);
past performance (quality, on-time delivery, shortages); human resource factors
(unionization, relationship with employees, level of pay compared to the norm); supply
chain disruptions history; environment (geographic, political, shipping distance and
method, market dynamics); disaster history (hurricane, earthquake, tornado, flood);
and financial factors (ownership, funding, payables, receivables).
The assessment model uses a set of measures and scales that apply to each risk
construct. The model was tested with several companies over a four year period, and
validated through actual use in assessing supply risk events. The measures and scales
are used to evaluate suppliers, and to provide a numerical score that reflects their
individual risk of a disruptive event. A supplier risk profile is then created, expressed
as a numerical score given as a result of applying the model and measures. The higher
the risk profile score, the higher the supplier’s disruption potential to the supply chain.
Appendix 1 contains the actual measures used in this study. In order to apply the risk
results to potential events, the survey results were reorganized into operational,
network and external risk-related measures, and the results were recalculated for each
supplier. The reorganized measures are presented in Appendix 2.
3.3 Study participants
The study participants consist of ten automotive casting suppliers to a major
automotive company in the US The sample data was collected by first interviewing the
supplier’s account representative to discuss the study and the internet-based survey.
7. Interactions and Benchmarking
relationships
supplier risks
Performance
S
Relationship
415
The customer’s reputation with
S suppliers is also a critical factor
S
S SC
network
organizer
S
Supplier
environment
Environmental S
Supplier attributes
Geographic, market,
transportation, etc. Human
resources
S Supply chain
disruption
Figure 1.
Financial
Risk assessment model
Health
Subsequently, the survey instrument web link was sent in an email to the supplier’s
account representative. The account representative completed the survey, supplier
historical performance data was evaluated, and an internal analyst conducted an
environmental analysis of the organization. All risk ratings were assessed using a
five-point Likert scale, and a risk index was calculated for each supplier. In addition,
each supplier provided a priori probabilities for 12 risk events identified in Appendix 2.
The a priori probabilities were determined by a team of company personnel familiar
with the identified risk events as they relate to the ten suppliers. By logically
examining the information, the team was able to estimate a priori probability values
pertaining to 12 risk events for each supplier. These probabilities provided the basis
for the construction of Bayesian networks used in the creation of supplier risk profiles.
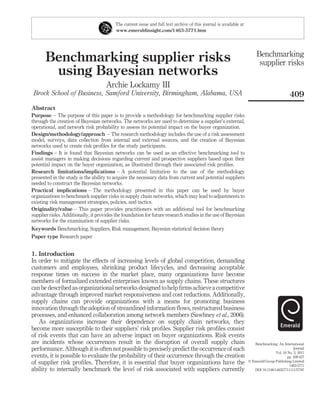
4. Results
Bayesian networks were developed to examine the probability of a failure for ten
suppliers in the company’s casting supply chain. Network, operational, and external risk
levels were computed using the provided a priori probabilities for the identified risk
events. A depiction of the Bayesian networks used in this study is shown in Figure 2.
8. BIJ
18,3 1 2 3 4 5 6 7 8 9 10 11 12
416
Network Operational External
risks risks risks
Supplier
failure
Figure 2. Notes: Network key: 1 = misalignment of interest; 2 =supplier financial stress; 3 = supplier leadership
Bayesian network change; 4 = tier 2 stoppage; 5 = supplier network misalignment; 6 = quality problems; 7 = delivery
structure for suppliers problems; 8 = service problems; 9 = supplier HRproblems; 10 = supplier locked; 11 = merger/divestiture;
12 = disasters
Nodes (circles) represent variables in the Bayesian network. Each node contains states,
or a set of probable values for each variable. The values “yes” and “no” represent the two
states in which the variables can exist in the network illustrated in Figure 2. Nodes are
connected to show causality with arrows known as “edges” which indicate the direction
of influence. When two nodes are joined by an edge, the causal node is referred to as the
parent of the influenced (child) node. Child nodes are conditionally dependent upon their
parent nodes. Thus, in Figure 2, the probability of suppliers experiencing network risks
is dependent on the a priori probabilities associated with the following variables:
misalignment of interest; supplier financial stress; supplier leadership change; tier
2 stoppage; and supplier network misalignment. The a priori probabilities associated
with the variables quality problems, delivery problems, service problems, and supplier
human resources (HR) problems directly influence operational risks. External risks are
dependent upon the following variables: supplier locked (i.e. company cannot easily
switch to another supplier), merger/divestitures, and disasters. The joint probabilities of
the computed network, operational, and external risks are then used to determine the
probability that a supplier will fail to achieve individual and shared performance
expectations.
9. The a priori probabilities for 12 supply chain risk events that affect network, Benchmarking
operational, and external risks are presented in Table I for each supplier. These values supplier risks
were used to generate a risk profile using Bayesian networks comprised of network,
operational and external risk probabilities along with the supplier’s probability of
failure to meet performance expectations. The supplier risk profiles are displayed
in Table II. The table reveals that Suppliers A, H, and J have the highest probability of
failure to meet performance expectations, while Supplier I has the lowest probability of 417
failure. Computations illustrating the development of the risk profile for Supplier A are
presented in Appendix 3.
Supplier rankings based upon their risk profiles are presented in Table III. An
examination of Table III reveals that Suppliers A and H have the highest network risk
rankings, while Supplier I has the lowest ranking in this category. In the category of
operational risk, Supplier A and J exhibit the highest rankings. Suppliers B, D, and E
exhibit the lowest rankings in the area of operational risk. The highest ranking in the
external risk category is held by Supplier H, while Supplier I holds the lowest external
risk ranking. Finally, based upon the risk profiles illustrated in Table II, Suppliers A, H,
and J have the highest probability of failure ranking among the study participants,
while Supplier I has the lowest ranking in this category.
5. Conclusions
The results of the study indicate that not only does Supplier I have the lowest network
and external risk rankings relative to other study participants, but also the lowest
ranking in the probability of failure category. Given this result, after considering both
the operational and external risks associated with Supplier I, the company may find it
prudent to apportion more of its business to this supplier in an effort to decrease risk in
the supply chain network. Supplier B exhibited the second lowest probability of failure
ranking and may also be a candidate for increased business as a means to reduce risk.
Finally, although Supplier D has a relatively high ranking in the external risk category,
it exhibited the third lowest ranking in the probability of failure category. Therefore, the
company may find it worthwhile to engage in cooperative activities with Supplier D to
help reduce the impact of external risk events. For example, the company may
participate with Supplier D in the development of a comprehensive plan for responding
to unforeseen disasters as a means of mitigating their effects on the supply chain
network.
The results also reveal that Suppliers A, H, and J have unfavorable probability of
failure risk profiles relative to the other participants in the study. Supplier A has the
highest rankings in both the network and operational risk categories, while Supplier H
also holds a number one ranking in the categories of network and external risks.
Supplier J has the highest ranking in the category of operational risk. A further
examination of Table III reveals that these suppliers are ranked either first or second in
each of the four risk categories. This result suggests that the company should consider
several approaches for reducing its exposure to the risks associated with the
aforementioned suppliers. One approach would be for the company to allocate more of
its business to a supplier with a less risky profile, such as Supplier I. After considering
the suppliers’ network, operational and external risk factors, the company may consider
the joint development of an aggressive supply chain risk management program
which helps these suppliers achieve significant reductions in each risk category.
11. Benchmarking
Network risk Operational risk External risk
Supplier probability probability probability Probability of failure supplier risks
A 0.34 0.47 0.43 0.41
B 0.19 0.23 0.38 0.27
C 0.33 0.46 0.43 0.40
D 0.21 0.23 0.39 0.28 419
E 0.23 0.23 0.41 0.29
F 0.24 0.30 0.43 0.32
G 0.22 0.27 0.41 0.30
H 0.34 0.46 0.45 0.41
I 0.18 0.27 0.34 0.26 Table II.
J 0.33 0.47 0.43 0.41 Supplier risk profiles
Supplier Network risk ranking Operational risk ranking External risk ranking Failure ranking
A 1 1 2 1
B 7 5 5 7
C 2 2 2 2
D 6 5 4 6
E 4 5 3 5
F 3 3 2 3
G 5 4 3 4
H 1 2 1 1 Table III.
I 8 4 6 8 Supplier rankings based
J 2 1 2 1 on risk profiles
Possible incentives that the company could offer the suppliers are incremental increases
in business based upon documented improvements in its supplier ranking based on its
risk profile. Finally, the company may choose to terminate its relationship with these
suppliers, and allocate its business among its remaining supplier base.
6. Implications
The methodology presented in this study can used to internally benchmark supplier
risks on a routine basis in supply chain networks. As part of a supply chain
governance agreement, suppliers could be required to periodically update of their risk
probability profiles for the risk events outlined in Appendix 2. These updates could be
applied to Bayesian networks to create new risk profiles and rankings for each
supplier. Adjustments to existing risk management strategies, policies, and tactics
could then be made to reflect the current risk realities associated with the supply chain
network. Thus, the methodology can provide a proactive means of managing supply
chain risks.
The methodology can also be used by organizations to develop supplier risk profiles
to determine failure exposure levels. Organizations can then decide if it is in their best
interest to either assist a supplier in improving its risk profile, or to terminate the
relationship. Supplier risk profiles can be used to determine those risk events which
have the highest probability of occurrence, and the largest potential impact on the
supply chain network. Thus, this methodology can assist organizations along
12. BIJ with their suppliers in developing comprehensive supplier risk management programs
18,3 designed to minimize the occurrence of network, operational, and external risk events.
Finally, this methodology can be used as a tool to assist managers in evaluating
current and potential suppliers. Suppliers who have been shown to improve their risk
profiles over time may be rewarded by a buyer organization via the allotment of more
business. Conversely, suppliers who have experienced increases in network, operational,
420 or external risk events over an extended period of time may be viewed as “at risk”
suppliers whose relationship may require reassessment by the organization. The
reassessment could result in removal from the supply network. Potential suppliers
willing to provide information for the generation of their risk profiles may then become
viable candidates for network inclusion.
6.1 Implementation
In order to successfully implement the methodology offered in this study, it will be
necessary for organizations to engage in coordinated and collaborative information
sharing activities. Fawcett et al. (2009) has developed a conceptual model for the
development of enhanced supply chain information sharing over time. The primary
components of the model are connectivity, information sharing capability, and
willingness. Connectivity refers to an organization’s ability to collect, analyze, and
disseminate the required information necessary to support sound decision making
within the supply chain network. It is a necessary condition for the enhancement of
information sharing capabilities among the members of the network. However,
organizations must also be willing to share sensitive decision making information to
achieve high levels of coordination and collaboration among network members. Thus,
both technological and behavioral dimensions must be considered in implementing
this methodology. Not only must organizations have the technological capability to
capture, store, update, and disseminate information on the network, operational, and
external risk measures outlined in Appendix 2, but also display the willingness to
share this information with members of the supply chain network.
6.2 Limitations
This study provides an examination of network, operational, and external risk profiles
associated with casting suppliers in the automotive industry. Therefore, the results are
specific to the study participants. A potential limitation to the use of the methodology
presented in this study is the ability to acquire the necessary data from suppliers
needed for the construction of the Bayesian networks. There may be circumstances
where some participants within a supply chain network are reluctant to share risk
profile data with their customers. Moreover, suppliers must be willing to periodically
update this data in order to construct risk profiles that are valid and reliable.
A limitation to the use of Bayesian networks to model supply chain risks is the proper
identification of risk event and risk categories that can impact a supply chain. Since
there are a number of approaches available for categorizing supply chain risks, the
inability to incorporate all relevant risks into the model could limit its effectiveness in
representing a supplier’s true risk profile. Therefore, the data used in the construction
of Bayesian networks must represent the supplier’s current risk realities within the
supply chain network.
13. 6.3 Future research Benchmarking
Research studies which explore the risk profiles for suppliers and supply chain supplier risks
networks in other industries should be examined using Bayesian networks to determine
if industry dynamics significantly influence supply chain risks. These studies could
explore the magnitude of network, operational, and external risk associated with
suppliers in specific industries. Results from such studies may be used to benchmark
supplier risk levels within a particular industry. 421
Future researchers may also investigate if it may be possible to develop benchmarks
representing the maximum risk levels for the variables contained in Appendix 2 in order
for a supplier or supplier group to maintain its affiliation with the supply chain. The
maximum risk levels may be based on the nature of the industry, or the commodity
provided by the supplier. Buyer organizations may choose to assist key suppliers who
exceed threshold levels in reducing risks, or discontinue their membership in the supply
chain network.
Finally, future researchers may choose to incorporate financial data in ranking the
impact of a supplier’s network, operational, or external risks on supply chain networks.
The focus of such studies could be on the probability that a supplier will have an adverse
impact on the buyer organization’s revenue stream based upon its risk profile. Research
results from these studies could be used to benchmark the financial impact of supplier
failures on buyer organizations as well as the entire supply chain network.
References
Abell, D. (1999), “Competing today while preparing for tomorrow”, MIT Sloan Management
Review, Vol. 40 No. 3, pp. 73-81.
Bardy, R. (2010), “Comparative supply chain performance: measuring cross-cultural effects.
The example of the Bratislava regional automotive manufacturing”, Knowledge & Process
Management, Vol. 17 No. 2, pp. 95-110.
Che, Z.H. and Wang, H.S. (2008), “Supplier selection and supply quantity allocation of common
and non-common parts with multiple criteria under multiple products”, Computers &
Industrial Engineering, Vol. 55 No. 1, pp. 110-33.
Chen, K.S. and Chen, K.L. (2006), “Supplier selection by testing the process incapability index”,
International Journal of Production Research, Vol. 44 No. 3, pp. 589-600.
Chopra, S. and Sodhi, M.S. (2004), “Managing risk to avoid supply-chain breakdown”,
Sloan Management Review, Vol. 46 No. 1, pp. 53-61.
Christopher, M. (1998), Logistics & Supply Chain Management: Strategies for Reducing Cost and
Improving Services, 2nd ed., Financial Time Prentice-Hall, New York, NY.
Cowell, R.G., Verrall, R.J. and Yoon, Y.K. (2007), “Modeling operational risk with Bayesian
networks”, Journal of Risk and Insurance, Vol. 74 No. 4, pp. 795-827.
Choi, T. and Kim, Y. (2008), “Structural embeddedness and supplier management: a network
perspective”, Journal of Supply Chain Management: A Global Review of Purchasing &
Supply, Vol. 44 No. 4, pp. 5-13.
Choy, K.L., Lee, W.B. and Lo, V. (2003), “An intelligent supplier relationship management system
for selecting and benchmarking suppliers”, International Journal of Technology
Management, Vol. 26 No. 7, pp. 717-42.
Cucchiella, F. and Gastaldi, M. (2006), “Risk management in supply chain: a real option
approach”, Journal of Manufacturing Technology Management, Vol. 17 No. 6, pp. 700-20.
14. BIJ Dagum, P. and Luby, M. (1993), “Approximating probabilistic inference in Bayesian belief
networks is NP-Hard”, Artificial Intelligence, Vol. 60 No. 1, pp. 141-53.
18,3
Esain, A. (2000), “Networks, benchmarking and development of the strategic supply base: a case
study”, International Journal of Logistics: Research and Applications, Vol. 3 No. 2, pp. 157-71.
Farzippor Saen, R. (2008), “Using super-efficiency analysis for ranking suppliers in the presence
of volume discount offers”, International Journal of Physical Distribution & Logistics
422 Management, Vol. 38 No. 8, pp. 637-51.
Fawcett, S.E., Wallin, C., Allred, C. and Magnan, G. (2009), “Supply chain information sharing:
benchmarking a proven path”, Benchmarking: An International Journal, Vol. 16 No. 2, pp. 222-46.
Feeny, D., Lacity, M. and Willcocks, L.P. (2005), “Taking the measure of outsourcing providers”,
MIT Sloan Management Review, Vol. 46 No. 3, pp. 41-8.
Forker, L.B. and Mendez, B.D. (2001), “An analytical method for benchmarking best peer
suppliers”, International Journal of Operations & Production Management, Vol. 21 Nos 1/2,
pp. 195-209.
Foster, F.D. and Whiteman, C.H. (2006), “Bayesian prediction, entropy, and option pricing”,
Australian Journal of Management, Vol. 31 No. 2, pp. 181-206.
Gaudenzi, B. and Borghesi, A. (2006), “Managing risks in the supply chain using the AHP
method”, The International Journal of Logistics Management, Vol. 17 No. 1, pp. 114-36.
Giunipero, L.C. and Eltantawy, R.A. (2004), “Securing the upstream supply chain:
a risk management approach”, International Journal of Physical Distribution & Logistics
Management, Vol. 34 No. 9, pp. 698-713.
Guido, M. (2008), “A decision-maker-centred supplier selection approach for critical supplies”,
Management Decision, Vol. 46 No. 6, pp. 918-32.
Gunasekaran, A., Patel, C. and Tirtiroglu, E. (2001), “Performance measurement and metrics in a
supply chain environment”, International Journal of Operations & Production
Management, Vol. 21 No. 1, pp. 71-87.
Handfield, R. and McCormack, K. (2007), Supply Chain Risk Management: Minimizing
Disruptions in Global Sourcing, Auberbach Publications, Boca Raton, FL.
Inemek, A. (2009), “Global supplier selection strategies and implications for supplier
performance: Turkish suppliers’ perception”, International Journal of Logistics: Research
& Applications, Vol. 12 No. 5, pp. 381-406.
Jabbour, A.B.L. and Jabbour, C.J. (2009), “Are supplier selection criteria going green? Case studies
of companies in Brazil”, Industrial Management & Data Systems, Vol. 109 No. 4, pp. 477-95.
Jain, V., Wadhwa, S. and Deshmukh, S.G. (2007), “Supplier selection using fuzzy association rules
mining approach”, International Journal of Production Research, Vol. 45 No. 6, pp. 1323-53.
Khan, O. and Burnes, B. (2007), “Risk and supply chain management: creating a research
agenda”, International Journal of Logistics Management, Vol. 18 No. 2, pp. 197-216.
Kleindorfer, P.R. and Wassenhove, L.K. (2003), “Managing risk in global supply chains”,
Wharton Insurance and Risk Management Department Seminar, Wharton University,
Philadelphia, PA.
Knight, F.H. (1921), Risk, Uncertainty and Profit, Houghton Mifflin, Boston, MA.
Lasch, R. (2005), “Supplier selection and controlling using multivariate analysis”, International
Journal of Physical Distribution & Logistics Management, Vol. 35 No. 6, pp. 409-25.
Lau, H.C.W., Lee, C.K.M., Ho, G.T.S., Pun, K.F. and Choy, K.L. (2006), “A performance
benchmarking system to support supplier selection”, International Journal of Business
Performance Management, Vol. 8 No. 2, pp. 132-51.
15. Lee, A.H. (2009), “A fuzzy AHP evaluation model for buyer-supplier relationships with the Benchmarking
consideration of benefits, opportunities, costs and risks”, International Journal of
Production Research, Vol. 47 No. 15, pp. 4255-80.
supplier risks
Li, D. and Dai, W. (2009), “Determining the optimal collaborative benchmarks in a supply chain”,
International Journal of Production Research, Vol. 47 No. 16, pp. 4457-71.
Nagurney, A., Cruz, J., Dong, J. and Zhang, D. (2005), “Supply chain networks, electronic
commerce, and supply side and demand side risk”, European Journal of Operational 423
Research, Vol. 164 No. 1, pp. 120-42.
Narasimhan, R., Talluri, S. and Mendez, D. (2001), “Supplier evaluation and rationalization
via data envelopment analysis: an empirical examination”, Journal of Supply Chain
Management: A Global Review of Purchasing & Supply, Vol. 37 No. 3, pp. 28-37.
Niedermayer, D. (2003), “An introduction to Bayesian networks and their contemporary
applications”, available at: www.niedermayer.ca/papers/bayesian/bayes.html (accessed
25 March 2010).
O’Dell, C. and Grayson, C.J. (1998a), “If only we knew what we know: identification and transfer
of internal best practices”, California Management Review, Vol. 40 No. 3, pp. 154-74.
O’Dell, C. and Grayson, C.J. (1998b), If Only We Knew What We Know: The Transfer of Internal
Knowledge and Best Practice, The Free Press, New York, NY.
Ogden, J.A. and Carter, P.L. (2008), “The supply base reduction process: an empirical
investigation”, International Journal of Logistics Management, Vol. 19 No. 1, pp. 5-28.
Pai, R., Kallepalli, V., Caudill, R. and Zhou, M. (2003), “Methods toward supply chain risk analysis”,
IEEE International Conference on Systems, Man and Cybernetics, Vol. 5 No. 1, pp. 4560-5.
Paulsson, U. (2004), “Supply chain risk management”, in Brindley, C. (Ed.), Supply Chain Risk
Management, Ashgate, Aldershot.
Ravindran, A., Ufuk Bilsel, R. and Wadhwa, V. (2010), “Risk adjusted multicriteria supplier
selection models with applications”, International Journal of Production Research, Vol. 48
No. 2, pp. 405-24.
Routroy, S. (2008), “Decision framework for supplier evaluation and selection in supply chain”,
The ICFAI University Journal of Supply Chain Management, Vol. 5 No. 3, pp. 19-32.
Sawhney, M., Wolcott, R.C. and Arroniz, I. (2006), “The 12 different ways for companies to
innovate”, Sloan Management Review, Vol. 47 No. 3, pp. 75-81.
Sen, C.G., Sen, S. and Baslıgil, H. (2010), “Pre-selection of suppliers through an integrated fuzzy
analytic hierarchy process and max-min methodology”, International Journal of
Production Research, Vol. 48 No. 6, pp. 1603-25.
Sevkli, M. (2010), “An application of the fuzzy ELECTRE method for supplier selection”,
International Journal of Production Research, Vol. 48 No. 12, pp. 3393-405.
Simatupang, T.M. and Sridharan, R. (2004), “Benchmarking supply chain collaboration:
an empirical study”, Benchmarking: An International Journal, Vol. 11 No. 5, pp. 484-503.
Slack, N. and Lewis, M. (2001), Operations Strategy, 3rd ed., Prentice-Hall, Harlow.
Soni, G. and Kodali, R. (2010), “Internal benchmarking for assessment of supply chain
performance”, Benchmarking: An International Journal, Vol. 17 No. 1, pp. 44-76.
Spekman, R.E. and Davis, E.W. (2004), “Risky business: expanding the discussion on risk and the
extended enterprise”, International Journal of Physical Distribution & Logistics
Management, Vol. 34 No. 5, pp. 414-33.
16. BIJ Suttner, U. (2005), “Supply chain risk management: understanding the business requirements
from a practitioner perspective”, The International Journal of Logistics Management,
18,3 Vol. 16 No. 1, pp. 120-41.
Tavana, M., Bourgeois, B.S. and Sodenkamp, M.A. (2009), “Fuzzy multiple criteria base
realignment and closure (BRAC) benchmarking system at the Department of Defense”,
Benchmarking: An International Journal, Vol. 16 No. 2, pp. 192-221.
424 Treleven, S. and Schweikhart, B. (1988), “A risk/benefit analysis of sourcing strategies: single vs.
multiple sourcing”, Journal of Operations Management, Vol. 7 No. 4, pp. 93-114.
Wagner, S.M. and Bode, C. (2006), “An empirical investigation into supply chain vulnerability”,
Journal of Purchasing & Supply Management, Vol. 12 No. 6, pp. 301-12.
Wang, Y.M., Chin, K.S. and Leung, J.P. (2009), “A note on the application of the data envelopment
analytic hierarchy process for supplier selection”, International Journal of Production
Research, Vol. 47 No. 11, pp. 3121-38.
Wu, T., Blackhurst, J. and Appalla, R. (2007a), “AIDEA: a methodology for supplier evaluation
and selection in a supplier-based manufacturing environment”, International Journal of
Manufacturing Technology & Management, Vol. 11 No. 2, pp. 174-92.
Wu, T., Blackhurst, J. and Chidambaram, V. (2006), “A model for inbound supply risk analysis”,
Computers in Industry, Vol. 57 No. 4, pp. 350-65.
Wu, C.W., Shu, M.H., Pearn, W.L. and Liu, K.H. (2007b), “Bootstrap approach for supplier
selection based on production yield”, International Journal of Production Research, Vol. 1
No. 20, pp. 1-20.
Yates, J.F. and Stone, E. (1992), “The risk construct”, in Yates, J.F. (Ed.), Risk-Taking Behaviour,
Wiley, Chichester.
Zairi, M. (1994), Measuring Performance for Business Results, Springer, New York, NY, pp. 62-3.
Zsidisin, G., Melnyk, S. and Ragatz, G. (2005), “An institutional theory perspective of business
continuity planning for purchasing and supply management”, International Journal of
Production Research, Vol. 43 No. 16, pp. 3401-20.
Appendix 1
Behaviors
Relationship Supplier revenue from industry segment
Influence of revenue from company
Supplier/Company alignment
Supplier/Company information sharing
Performance Accreditation
Engineering support
Capacity utilization
Capacity change
Delivery flexibility
Manufacturing employees
Service promptness
MRR
Audit date
Table AI. Audit score
Risk assessment On-time delivery
measures (continued)
17. Human resources Employee turnover Benchmarking
Senior staff turnover
Union issues
supplier risks
Pay position
Structure
Supply chain disruption Market power
Tier II information sharing
Tier II performance monitoring 425
Disruption probability
Risk management system
Material sourcing base
Financial health Market growth
Financial risk indicators
Environmental Market dynamics
Merger and acquisition
Regulatory
Disaster
Transportation
Network Supplier’s customers
Supplier customer relationships
Alignment
Supplier’s supplier
Supplier vendor relationships
Vendor concentration
Code of conduct Table AI.
Appendix 2
Risk category Risk event Risk measures
Network risks Misalignment of interest Influence of revenue from company
Supplier revenue from commodity category
Supplier/Company Alignment
Regulatory
Supplier financial stress Customer portfolio
Business health indicators
Segment portfolio
Market growth
Financial data sharing
Supplier leadership change Company ownership change likelihood
Merger and acquisition
Senior staff turnover
Tier 2 stoppage Process change likelihood
Miscommunication between tiers
Material change/obsolesce likelihood
Risk management system
Material sourcing base
Market power
Regulatory
Regulatory change risk likelihood Table AII.
Inventory status sharing Network, operational, and
(continued) external risk measures
18. BIJ Risk category Risk event Risk measures
18,3
Tier II supplier information sharing
Process/Material change notification
Supplier network misalignment Supplier customer alignment
Vendor concentration
426 Operational risks Quality problem Process change likelihood
MRR (defects)
Audit date
Audit score
Tier II performance monitoring
Quality problems likelihood
Manufacturing employees
Accreditation
Material change/obsolesce likelihood
Process/Material change notification
Delivery problem Performance data sharing
On-time delivery
Capacity utilization
Tier II information sharing
Delivery flexibility
Capacity shortage likelihood
Manufacturing employees
Capacity change
Inventory status sharing
Order fulfillment information sharing
Production schedule sharing
Service problem Engineering support
Service promptness
Employee turnover
Human resource issues likelihood
New technology opportunity sharing
Supplier HR problem Union issues
Employee turnover
Pay position
External risks Supplier locked Accreditation information sharing
EPA and FDA report sharing
Regulatory
Accreditation
Merger/divestiture Market dynamics
Merger and acquisition
Disasters Supplier is providing proof of insurance
Disaster
Table AII. Transportation
Appendix 3. Probability of failure Supplier A
Given the risk event relationships exhibited in the Supplier Bayesian Network illustrated in
Figure 2 along with the a priori probabilities for risk event variables contained in Table I, the
following probability computations regarding network risks, operational risks, external risks,
and failure for Supplier A are provided below:
P
ðProbability of Network Risk EventÞ £ ðProbability of Event OccurrenceÞ
PðNetwork RisksÞ ¼ P
ðProbability of Event OccurrenceÞ
19. ½ð0:20Þ £ ð1ÞŠ þ ½ð0:50Þ £ ð1ÞŠ þ ½ð0:50Þ £ ð1ÞŠ þ ½ð0:31Þ £ ð1ÞŠ þ ½ð0:20Þ £ ð1ÞŠ Benchmarking
PðNetwork RisksÞ ¼
1þ1þ1þ1þ1
supplier risks
1:71
PðNetwork RisksÞ ¼ ¼ 0:34
5
P
ðProbability of Operational Risk EventÞ £ ðProbability of Event OccurrenceÞ
PðOperational RisksÞ ¼ P
ðProbability of Event OccurrenceÞ 427
½ð0:46Þ £ ð1ÞŠ þ ½ð1:00Þ £ ð1ÞŠ þ ½ð0:20Þ £ ð1ÞŠ þ ½ð0:20Þ £ ð1ÞŠ
PðOperational RisksÞ ¼
1þ1þ1þ1
1:86
PðOperational RisksÞ ¼ ¼ 0:47
4
P
ðProbability of External Risk EventÞ £ ðProbability of Event OccurrenceÞ
PðExternal RisksÞ ¼ P
ðProbability of Event OccurrenceÞ
½ð0:18 £ ð1ÞŠ þ ½ð1:00Þ £ ð1ÞŠ þ ½ð0:11Þ £ ð1ÞŠ
PðExternal RisksÞ ¼
1þ1þ1
1:29
PðExternal RisksÞ ¼ ¼ 0:43
3
P
½PðNRÞ £ PðOccurrenceÞŠ þ ½PðORÞ £ PðOccurrenceÞŠ þ ½PðERÞ £ PðOccurrenceÞŠ
PðFailureÞ ¼ P
ðProbability of Risk OccurrenceÞ
½ð0:34 £ ð1ÞŠ þ ½ð0:47Þ £ ð1ÞŠ þ ½ð0:43Þ £ ð1ÞŠ
PðFailureÞ ¼
1þ1þ1
1:24
PðFailureÞ ¼ ¼ 0:41
3
About the author
Archie Lockamy III, PhD, Certified Fellow in Production and Inventory Management (CFPIM) is
the Margaret Gage Bush Professor of Business and Professor of Operations Management at
Samford University. Prior to his academic career, Dr Lockamy held various engineering and
managerial positions with Du Pont, Procter and Gamble, and TRW. Dr Lockamy has published
research articles in numerous academic journals, and co-authored the book Reengineering
Performance Measurement: How to Align Systems to Improve Processes, Products and Profits.
Dr Lockamy served on the 1997, 1998, 1999, 2000, 2001, and 2002 Board of Examiners for the
Malcolm Baldrige National Quality Award via appointment by the United States Department of
Commerce. He also served as Vice President of the Board of Directors of the American
Production and Inventory Control Society (APICS) Educational and Research Foundation.
Dr Lockamy is recognized as a CFPIM by APICS, and is certified as an Academic Jonah by the
Avraham Y. Goldratt Institute. Archie Lockamy III can be contacted at: aalockam@samford.edu
To purchase reprints of this article please e-mail: reprints@emeraldinsight.com
Or visit our web site for further details: www.emeraldinsight.com/reprints