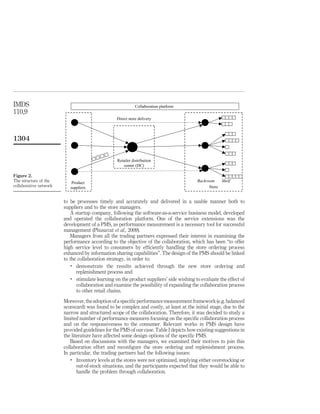
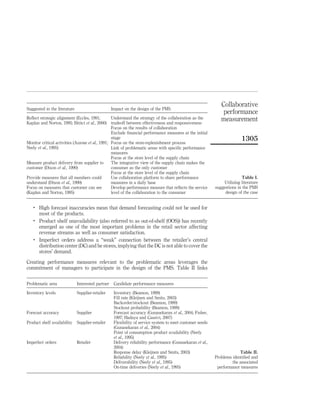
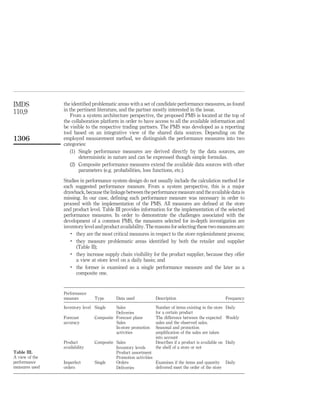
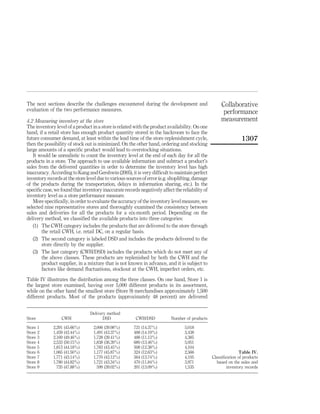
This article discusses the challenges of developing a common performance measurement system for a collaborative supply chain. Through a case study of a supply chain in the fast moving consumer goods industry, the authors examine two potential collaborative performance measures - inventory levels and product availability. They find that inventory levels cannot reliably be measured collaboratively due to data limitations. Measuring product availability would require a complex information sharing system across the supply chain. The key challenges revealed include underlying data inconsistencies, the need to synchronize business processes, and determining an appropriate collaborative evaluation method.
A new fuzzy dematel todim hybrid method for evaluation criteria of knowledge ...ijmvsc
Knowledge management (KM) adoption in the supply chain network needs a good investment as well as
few changes in the culture of the entire SC. Knowledge management is the process of creating,
distributing and transferring information. The goal of this study is to Rank KM criteria in supply chain
network in Iran which is important for firms these days. Criterion used in this paper were extracted from
the literature review and were confirmed by supply chain experts. The proposed approach for ranking and
finding out about these criterion is hybrid fuzzy DEMATEL-TODIM, with using fuzzy number as data for
our studies we could avoid uncertainty. The data was gathered from PhD. And Ms. Students in industrial
engineering of Kharrazmi university of Tehran and PhD. And Ms. Students of the management department
of Semnan university. A new hybrid approach was used for achieving the results of this study. This new
hybrid approach ranks data criteria respect to each other, then by using TODIM for ranking respect to
the best situation (gains), the rates of criterion were determined which is a very important advantage.
Data-Driven Simulation-Enhanced optimization of Service operationsSudhendu Rai
This paper describes a systematic six-step data-driven simulation-based methodology for optimizing people-based service systems on a large distributed scale that exhibit high variety and variability. The methodology is exemplified
through its application within the printing services industry where it has been successfully deployed by Xerox Corporation across small, mid-sized and large print shops generating over $250 million in profits across the customer value chain. Each
step of the methodology consisting of innovative concepts co-development and testing in partnership with customers, development of software and hardware tools to implement the innovative concepts, establishment of work-process and practices for customer-engagement and service implementation, creation of training and infrastructure for large scale deployment, integration of the innovative offering within the framework of existing corporate offerings and lastly the monitoring and deployment of the financial and operational metrics for estimating the return-on investment and the continual renewal of the offering are described in detail.
Determinantsof Strategic Supply Chain Management in Enhancing Organization Pe...paperpublications3
Abstract: The purpose of the study was to investigate the determinantsof strategic supply chain management in enhancing organization performance, a case of Eldoret Water and Sanitation Company. The target population consisted of all the managers and employees at ELDOWAS. The study adopted a descriptive survey research design, in which both stratified and simple random sampling techniques were utilized in selecting the participants for the study. This study used a sample of 60 employees and management representatives. Questionnaire, interview schedule and document analysis were be used to collect data. Data was analyzed using descriptive statistical technique that included frequencies, percentages and means. Findings of the study found out that 53.3% of organisation performance was influenced by the four determinants studied in the research. Results on coefficient of variation showed that a unit change in supply chain infrastructure would affect organisation performance by (0.14β1), resource sharing (0.062β2), information flow (0.457β3) and organisation linkage (0.215β4). All the four determinants looked in this research were found to have positive influence; supply chain infrastructure (r=0.505), resource sharing (r=0.567), information flow (r=0.705) and organisation linkage (r=0.322) on organisation performance. The study recommends that ICT should be fully integrated and utilised in sharing information between the organisation and partner in the supply chain management, information systems and flow need to be enhanced to ensure that the suppliers and customers receive it on time.
Keywords: Determinants, Information flow, Infrastructure,Supply Chain Management & Resource sharing.
Achieving and Ensuring Business Process Acceptance for Systems and Software E...Dr. Mustafa Değerli
Değerli, M. and Özkan, S. (2014). Achieving and Ensuring Business Process Acceptance for Systems and Software Engineering and Management. In Business Performance Measurement and Management. Cambridge Scholars Publishing, UK. ISBN- 13: 978-1443861397 - ISBN-10: 1443861391 - https://www.google.com/books/edition/_/5yxQBwAAQBAJ
This study pursued to investigate the effects of supply chain management practices on organizational
performance in the food complex industries in Asella town. A cross-sectional survey research design was
employed in this study. The population of interest comprised of all suppliers, employees, customers, retailers
were involved and multistage sampling was employed and 158 sample
A NALYSIS O F S UPPLIER’S P ERFORMANCE T HROUGH F PIR /F NIR A ND M EM...csandit
In today’s highly competitive business environment,
evaluation of suppliers is the prime function
of the purchasing department of the organization. I
t is due to the fact that high percentage of the
material cost for manufacturing of a product is inv
olved. Identification of decision criteria and
methods for supplier evaluation are appearing to be
the important research area in the
literature. In this paper, hybrid methodology of Fu
zzy positive Ideal rating /Fuzzy Negative
Ideal rating and Membership Degree Transformation-
M (1, 2, 3) is proposed for evaluation of
supplier’s performance. A wide literature review is
made and six selection criteria namely:
Cost, Quality, Service, Business performance, Techn
ical Capability and Delivery performance
are considered for evaluation. A detailed applicati
on of the proposed methodology is illustrated.
The proposed methodology is useful not only to judg
e the overall performance of the supplier
but also to know which criteria/sub-criteria need t
o be improved
Most original equipment manufacturers (OEMs) are strategically involved in supplier base rationalization and increased consciousness of sustainable development. This reinforces need for accurately considering sustainability in supplier selection to improve organizational
performance. In real industrial case, problems are unavoidable and pose huge challenge to
accurately incorporate sustainability factors into supplier selection. Such problems include
imprecise data, ambiguity of human judgment, uncertainty among sustainability factors and the
need to capture all subjective and objective criteria
Crosscheck: Intergation Methods, Supply Chain Management and the Boeing 787 D...Herbert Ferguson-Augustus
As a part of Communication course at the University of Minnesota, Herbert B. Ferguson-Augustus researched the supply chain management practices at the Boeing Company during the 787 Dreamliner Program. Research focuses on how Boeing integrated its Tier I suppliers into the design and production processes. Research findings are discussed here.
Implications Of Human Resource Variables On Supply Chain Performance And Comp...CSCJournals
This paper proposes a conceptual model indicating the effect of Human Resource (HR) variables on supply chain (SC) performance and to suggest best approach suited for Indian manufacturing organizations, in general, and automotive industries, in particular. This study is a part of a larger research project exploring SC related practices. The methodology of critical evaluation involved literature review of empirical research articles on performance measurement, SCM and HR practices. A critical analysis is carried out so as to identify research gaps in content of effect of HR on performance measurement of supply chains, as well as to propose directions for future research. A conceptual model is also proposed. Critical investigation of selected articles led to an idea that there can be significant effect of the role of human involvement on overall SC Performance. It is to be seen that how various parameters, taken from the literature review, affect SC performance and ultimately contributing to its competitiveness. The study is limited to supply chains of the automotive industries and their ancillaries located in Malwa region of M.P., India. Further research can be carried out by using data of various supply chains located in other parts of India to generalize the research. Also, other sectors and industries can be included.
Determinants of Strategic Supply Chain Management in Enhancing Organization P...paperpublications3
Abstract: The purpose of the study was to investigate the determinantsof strategic supply chain management in enhancing organization performance, a case of Eldoret Water and Sanitation Company. The target population consisted of all the managers and employees at ELDOWAS. The study adopted a descriptive survey research design, in which both stratified and simple random sampling techniques were utilized in selecting the participants for the study. This study used a sample of 60 employees and management representatives. Questionnaire, interview schedule and document analysis were be used to collect data. Data was analyzed using descriptive statistical technique that included frequencies, percentages and means. Findings of the study found out that 53.3% of organisation performance was influenced by the four determinants studied in the research. Results on coefficient of variation showed that a unit change in supply chain infrastructure would affect organisation performance by (0.14β1), resource sharing (0.062β2), information flow (0.457β3) and organisation linkage (0.215β4). All the four determinants looked in this research were found to have positive influence; supply chain infrastructure (r=0.505), resource sharing (r=0.567), information flow (r=0.705) and organisation linkage (r=0.322) on organisation performance. The study recommends that ICT should be fully integrated and utilised in sharing information between the organisation and partner in the supply chain management, information systems and flow need to be enhanced to ensure that the suppliers and customers receive it on time.
Determinants of Supply Chain Performance of Indian Manufacturing OrganizationsWaqas Tariq
This paper aims at proposing various determinants of supply chain performance of Indian manufacturing organizations. The determinants are summarized based on extensive literature review of empirical research articles on supply chain management (SCM) and performance measurement approaches. This study is a part of a larger research project exploring SC related practices. A critical analysis is carried out so as to identify research gaps in context of performance measurement of supply chains, as well as to propose directions for future research. A conceptual model is also proposed. Critical investigation of selected articles led to an idea that there can be significant effect of selected variables on SC Performance. It is to be seen that how various parameters, taken from the literature review, affect SC performance and ultimately contributing to its competitiveness. The various parameters like supplier-buyer relations, external supply chain, environmental factors, human metrics, information sharing and performance measurement approaches are taken in a single study in the context of Indian manufacturing organizations. Based on a pilot study with sample size of 100, empirical tests resulted in reduction of items. Based on the obtained results, the organizations can enhance the SCM performance by improving the current practices/strategies through focusing on the determinants that significantly influence SCM performance. Further research can be carried out by using data of various supply chains of other sectors and industries of India to generalize the research.
Running head SUPPLY CHAIN MANAGEMENT SUPPLY CHAIN MANAGEMENT .docxtodd521
Running head: SUPPLY CHAIN MANAGEMENT
SUPPLY CHAIN MANAGEMENT 6
Supply Chain Management
Students Name:
Institution Affiliation:
Supply Chain Management: Improving Process Efficiency and Effectiveness
Introduction
Companies are now supporting their supply chain strategies with the focus on being in driving transformation and realizing true competitive advantage. A company’s supply chain is supposed to be robust enough to enable it withstand the changing local, environmental, and social demands while remaining agile enough to enable it react to market shifts. In today’s environment, business managers are demanding more from their changing supply chains with their focus on competitive advantage. Such changes in expectations force supply chain leaders to focus more on the whole value chain. The trends involved in improving process efficiency and effectiveness in supply chain management include:
Improving strategic decision-making processes
The many decision-making agents together along with supply chain means that understanding and evaluating the dynamic behavior is very important. Application of a generic approach to modeling the supply chain dynamics is essential in the distribution processes (Gattorna, 2010). Both the physical processes which include primary and secondary manufacturing warehousing and distribution and the business processes should be modeled. The focus is how decisions are made at different nodes of the supply chain, who makes them, what methods or tools are used, among other factors (Coyle, Langley, Gibson, Novack & Bardi, 2013). The main aim of such an approach should be to replicate and integrate the behavior of supply chain in software. The logic or system of software tools used in decision-making at different nodes and systems are replicated in the simulation tool. Such an approach creates a non-invasive improvement in the operations of supply chain. These improvements are enhanced through changes in different parameters such as safety shocks or various business processes such as relationships between agents.
The current nature of process technology should incorporate agile equipment’s to shorten the process cycle times by a degree of magnitude and require little time for changeover (Chopra & Meindl, 2007). Such a move would avoid long processes and operations and lead to more responsive supply chain. The underlying operations will be triggered to change with the focus shifting to designing processes that will operate at intrinsic rates and not being limited by tools or equipment performance of traditional equipment’s. Processes and operations should be designed with greater emphasis on mechanistic understanding and be controlled tightly if significant reductions in the quality control activities are to be realized (Bowersox, Closs & Cooper, 2013). Development of integrated models of life-cycle retrieved from discovery consumption greatly facilitates strategic decisi.
Database Project Charter/Business Case
Khalia Hart
University of Maryland Global Campus
February 21, 2020
Introduction
A database is an electronic collection of data that is built by a user so that they can access, update particular information in the database coherently or rapidly. Today firms employ integrated technology to increase their capacity to serve more clients, keep information well or effectively, organize activities according to the urgency or priorities, accounting records (Tüttelmann F, 2015). Most of the integrated technology depends on multiple databases that supply information relevant in making the decision. Since the business started using databases, their performance increase because the business decisions they make are sound and practical.
Business Problem
The supply chain management is one of the most complicated processes in the business and often at times due to need of detail it gets hard for the supply chain manager to keep the record of the work covered effectively, have enough data to make the decision and also have enough data to monitor the chain of operation (William, 2019). The supply chain has been so crucial for the business because it determines the performance of the company in the industry by assessing the quality of the product produced in the organization, cost of production, the time and effectiveness of distribution network, and overall production operation of the organization.
Operation management has been named as the leading cause of business failure caused by a lack of a system, which the manager or the supervisor can use to monitor the whole system. This is the problem to solve using the database (William, 2019). Using a database, the manager can observe or watch the entire chain from their office, make better decisions by fore- planning approach of the database also make changes within the system when there is the need to cut costs or making the process effective.
Project Scope
Most business organizations are spread in operation, and this is the challenge that makes the supply chain management complex (Tüttelmann F, 2015). This is because the chain is in different localities, and therefore, coordination of operation among the user or the workers becomes a challenge. Through the database system, the business will enjoy proper coordination using the wide Area Network (LAN). Through the LAN network, the company can link computers and cost-effectively share data and communication. Through this system, the company will have a connection and coordination of the processes within the organization. The number of connected devices will range from 10 to 1000, depending on the type of tools and system that is set to facilitate this connection.
Goals and objectives of the system
The purpose of the system that I want to install in the supply chain management is to;
· Monitoring of the supply chain- the system will enable the manager to monitor the system and every process in the order (Gattor.
Simulation in the supply chain context a survey Sergio Terzia,.docxbudabrooks46239
Simulation in the supply chain context: a survey
Sergio Terzia,*, Sergio Cavalierib a Politecnico di Milano, Department of Economics, Industrial and Management Engineering, Piazza Leonardo da Vinci 32, 20133 Milan, Italy b Department of Industrial Engineering, Universita` di Bergamo, Viale Marconi 5, 24044 Dalmine, Italy Received 29 January 2003; accepted 13 June 2003
Abstract
The increased level of competitiveness in all industrial sectors, exacerbated in the last years by the globalisation of the economies and by the sharp fall of the final demands, are pushing enterprises to strive for a further optimisation of their organisational processes, and in particular to pursue new forms of collaboration and partnership with their direct logistics counterparts. As a result, at a company level there is a progressive shift towards an external perspective with the design and implementation of new management strategies, which are generally named with the term of supply chain management (SCM). However, despite the flourish of several IT solutions in this context, there are still evident hurdles to overcome, mainly due to the major complexity of the problems to be tackled in a logistics network and to the conflicts resulting from local objectives versus network strategies. Among the techniques supporting a multi-decisional context, as a supply chain (SC) is, simulation can undoubtedly play an important role, above all for its main property to provide what-if analysis and to evaluate quantitatively benefits and issues deriving from operating in a co-operative environment rather than playing a pure transaction role with the upstream/downstream tiers. The paper provides a comprehensive review made on more than 80 articles, with the main purpose of ascertaining which general objectives simulation is generally called to solve, which paradigms and simulation tools are more suitable, and deriving useful prescriptions both for practitioners and researchers on its applicability in decision-making processes within the supply chain context. # 2003 Elsevier B.V. All rights reserved. Keywords: Parallel and distributed simulation; Supply chain management; High level architecture; Survey 1. Introduction Modern industrial enterprises operate in a rapidly changing world, stressed by even more global competition, managing world-wide procurement and unforeseeable markets, supervising geographically distributed production plants, striving for the provision of outstanding products and high quality customer service. More than in the past, companies which are not able to revise periodically their strategies and, accordingly, to modify their organisational processes seriously risk to be pulled out from the competitive edge. In the 1990s, companies have made huge efforts for streamlining their internal business processes, identifying and enhancing the core activities pertaining to the product value chain, and invested massively in new intra-company information and communicat.
Relationships among Supplier Selection Criteria using Interpretive Structural...inventionjournals
International Journal of Engineering and Science Invention (IJESI) is an international journal intended for professionals and researchers in all fields of computer science and electronics. IJESI publishes research articles and reviews within the whole field Engineering Science and Technology, new teaching methods, assessment, validation and the impact of new technologies and it will continue to provide information on the latest trends and developments in this ever-expanding subject. The publications of papers are selected through double peer reviewed to ensure originality, relevance, and readability. The articles published in our journal can be accessed online.
The Influence of Supply Chain Integration on the Intrapreneurship in Supply C...IJERA Editor
These days, SMEs pay a lot of attention to concept of Supply Chain Management (SCM) in order to achieve
competitiveness. The logic behind such act is integrating the activities of value creation within any kind of
organizational context. Such integrity would collaborate with managers to accomplish the competitive edge that
they are aiming to achieve. The goal of current research is to identify scopes of a unique construct which is
known as Entrepreneurial Supply Chain Management competency. Therefore, the notions of SCM and
entrepreneurship are being aligned together for evaluating the organizational performance. The outcomes
demonstrate that SCM in fact is a critical issue that can alter the organizational performance, thus, through
consideration of SCM, we should focus on supply chain integration and its impacts on intrapreneurship and
innovation of an organization. In order to be successful in such competitive context, SMEs need to provide
novel competences which are not imitable and to increase their application in supply chain and also to improve
their total performance.
The Importance of Supply Network Development and Firm’s Capabilities in Build...YogeshIJTSRD
This paper discusses the advantages and importance of supply chain network development and firm’s capability to enhance competitive advantage. Supplier network supply network plays an importance role for the company so that they will be able to play a more active role and optimal in the management and operation of the network of suppliers that include product design, production, suppliers, marketing and distribution. In large companies, a strong distribution network is needed, as well as in small and medium scale companies. Companies are required distribution network that is robust in the entire territory of Indonesia. To succeed in this objective, Companies need a distribution strategy, which is an area of marketing strategy aimed primarily at increasing sales and the number of customers to support sustainable growth. Robertus Sigit Haribowo Lukito | Lena Ellitan "The Importance of Supply Network Development and Firm’s Capabilities in Building Business Performance: A Theoretical Review" Published in International Journal of Trend in Scientific Research and Development (ijtsrd), ISSN: 2456-6470, Volume-5 | Issue-3 , April 2021, URL: https://www.ijtsrd.com/papers/ijtsrd39903.pdf Paper URL: https://www.ijtsrd.com/management/strategic-management/39903/the-importance-of-supply-network-development-and-firm’s-capabilities-in-building-business-performance-a-theoretical-review/robertus-sigit-haribowo-lukito
Operation Management Strategies 1
LITERATURE REVIEW 7
Literature Reviewin Operation Management Strategies
Qualitative cases in operation management
The study inspects the condition of subjective research endeavors in operation administration. Five fundamental operation administration diaries are incorporated for their effect on the field. The subjective detailed analyzes picked were distributed somewhere around 1993 and 2008. With an expanding pattern to utilizing more subjective research endeavors, there have been significant and huge commitments to the operation administration department, particularly in the territory of hypothesis building.
In a significant number of the subjective detailed analyzes they explored, sufficient points of interest in research outline, information accumulation, and information investigation were absent. For example, there are studies that don't offer examining rationale or a portrayal of the investigation through which research draws results. Further, researches conventions for doing inductive detailed analyze are much better created contrasted with the research conventions for doing deductive careful investigations. Thusly, there is an absence of reliability in how the case technique has been connected. As subjective researchers, they offer recommendations on how we can enhance what have been done and raise the level of thoroughness and consistency (Mei, 2011).
Buyer perceptions of supply disruption risk
Scott argues that as supply chains get to be more minds boggling, firms face expanding dangers of supply interruptions. The process through which purchasers settle on decisions notwithstanding these dangers, nonetheless, has not been investigated. In spite of research highlighting the criticalness of behavioral methodologies to risk, there is restricted research that applies these perspectives of danger in the supply chain writing. This paper addresses this crevice by drawing on behavioral danger hypothesis to examine the causal connections among circumstance, representations of danger, and choice making inside the buying area.
They investigate the relationship between greatness of supply disturbance, likelihood of supply interruption, and general supply disturbance risk. Furthermore, they attract on trade hypotheses to distinguish item and business sector figures that effect purchasers' impression of the likelihood and extent of supply interruption. At last, they take a gander at how representations of danger influence the choice to look for options wellsprings of supply. The model was tested utilizing information gathered from 223 obtaining administrators and purchasers of immediate materials. The results demonstrate that both the likelihood and the size of supply disturbance are paramount to purchasers' general view of supply interruption risk (Ellis, 2010).
Examining supply chain relationships
Gilbert finds out that firm.
A tale of scale & speed: How the US Navy is enabling software delivery from l...sonjaschweigert1
Rapid and secure feature delivery is a goal across every application team and every branch of the DoD. The Navy’s DevSecOps platform, Party Barge, has achieved:
- Reduction in onboarding time from 5 weeks to 1 day
- Improved developer experience and productivity through actionable findings and reduction of false positives
- Maintenance of superior security standards and inherent policy enforcement with Authorization to Operate (ATO)
Development teams can ship efficiently and ensure applications are cyber ready for Navy Authorizing Officials (AOs). In this webinar, Sigma Defense and Anchore will give attendees a look behind the scenes and demo secure pipeline automation and security artifacts that speed up application ATO and time to production.
We will cover:
- How to remove silos in DevSecOps
- How to build efficient development pipeline roles and component templates
- How to deliver security artifacts that matter for ATO’s (SBOMs, vulnerability reports, and policy evidence)
- How to streamline operations with automated policy checks on container images
Le nuove frontiere dell'AI nell'RPA con UiPath Autopilot™UiPathCommunity
In questo evento online gratuito, organizzato dalla Community Italiana di UiPath, potrai esplorare le nuove funzionalità di Autopilot, il tool che integra l'Intelligenza Artificiale nei processi di sviluppo e utilizzo delle Automazioni.
📕 Vedremo insieme alcuni esempi dell'utilizzo di Autopilot in diversi tool della Suite UiPath:
Autopilot per Studio Web
Autopilot per Studio
Autopilot per Apps
Clipboard AI
GenAI applicata alla Document Understanding
👨🏫👨💻 Speakers:
Stefano Negro, UiPath MVPx3, RPA Tech Lead @ BSP Consultant
Flavio Martinelli, UiPath MVP 2023, Technical Account Manager @UiPath
Andrei Tasca, RPA Solutions Team Lead @NTT Data
Key Trends Shaping the Future of Infrastructure.pdfCheryl Hung
Keynote at DIGIT West Expo, Glasgow on 29 May 2024.
Cheryl Hung, ochery.com
Sr Director, Infrastructure Ecosystem, Arm.
The key trends across hardware, cloud and open-source; exploring how these areas are likely to mature and develop over the short and long-term, and then considering how organisations can position themselves to adapt and thrive.
Transcript: Selling digital books in 2024: Insights from industry leaders - T...BookNet Canada
The publishing industry has been selling digital audiobooks and ebooks for over a decade and has found its groove. What’s changed? What has stayed the same? Where do we go from here? Join a group of leading sales peers from across the industry for a conversation about the lessons learned since the popularization of digital books, best practices, digital book supply chain management, and more.
Link to video recording: https://bnctechforum.ca/sessions/selling-digital-books-in-2024-insights-from-industry-leaders/
Presented by BookNet Canada on May 28, 2024, with support from the Department of Canadian Heritage.
GraphRAG is All You need? LLM & Knowledge GraphGuy Korland
Guy Korland, CEO and Co-founder of FalkorDB, will review two articles on the integration of language models with knowledge graphs.
1. Unifying Large Language Models and Knowledge Graphs: A Roadmap.
https://arxiv.org/abs/2306.08302
2. Microsoft Research's GraphRAG paper and a review paper on various uses of knowledge graphs:
https://www.microsoft.com/en-us/research/blog/graphrag-unlocking-llm-discovery-on-narrative-private-data/
Smart TV Buyer Insights Survey 2024 by 91mobiles.pdf91mobiles
91mobiles recently conducted a Smart TV Buyer Insights Survey in which we asked over 3,000 respondents about the TV they own, aspects they look at on a new TV, and their TV buying preferences.
Encryption in Microsoft 365 - ExpertsLive Netherlands 2024Albert Hoitingh
In this session I delve into the encryption technology used in Microsoft 365 and Microsoft Purview. Including the concepts of Customer Key and Double Key Encryption.
Securing your Kubernetes cluster_ a step-by-step guide to success !KatiaHIMEUR1
Today, after several years of existence, an extremely active community and an ultra-dynamic ecosystem, Kubernetes has established itself as the de facto standard in container orchestration. Thanks to a wide range of managed services, it has never been so easy to set up a ready-to-use Kubernetes cluster.
However, this ease of use means that the subject of security in Kubernetes is often left for later, or even neglected. This exposes companies to significant risks.
In this talk, I'll show you step-by-step how to secure your Kubernetes cluster for greater peace of mind and reliability.
State of ICS and IoT Cyber Threat Landscape Report 2024 previewPrayukth K V
The IoT and OT threat landscape report has been prepared by the Threat Research Team at Sectrio using data from Sectrio, cyber threat intelligence farming facilities spread across over 85 cities around the world. In addition, Sectrio also runs AI-based advanced threat and payload engagement facilities that serve as sinks to attract and engage sophisticated threat actors, and newer malware including new variants and latent threats that are at an earlier stage of development.
The latest edition of the OT/ICS and IoT security Threat Landscape Report 2024 also covers:
State of global ICS asset and network exposure
Sectoral targets and attacks as well as the cost of ransom
Global APT activity, AI usage, actor and tactic profiles, and implications
Rise in volumes of AI-powered cyberattacks
Major cyber events in 2024
Malware and malicious payload trends
Cyberattack types and targets
Vulnerability exploit attempts on CVEs
Attacks on counties – USA
Expansion of bot farms – how, where, and why
In-depth analysis of the cyber threat landscape across North America, South America, Europe, APAC, and the Middle East
Why are attacks on smart factories rising?
Cyber risk predictions
Axis of attacks – Europe
Systemic attacks in the Middle East
Download the full report from here:
https://sectrio.com/resources/ot-threat-landscape-reports/sectrio-releases-ot-ics-and-iot-security-threat-landscape-report-2024/
The Art of the Pitch: WordPress Relationships and SalesLaura Byrne
Clients don’t know what they don’t know. What web solutions are right for them? How does WordPress come into the picture? How do you make sure you understand scope and timeline? What do you do if sometime changes?
All these questions and more will be explored as we talk about matching clients’ needs with what your agency offers without pulling teeth or pulling your hair out. Practical tips, and strategies for successful relationship building that leads to closing the deal.
The Art of the Pitch: WordPress Relationships and Sales
Collaborative performance
1. Industrial Management & Data Systems
Emerald Article: Collaborative performance measurement in supply chain
Dimitris Papakiriakopoulos, Katerina Pramatari
Article information:
To cite this document: Dimitris Papakiriakopoulos, Katerina Pramatari, (2010),"Collaborative performance measurement in supply
chain", Industrial Management & Data Systems, Vol. 110 Iss: 9 pp. 1297 - 1318
Permanent link to this document:
http://dx.doi.org/10.1108/02635571011087400
Downloaded on: 14-07-2012
References: This document contains references to 71 other documents
To copy this document: permissions@emeraldinsight.com
This document has been downloaded 1871 times since 2010. *
Users who downloaded this Article also downloaded: *
Charles Inskip, Andy MacFarlane, Pauline Rafferty, (2010),"Organising music for movies", Aslib Proceedings, Vol. 62 Iss: 4 pp.
489 - 501
http://dx.doi.org/10.1108/00012531011074726
Laura C. Engel, John Holford, Helena Pimlott-Wilson, (2010),"Effectiveness, inequality and ethos in three English schools",
International Journal of Sociology and Social Policy, Vol. 30 Iss: 3 pp. 140 - 154
http://dx.doi.org/10.1108/01443331011033337
Aryati Bakri, Peter Willett, (2011),"Computer science research in Malaysia: a bibliometric analysis", Aslib Proceedings, Vol. 63
Iss: 2 pp. 321 - 335
http://dx.doi.org/10.1108/00012531111135727
Access to this document was granted through an Emerald subscription provided by INDIAN INSTITUTE OF MANAGEMENT AT LUCKNOW
For Authors:
If you would like to write for this, or any other Emerald publication, then please use our Emerald for Authors service.
Information about how to choose which publication to write for and submission guidelines are available for all. Please visit
www.emeraldinsight.com/authors for more information.
About Emerald www.emeraldinsight.com
With over forty years' experience, Emerald Group Publishing is a leading independent publisher of global research with impact in
business, society, public policy and education. In total, Emerald publishes over 275 journals and more than 130 book series, as
well as an extensive range of online products and services. Emerald is both COUNTER 3 and TRANSFER compliant. The organization is
a partner of the Committee on Publication Ethics (COPE) and also works with Portico and the LOCKSS initiative for digital archive
preservation.
*Related content and download information correct at time of download.
2. The current issue and full text archive of this journal is available at
www.emeraldinsight.com/0263-5577.htm
Collaborative
Collaborative performance performance
measurement in supply chain measurement
Dimitris Papakiriakopoulos and Katerina Pramatari
ELTRUN, Department of Management Science and Technology, 1297
Athens University of Economics and Business, Athens, Greece
Received 11 February 2010
Abstract Revised 10 April 2010
Purpose – The objective of this paper is to demonstrate the challenges when developing a common Accepted 19 June 2010
performance measurement system (PMS) in the context of a collaborative supply chain.
Design/methodology/approach – The paper utilizes qualitative and quantitative data from a case
study. The qualitative data refer to the assessment of collaborative performance measures based on
interviews with experts, while the quantitative data demonstrate the use of two performance measures
in a collaborative supply chain network.
Findings – The development of a collaborative PMS is a challenging task. Through the systematic
study of two significant performance measures for a supply chain, it was found that the one could not
be supported due to reliability restrictions, while the other requires the development of a complex
information system. Based on these, a discussion of specific challenges follows.
Research limitations/implications – The paper has the general case study limitations.
Practical implications – Companies operating in supply chain networks need to synchronize
existing business processes and data before the design of a new PMS. Selecting the measures and the
measurement method is not a trivial task. Important challenges reveal when dealing with, underlying
data, business processes and the evaluation method of a PMS in supply chains.
Originality/value – The management control function usually focuses on the design and
development of PMSs for a single organization. Limited knowledge exists when more than two
companies require the development of a PMS for a jointly agreed business process.
Keywords Supply chain management, Performance measurement (quality), Inventory, Partnership
Paper type Research paper
1. Introduction
The design and development of performance measurement systems (PMSs) is part of the
management control function (Simons, 2000). The field attracts the interest of
cross-discipline researchers and includes several methods and tools, which are
increasing due to the lack of an accepted, uniform applicable and consolidated theory
(Otley, 1999). Management control has the constant need to capture the efficiency and
the effectiveness of a company, and performance measurement is the actual and concrete
instrument to cover this need (Eccles, 1991). In this paper, we examine the employment
of a common PMS in the context of a complex organizational setting, namely a
collaborative network, as this is formed by a supply chain in the fast moving consumer
goods industry.
The supply chain environment calls for collaboration between supply chain partners,
who often establish strong relationships with each other. In such a complex setting, Industrial Management & Data
the quest for performance is still an open issue (Fawcett et al., 2008). Systems
Vol. 110 No. 9, 2010
Performance-measurement concepts and tools have been proposed to cover pp. 1297-1318
management control needs for a single company (Kaplan and Norton, 1995; Anderson q Emerald Group Publishing Limited
0263-5577
and Young, 1999; Otley, 1999). The integrative philosophy of supply chain management DOI 10.1108/02635571011087400
3. IMDS eliminates the boundaries of the single firm and puts emphasis on the effectiveness of the
110,9 supply chain as a whole (Bowersox and Closs, 1996; Chan et al., 2003). Relevant research
efforts in measuring performance of supply chains focus either on the identification of
significant performance metrics (Gunasekaran et al., 2001; Lambert and Pohlen, 2001;
Hofman, 2004) or on the examination of the collaborative success of the supply chain
(Corsten and Kumar, 2005; Fawcett et al., 2008). The idea of a common PMS was
1298 suggested by Holmberg (2000), who identified the fragmented measurement activities of
a Swedish home furnishing business supply chain and proposed the use of systems
thinking when developing PMSs. The importance of the topic has been recently
recognized by Busi and Bititci (2006), who have indicated collaborative performance
measurement as an issue for further research.
The objective of this paper is to demonstrate the challenges when developing a
common PMS in the context of a collaborative supply chain, enabled by information
sharing practices between supplier and retailer. In doing so, we studied the collaborative
process of store ordering and shelf replenishment. Based on the analysis of user
requirements and interviews with experts, we concluded a set of performance measures
to be maintained by the collaborative platform. To limit the scope of research, we further
investigated two crucial measures (inventory level and product availability), because
they:
.
reflect the operational results of the replenishment process;
.
require the involvement of all the trading partners; and
.
are highly innovative and do not contradict with existing performance measures.
The lessons learnt when developing these measures range from technical inefficiencies
to core management control functions of the business processes.
In Section 2 of the paper, we briefly present the background literature of the
performance-measurement field, addressing the pertinent research streams, the types of
performance measures, and the role of IT and summarize relevant initiatives and case
studies. The Section 3 describes the research methodology and the steps undertaken in
order to design a collaborative PMS. In order to focus on the realistic application and use
of the system, a case study of an existing collaborative supply network is described in
Section 4, where two important performance measures are examined in detail, followed
by the identified challenges. Finally, Section 5 concludes the paper with the study’s
limitations and thoughts for further research.
2. Performance measurement in supply chain
Performance measurement is the process of quantifying the effectiveness and efficiency
of action (Neely et al., 1995). The instrument that regularly supports the
performance-measurement process is referred to as PMS. A PMS maintains various
metrics (performance measures) that are used for different purposes, like supporting
decision making and management control, evaluating the results, motivating people,
stimulating learning, improving coordination and communication (Neely et al., 1995;
Simons, 2000). A performance measure is information delivered to the management
function, evaluating the efficiency and the effectiveness of a process, resource or an
outcome. Most of the studies in the area argue that a PMS should contain financial and
non-financial metrics (Kaplan and Norton, 1995).
4. Few performance frameworks have been proposed like activity-based costing Collaborative
(Anderson and Young, 1999), the balanced scorecard (Kaplan and Norton, 1995) and performance
performance prism (Neely et al., 2002), to facilitate the design of a PMS. Designing PMSs
is a widely discussed issue and many researchers have examined important aspects like measurement
the linkage of strategy with the measures, balancing internal with external measures,
mapping measures to processes, etc. (Kaplan and Norton, 1995; Bourne et al., 2000;
Neely et al., 2002). The need to extend the knowledge around PMSs from the boundaries 1299
of a single firm to the level of supply chain has been suggested early in the pertinent
literature (Van Hoek, 1998; Beamon, 1999).
Supply chain management is a multidisciplinary field and it is addressed from many
different perspectives. Otto and Kotzab (2003) through desk research identified system
dynamics, operation research, logistics, marketing, organizational theory and strategy
as relevant scientific fields to performance measurement in supply chains. These
findings are in line with the suggestions of Neely et al. (1995) who proposed that a PMS
should incorporate different perspectives, because they are of equal importance from a
management perspective. The existence of different perspectives blurs the decision
regarding what it is (or not) significant to measure in a supply chain, thus a growing, yet
important, number of performance measures has been suggested in the literature.
At the end of the 1990s, most of the measures suggested in the area of supply chain
management were focusing on the performance of the logistics and distribution
networks. Undoubtedly, measures related to the inventory cost or lead time are
important, but provide limited and inadequate view when the level of discussion refers
to complex supply chain settings. According to Van Hoek (1998), the scope of
performance measurement in a supply chain needs to be holistic. A similar suggestion is
also provided by other scholars, who agree that an integrated approach needs to be
adopted when measuring performance in a supply chain (Bititci et al., 2000; Lambert and
Pohlen, 2001). Beamon (1999) claimed that appropriate measures in supply chain
management fall into three categories, namely resources, output and flexibility.
Gunasekaran et al. (2001) argue that performance measures should be identified into
different levels according to the decision-making process, thus the suggested measures
are strategic, tactical and operational. De Toni and Tonchia (2001) suggested that
financial and non-financial measures should be considered. In a synthetic and important
study, Gunasekaran and Kobu (2007) reviewed the pertinent literature and a number of
cases. They identified 46 different performance measures, addressing the performance
of a supply chain. They remarked that almost 50 percent of the suggested performance
measures are related to internal business processes (internal view) of a supply chain and
the remaining 50 percent refer to the customer (external view) of the supply chain.
Making the choice between the internal and the external view of a supply chain is also
associated to finding the right balance between operational efficiency and customer
responsiveness (Fisher, 1997).
Other research efforts adopt a specific performance measurement framework
(e.g. balanced scorecard) and suggest other sets of measures. For example, Kleijnen and
Smits (2003) used balanced scorecard and through simulation they examined how
performance metrics react with environmental and managerial control factors. In the
same direction, Brewer and Speh (2000) followed the framework of balanced scorecard
to measure supply chain performance. Gunasekaran et al. (2004) proposed a framework
for performance measurement in the supply chain, incorporating several
5. IMDS performance measures, like variances against budget, human resource productivity,
110,9 quality of delivered goods, etc. Depending on the supply chain activities and processes,
measures from all many different perspectives are found in their suggested framework,
which was further empirically validated.
Most of the studies related to measuring performance in supply chains discuss what
to measure and provide valuable information and guidelines for the design of the PMS.
1300 Folan and Browne (2005) reviewed the available recommendations and frameworks in
the area of performance measurement and identified more than 30 propositions
regarding how to build a PMS. Within the growing literature of recommendations,
guidelines, performance measurement frameworks and suggested measures, little
attention has been paid on case studies that would enable the validation and extraction
of knowledge regarding the implementation and use of a PMS in the real environment.
Hudson et al. (2001) surveyed the use of PMSs in small and medium enterprises and
found substantial implementation barriers. The problems faced during the
implementation of the balanced scorecard in a single firm are also reported in Ahn’s
(2001) work. Bourne et al. (2003) were among the first who explicitly argued that the
research stream of performance measurement is at the stage of identifying difficulties
and pitfalls to be avoided based on practitioner experience.
The need to bridge the gap between theory and practice has motivated the study of
implementation issues of PMSs and frameworks (Lohman et al., 2004; Wagner and
Kaufmann, 2004; Fernandes et al., 2006; Searcy et al., 2008). These studies point out the
usefulness of adopting a specific performance measurement framework, but they also
highlight important issues during the implementation. For example, Lohman et al. (2004)
suggest that data uniformity is crucial, since different teams in the supply chain are the
users of the single PMS.
The discussion of implementing a PMS shifts the focus from the strategic/managerial
perspective of performance, to the operational use and usefulness of an information
system. The advocate work of Holmberg (2000) identified that systems thinking has an
important role when developing PMSs in supply chains. In the same direction, Beamon
(1999) suggested that a “system” of performance measures is required for accurate
measurement of the supply chain. The implementation of a PMS addresses questions
like which are the relevant data, how do available data support the selected performance
measures, who has access to the measures, how is a measure linked to a corrective action,
etc. Simatupang and Shidharan (2003) propose that the members of the supply chain
should jointly agree on a PMS. Moreover, they suggest a generic process to measure
performance in supply chains with the following steps:
(1) design the PMS;
(2) facilitate measurement though the utilization of a common information sharing
and resource-allocation system;
(3) provide incentives to the members of the supply chain; and
(4) intensify performance, which addresses system’s maintenance though
comparing and modifying performance measures.
The aforementioned steps are highly related with a systems thinking approach,
because they take into account how performance measurement affects decisions and
participation of the members of the supply chain and in addition address the issue
6. of maintaining the system. The approach of Bourne et al. (2000) is also based on Collaborative
systems thinking, as they identify three different evolving stages for a PMS, namely performance
design, implementation and maintenance.
Speakman et al. (1998) argue that collaboration is a dominant approach in supply measurement
chain management aimed to gain benefits and share results among the trading partners.
Indeed, several researchers have reported that collaboration, enabled by information
sharing, can increase the performance of a supply chain (Cachon and Fisher, 2000; 1301
Lee et al., 2000; Croson and Donohue, 2003; Pramatari and Miliotis, 2008). However, the
impact on supply chain performance also depends on the kind of information shared, the
frequency of sharing and the relationship between the trading partners (Kehoe and
Boughton, 2001), making questionable whether collaboration achieves the expected
results. Existing collaboration practices in supply chains, facilitated by information
sharing, have not yet examined the performance systematically, implying the absence of
a collaborative PMS. Most of the studies examining the impact of information sharing on
supply chain performance utilize simulation models (Chen et al., 2007), numerical and
experimental data analysis (Fu and Piplani, 2004), and surveys (Akintoye et al., 2000).
In conclusion, the development and maintenance of a collaborative PMS has not been
discussed in the pertinent literature. Moreover, the research community has long
stressed the importance of case studies as a consolidation tool between existing theory
and practice (Lohman et al., 2004; Hudson et al., 2001). To this end, we argue that the
challenges to build a common PMS includes managerial and technological barriers that
supply chain trading partners need to overcome. Based on these, the contribution of this
work is summarized as follows:
.
It studies performance measurement in the supply chain based on a real case
setting.
.
It focuses on the implementation issues and challenges of the PMS.
.
It refers to a collaborative supply chain with daily information sharing activities
in the downstream of the supply chain.
3. Methodology
3.1 Research method
Our empirical research has been facilitated through case study research. We have,
specifically, selected an existing collaboration network comprising major product
suppliers and a retail chain. The selection of this setting was done in order to meet the
requirements of collaboration, namely trust and commitment between the trading
partners (Speakman et al., 1998; Saura et al., 2009). The collaborating members have
jointly developed a new store ordering and replenishment business process in order to
align their strategic plans and provide increased service level to the end consumers, thus
the information sharing is mainly conducted in the downstream of the supply chain.
Moreover, the daily information sharing between the participants is facilitated by the
internet and web technologies.
After few years of operation, managers were not aware about the results achieved
through this collaborative network. The main barrier has been the absence of a PMS
measuring collaboration success (Law et al., 2009; Fawcett et al., 2008). Thus, on one
hand, the management function had designed and jointly implemented a collaborative
business process and, on the other, it was not able to fully evaluate the impact
7. IMDS of the process. The decision to develop a common PMS has been facilitated by the
110,9 suggestions of Simatupang and Shidharan (2003) regarding the jointly agreement on
what to measure and how to measure. Approaching a common agreement between
multiple trading partners, regarding what to measure, few iterations are required
(Figure 1).
The scope of the collaboration and the respective PMS has been defined around the
1302 store replenishment process and the business needs associated with it. This further
guided the review of the literature and identification of other relevant studies (Van Hoek,
1998; Beamon and Ware, 1998; Lambert and Cooper, 2000). Special attention has been
paid to other collaborative planning, forecasting and replenishment cases within the
retail industry, because the selected case has been based on this framework
(Holmstrom et al., 2002; Seifert, 2002; Fliedner, 2003). The result was a set of candidate
performance measures that were found relevant to implement by all the trading
partners.
The presentation of the candidate measures to the experts paved the ground for
in-depth interviews and acted as the base to exchange ideas for refinement of the
measures. At a later step, the performance measures were examined under two
perspectives:
(1) whether a common measurement method is acceptable by the trading partners;
and
(2) whether the available data of the collaborative network can support the
performance measures.
The final step dealt with the implementation and evaluation of the performance
measures. Intentionally, all types of performance measures (e.g. financial and
non-financial) were included. In the following sections, we present in more depth the
two of the selected performance measures, inventory level and product availability,
in order to demonstrate the challenges encountered during the development and
evaluation of the PMS.
Scope of the collaborative processes Relevant literature
Candidate performance measures
Review by experts
Examine feasibility
Agree for a common Available data supports
No measurement method performance measures No
Yes The measure could be supported Yes
Implement the performance measures
Figure 1.
The research
method followed Evaluate performance measures
8. 3.2 Data availability Collaborative
Through the collaborative platform supporting the store-replenishment process, we performance
had access to various sources of data. Below an indicative list of the available data is
presented: measurement
.
Point-of-sales data are the collection describing the sales of the store on a daily
basis.
.
Orders data describe the requests placed from the store to the Central Warehouse
1303
(CWH) of the retail chain, depicting the products the store wants to replenish.
.
Deliveries data are the response of the CWH to the store, showing which
products and how many items are delivered compared to what has been ordered.
.
Promotion plan is a calendar of the in-store promotion activities planned by the
retailer and the supplier in collaboration for every store.
.
Product assortment is the list of the active products currently available at a
specific store. Additionally, this file has information regarding the delivery
method of a product (delivered by the CWH or direct store delivery (DSD) by the
product supplier).
.
Physical store audits are based on physical visits of researchers to the store in
order to spontaneously monitor Product Availability of selected products on the
store shelves.
4. Empirical work
4.1 The case setting
The collaborative supply chain of the case comprises three major product suppliers (two
multinational and one national) currently offering more than 1,000 different products in
the market. The retail chain has four CWHs and approximately 200 geographically
disperse retail stores located in Greece. The collaboration was initiated by the product
suppliers, who wanted to increase the visibility in the supply chain and acquire the
benefits of information sharing. The long-time trading activities between the members
of the supply chain ensured the sharing of common goals and beliefs for the Greek
market, a high level of trust in the relationship and finally that the requirements of
collaboration are met. Although two of the product suppliers are main competitors
within important product categories (e.g. detergents and hair care) their collaboration
with the same retailer did not present any competitive threat (Figure 2).
The decisions made in collaboration are:
.
What items does a store need to replenish and in what quantities?
.
What are the expected sales (forecasts) per product?
.
Should the products be replenished by the retailer’s CWH or directly by the
supplier?
.
Which is the recommenced product mix for each store?
.
Which products to promote and in which stores?
The ordering decisions require the daily information sharing of various sources
such as: POS data, store assortment, promotion activities, etc. The role of information
technology is essential in the collaboration since large amounts of data need
9. IMDS Collaboration platform
110,9
Direct store delivery
1304
Retailer distribution
center (DC)
Figure 2.
The structure of the Product Backroom Shelf
collaborative network suppliers Store
to be processes timely and accurately and delivered in a usable manner both to
suppliers and to the store managers.
A startup company, following the software-as-a-service business model, developed
and operated the collaboration platform. One of the service extensions was the
development of a PMS, as performance measurement is a necessary tool for successful
management (Phusavat et al., 2009).
Managers from all the trading partners expressed their interest in examining the
performance according to the objective of the collaboration, which has been “to offer
high service level to consumers by efficiently handling the store ordering process
enhanced by information sharing capabilities”. The design of the PMS should be linked
to the collaboration strategy, in order to:
.
demonstrate the results achieved through the new store ordering and
replenishment process and
.
stimulate learning on the product suppliers’ side wishing to evaluate the effect of
collaboration and examine the possibility of expanding the collaboration process
to other retail chains.
Moreover, the adoption of a specific performance measurement framework (e.g. balanced
scorecard) was found to be complex and costly, at least at the initial stage, due to the
narrow and structured scope of the collaboration. Therefore, it was decided to study a
limited number of performance measures focusing on the specific collaboration process
and on the responsiveness to the consumer. Relevant works in PMS design have
provided guidelines for the PMS of our case. Table I depicts how existing suggestions in
the literature have affected some design options of the specific PMS.
Based on discussions with the managers, we examined their motives to join this
collaboration effort and reconfigure the store ordering and replenishment process.
In particular, the trading partners had the following issues:
.
Inventory levels at the stores were not optimized, implying either overstocking or
out-of-stock situations, and the participants expected that they would be able to
handle the problem through collaboration.
10. Collaborative
Suggested in the literature Impact on the design of the PMS
performance
Reflect strategic alignment (Eccles, 1991; Understand the strategy of the collaboration as the measurement
Kaplan and Norton, 1995; Bititci et al., 2000) tradeoff between effectiveness and responsiveness
Focus on the results of collaboration
Exclude financial performance measures at the initial
stage 1305
Monitor critical activities (Azzone et al., 1991; Focus on the store-replenishment process
Neely et al., 1995) Link of problematic areas with specific performance
measures
Focus at the store level of the supply chain
Measure product delivery from supplier to The integrative view of the supply chain makes the
customer (Dixon et al., 1990) consumer as the only customer
Focus at the store level of the supply chain
Provide measures that all members could Use collaboration platform to share performance Table I.
understand (Dixon et al., 1990) measures in a daily base Utilizing literature
Focus on measures that customer can see Develop performance measure that reflects the service suggestions in the PMS
(Kaplan and Norton, 1995) level of the collaboration to the consumer design of the case
.
High forecast inaccuracies mean that demand forecasting could not be used for
most of the products.
.
Product shelf unavailability (also referred to as out-of-shelf (OOS)) has recently
emerged as one of the most important problems in the retail sector affecting
revenue streams as well as consumer satisfaction.
.
Imperfect orders address a “weak” connection between the retailer’s central
distribution center (DC) and he stores, implying that the DC is not able to cover the
stores’ demand.
Creating performance measures relevant to the problematic areas leverages the
commitment of managers to participate in the design of the PMS. Table II links
Problematic area Interested partner Candidate performance measures
Inventory levels Supplier-retailer Inventory (Beamon, 1999)
Fill rate (Kleijnen and Smits, 2003)
Backorder/stockout (Beamon, 1999)
Stockout probability (Beamon, 1999)
Forecast accuracy Supplier Forecast accuracy (Gunasekaran et al., 2004; Fisher,
1997; Hadaya and Cassivi, 2007)
Product shelf availability Supplier-retailer Flexibility of service system to meet customer needs
(Gunasekaran et al., 2004)
Point of consumption product availability (Neely
et al., 1995)
Imperfect orders Retailer Delivery reliability performance (Gunasekaran et al.,
2004)
Response delay (Kleijnen and Smits, 2003) Table II.
Reliability (Neely et al., 1995) Problems identified and
Deliverability (Neely et al., 1995) the associated
On-time deliveries (Neely et al., 1995) performance measures
11. IMDS the identified problematic areas with a set of candidate performance measures, as found
110,9 in the pertinent literature, and the partner mostly interested in the issue.
From a system architecture perspective, the proposed PMS is located at the top of
the collaboration platform in order to have access to all the available information and
be visible to the respective trading partners. The PMS was developed as a reporting
tool based on an integrative view of the shared data sources. Depending on the
1306 employed measurement method, we distinguish the performance measures into two
categories:
(1) Single performance measures are derived directly by the data sources, are
deterministic in nature and can be expressed though simple formulas.
(2) Composite performance measures extend the available data sources with other
parameters (e.g. probabilities, loss functions, etc.).
Studies in performance system design do not usually include the calculation method for
each suggested performance measure. From a system perspective, this is a major
drawback, because the linkage between the performance measure and the available data is
missing. In our case, defining each performance measure was necessary in order to
proceed with the implementation of the PMS. All measures are defined at the store
and product level. Table III provides information for the implementation of the selected
performance measures. In order to demonstrate the challenges associated with the
development of a common PMS, the measures selected for in-depth investigation are
inventory level and product availability. The reasons for selecting these two measures are:
. they are the most critical measures in respect to the store replenishment process;
.
they measure problematic areas identified by both the retailer and supplier
(Table II);
.
they increase supply chain visibility for the product supplier, because they offer
a view at store level on a daily basis; and
.
the former is examined as a single performance measure and the later as a
composite one.
Performance
measure Type Data used Description Frequency
Inventory level Single Sales Number of items existing in the store Daily
Deliveries for a certain product
Forecast Composite Forecast plans The difference between the expected Weekly
accuracy Sales sales and the observed sales.
In-store promotion Seasonal and promotion
activities amplification of the sales are taken
into account
Product Composite Sales Describes if a product is available on Daily
availability Inventory levels the shelf of a store or not
Table III. Product assortment
A view of the Promotion activities
performance Imperfect Single Orders Examines if the items and quantity Daily
measures used orders Deliveries delivered meet the order of the store
12. The next sections describe the challenges encountered during the development and Collaborative
evaluation of the two performance measures. performance
4.2 Measuring inventory at the store measurement
The inventory level of a product in a store is related with the product availability. On one
hand, if a retail store has enough product quantity stored in the backroom to face the
future consumer demand, at least within the lead time of the store replenishment cycle, 1307
then the possibility of stock out is minimized. On the other hand, ordering and stocking
large amounts of a specific product would lead to overstocking situations.
It would be unrealistic to count the inventory level at the end of each day for all the
products in a store. The approach to use available information and subtract a product’s
sales from the delivered quantities in order to determine the inventory level has high
inaccuracy. According to Kang and Gershwin (2005), it is very difficult to maintain perfect
inventory records at the store level due to various sources of error (e.g. shoplifting, damage
of the products during the transportation, delays in information sharing, etc.). In the
specific case, we found that inventory inaccurate records negatively affect the reliability of
inventory level as a store performance measure.
More specifically, in order to evaluate the accuracy of the inventory level measure, we
selected nine representative stores and thoroughly examined the consistency between
sales and deliveries for all the products for a six-month period. Depending on the
delivery method, we classified the available products into three categories:
(1) The CWH category includes the products that are delivered to the store through
the retail CWH, i.e. retail DC, on a regular basis.
(2) The second category is labeled DSD and includes the products delivered to the
store directly by the supplier.
(3) The last category (CWH/DSD) includes the products which do not meet any of
the above classes. These products are replenished by both the CWH and the
product supplier, in a mixture that is not known in advance, and it is subject to
factors like demand fluctuations, stockout at the CWH, imperfect orders, etc.
Table IV illustrates the distribution among the three classes. On one hand, Store 1 is
the largest store examined, having over 5,000 different products in its assortment,
while on the other hand the smallest store (Store 9) merchandises approximately 1,500
different products. Most of the products (approximately 48 percent) are delivered
Delivery method
Store CWH DSD CWH/DSD Number of products
Store 1 2,291 (45.66%) 2,006 (39.98%) 721 (14.37%) 5,018
Store 2 1,459 (42.44%) 1,491 (43.37%) 488 (14.19%) 3,438
Store 3 2,169 (49.46%) 1,728 (39.41%) 488 (11.13%) 4,385
Store 4 2,533 (50.15%) 1,838 (36.39%) 680 (13.46%) 5,051
Store 5 1,813 (44.18%) 1,783 (43.45%) 508 (12.38%) 4,104
Store 6 1,065 (41.50%) 1,177 (45.87%) 324 (12.63%) 2,566 Table IV.
Store 7 1,771 (43.14%) 1,770 (43.12%) 564 (13.74%) 4,105 Classification of products
Store 8 1,780 (44.82%) 1,721 (43.34%) 470 (11.84%) 3,971 based on the sales and
Store 9 735 (47.88%) 599 (39.02%) 201 (13.09%) 1,535 inventory records
13. IMDS through the CWH, because the ordering cost is lower compared to the cost of the DSD.
110,9 The number of products delivered directly to the store varies between 35 and
45 percent, depending on the store size. The remaining products (that are neither CWH
nor DSD) are classified under the CWH/DSD label. On average, this class represents
14 percent of products.
The collaboration platform shares on a daily basis data from the retail chain,
1308 including deliveries and sales data. This means that the transactions referring to the
CWH products are timely available through the platform and, thus, in the following, we
look only at CWH products. We assume that the total delivered quantity (Q) should
always exceed the observed sales (S) for a given product and store. Consequently, we
adopt the holding inventory formula to calculate the inventory level as a store
performance measure. By definition, holding inventory is non-negative and expressed
by the following formula:
Holding Inventory ¼ Q 2 S $ 0 ð1Þ
The percentage of records that equation (1) is violated has been examined using the
available data (POS and deliveries data). As Table V presents, around 9 percent of the
records has a negative value for the holding inventory. This “unexpected” phenomenon
is caused by deliveries occurring in the store and not monitored on time or at all by the
information system. On the other extreme, the overstocked products are around
5 percent, according to the available records, which is significantly high for retail
business. The inventory measure, relying on the available information, provides
unrealistic results (negative values and high percent of overstocking items), which does
not reflect the exact situation of the daily store inventory. However, we noticed that the
holding inventory value for few product categories with long life cycle, low-priced
products and small promotion activity (e.g. snacks and pasta) could be correctly
estimated. Other categories, more expensive, with high promotion activity and frequent
product introductions (e.g. detergents and shampoo) are on the other extreme, and it is
very unlike to have a reliable performance measure.
Real life events distort the available information regarding the inventory levels.
Having only 50 percent of the available records in the area of the normal levels of holding
inventory is an important barrier for the development of a widely acceptable
performance measure in the specific case. Additionally, the variability of the holding
Negative holding Very low-holding Low-holding Normal levels of
inventory inventory inventory holding inventory Overstocking
(%) (%) (%) (%) (%)
Store 1 10.78 9.38 16.37 58.57 4.90
Store 2 10.56 14.05 28.10 43.98 3.31
Store 3 7.70 13.32 25.68 48.07 5.23
Store 4 13.42 11.69 18.56 48.91 7.42
Store 5 7.7 10.98 26.14 50.07 5.64
Store 6 9.11 15.21 34.18 36.76 4.74
Table V. Store 7 6.32 12.59 30.89 44.77 5.43
Inaccurate records of the Store 8 8.15 12.75 27.81 45.63 5.67
holding inventory Store 9 14.55 16.60 32.65 33.76 2.44
14. inventory changes between the stores. To this end, the development of a performance Collaborative
measure related to inventory level at the store could not be supported due to information performance
quality restrictions. Possible options to gather a more realistic inventory view could be
based on the following: measurement
.
employment of multiple inventory measurement methods for different stores and
product categories;
.
use of probabilistic models to calculate inventory shrinkages; and 1309
.
use of radio-frequency identification (RFID) technology.
4.3 Measuring product availability at the store
The term product availability implies that a product is accessible by the consumer on the
shelf of a retail outlet. However, empirical research has shown that it is not unusual
that the product is not on the shelf when a consumer is looking for it, leading to lost sales
and decreasing consumer loyalty. According to Gruen et al. (2002), the OOS rate is close
to 8.3 percent worldwide, which is considered very high given that an acceptable level
(determined by suppliers and retailers) would be less than 2 percent. Additionally, OOS
rates of promoted items are much higher, affecting the promotional effectiveness
(Gruen et al., 2002). In our case, the suppliers and the retail chain have found such a
performance measure directly related to the objective of collaboration, since it depicts
the responsiveness of the collaborative supply chain towards the end customer.
Currently, the measurement of OOS is utilized through physical store audits,
conducted by the retailer or the product suppliers. However, the high cost of measuring
product availability and the dynamically changing states of the shelves are the major
barriers for acquiring timely information and understanding the problem in detail.
Company Alpha, as the owner of the collaboration platform had decided to implement
a method for the evaluation of product availability at the store utilizing the available
data. After thorough examination of the available computational methods,
a sophisticated heuristic rule-based method was proposed in order to automatically
detect products missing from the shelf. The method has been based on knowledge
engineering principles and more than 100 different rules developed through a
data-mining process (Papakiriakopoulos et al., 2009). Using the same rules on a daily
basis and for all the stores of the retail chain, it is possible to detect products missing
from the shelf. A sample of rules used for the automatic detection of OOS products
is depicted in Table VI.
Products merchandized
RuleID Rule body Accuracy (%)
Rule 21 (LastPosDays $ 3) AND (day ¼ ‘Wednesday’)
AND (StoreSize ¼ ‘Large’) AND
(SD_DailyPosAvg # 2.82) AND
(FastMovingIdx . 0.76) 0.82 0.4
Rule 43 (LastPosDays . 6) AND (SD_PosAvg . 7.9) AND
(day ¼ ‘Tuesday’) 0.42 0.1 Table VI.
Rule 47 (TypeOfProducts ¼ ‘ADV’) AND (posavg . 1.9) Indicative rules used for
AND (Last_Order . 12) AND detecting products
(Mean_Order_quantity , 6) 0.91 0.01 missing from the shelf
15. IMDS Although the rules have been found to accurately detect OOS products, they have an
important drawback, because they cannot cover all the different cases of products
110,9 missing from the shelf. For example, Rule 21 characterizes as OOS the products that
have not sold for the last three days (LastPosDays . ¼ 3), the day of detection is
Wednesday (day ¼ “Wednesday”), the area of interest is only the large stores of the
retail chain (Store_Size ¼ “Large”), the standard deviation of sales only for Wednesday
1310 should be low (SD_DailyPosAvg , ¼ 2.82) and finally the products are fast-moving
items (FastMovingIdx . 0.76). This rule has relatively high detection accuracy
(82 percent) but refers only to a small proportion of the total OOS occurring daily in the
store. Thus, on one hand, the collaborative network acquired an accurate mechanism for
measuring product availability; on the other hand, the mechanism only partially
monitors the products merchandized by the store.
However, a linear correlation has been found between the OOS rate and the number of
products the system detects as OOS per day. The higher OOS rate a store has, the more
OOS alarms it gets. Table VII presents the number of products that are active in a store,
the average OOS rate, as estimated by physical store audits, and the average number of
products the detection mechanism reports as OOS per day. As expected, stores with a
greater OOS problem receive relatively higher counts by the detection mechanism.
The performance measure for estimating product availability was found very
interesting by the participants, but the measurement method employed was rather
complicated. Based on the available data of the collaboration platform, an intelligent
information system was designed and developed but this had limited detection
capabilities for the products missing from the shelf. Nevertheless, the employed
mechanism correctly detected the retail stores encountering the biggest OOS problem,
thus offering a reasonable and uniform method to product suppliers and the retailer
to agree on the stores having the lower product availability and to start planning
corrective actions.
4.4 Implications and discussion
The available case setting revealed some aspects in the area of performance
measurement. The need for a universal framework for selecting performance measures
in supply chains, as identified in the presented case, validates Beamon and Ware’s (1998)
prior research. The challenges identified through the effort to build a common PMS
could be grouped into three broad categories namely:
(1) data management;
(2) business-process management; and
(3) collaboration.
Real world Detection mechanism
Products monitored Average OOS rate (%) Average daily alarmed products
Store 1 4.548 8.91 78
Store 2 3.401 11.70 94
Table VII. Store 3 3.120 12.12 115
Relationship between Store 4 4.079 8.53 82
OOS and alarms by the Store 5 4.634 9.60 103
detection mechanism Store 6 2.870 12.47 117
16. Data management. Data management includes all the actions performed during the life Collaborative
cycle of shared data. While the importance of information sharing has been recognized in performance
the literature (Yu et al., 2001), in practice information quality is a major obstacle.
Information quality has been studied in the context of planning supply chain activities measurement
and some researchers have expressed the opinion that information quality is positively
related with the performance of the supply chain (Petersen et al., 2005; Simchi-Levi et al.,
2008). Previous studies in the upstream supply chain have stressed the benefits of timely 1311
(Bourland et al., 1996; Karaesmen et al., 2004) and complete (Chu and Lee, 2006)
information sharing. In our case, we examined a single performance measure (inventory
level at the store), at the downstream supply chain. The data sources (sales and
deliveries) were considered as timely and complete. Sales data were collected though the
POS scanning infrastructure of the retail stores and the deliveries data were provided by
the warehouse management system that controls the operations of the retail DC.
However, their mix failed to accurately estimate the inventory levels at the store, due to
shrinkage and other factors. The role of new technologies, and in particular RFID
technology, could be a key enabler to improve information quality in an automated
manner (Kelepouris et al., 2007; Lee and Park, 2008).
The provision of inaccurate performance measures is associated with incorrect
decisions. Managers utilize performance measures to quickly identify areas of
improvement (Neely et al., 1995), therefore the provision of unreliable performance
information, would eventually initiate unnecessary corrective actions and as a
consequence the managers lose trust in the PMS. The role of trust is tightly linked with
performance in inter-organizational settings (Zaheer et al., 1998), thus the quality of
information provided by the PMS could hinder the performance if neither reliability
checks nor quality control processes are considered during the implementation.
Business-process management. The examined performance measures did not only
reflect the quality of the shared data, but also support decisions on business processes
that are not part of collaboration. For example, the shelf layout is subject to the category
management business process, which is not covered by the collaboration platform
presented in our case. Hence, the performance measure of product availability
significantly depends on decisions made during the category management process.
The complex nature of supply chain operations is an important challenge to overcome
when implementing such PMSs (Fawcett et al., 2008). Following a “divide and conquer”
approach, as suggested by systems thinking, to implement the PMS is contradictory
with the integrative philosophy of managing a supply chain. Nevertheless, it was found
to be a good managerial learning process, because it motivated managers to re-evaluate
the scope of collaboration and identify existing business processes that need to be
supported by the collaboration platform. To this end, the development of the
measurement system itself can enhance the collaborative strategic management process
by challenging the assumptions and the existing strategy (Bourne et al., 2000), providing
growth prospects though continuous improvement programs. Prior works have stressed
the importance of performance measurement to motivate people and stimulate learning
in the organizations (Kaplan and Norton, 1995). In the presented case, the lessons
acquired through performance measurement made collaborating partners re-evaluate
the collaboration objectives, shift the focus from the timely information sharing to
information quality and re-examine the scope of collaboration through the incorporation
of new business processes.
17. IMDS Collaboration. Most of the benefits identified on the product supplier side derived
110,9 from the practice of information sharing. Based on collaboration and information
sharing, the trading partners reported better performance of decisions in the store-
replenishment process (Lee and Whang, 1999). The availability of daily OOS alarms to
suppliers per retail store has been considered as valuable information since it facilitates
supply chain visibility and allows for rapid corrective actions. From the retailer’s
1312 perspective, this information is useful only because it provides a uniform approach to
estimate the true OOS rate, thus is utilized as a benchmarking process for the stores.
We believe that this is the main opportunity when developing common PMSs: while
every partner activates its individual mechanisms and identifies areas of improvement
in a different way, all of them share the common objective of collaboration.
Collaboration in the supply chain is a key enabling factor for the implementation of a
PMS. Bourne (2005) examined 16 different performance measurement cases at different
levels of design and implementation. His findings suggest that the top management
support is a key factor to proceed with the implementation phase, although in his study,
only two cases finally managed to implement performance measures. The initial definition
of collaboration (Speakman et al., 1998) implies the commitment of the trading partners,
thus it is expected that a PMS referring to a collaboration effort is more likely to be
implemented, as happened to our case. It is also important that non-financial performance
measures are more likely to be part of the collaborative PMS for the next two reasons:
(1) Financial measures are difficult to be agreed and designed because the
resources are common and the cost centers are different for the trading partners.
(2) Most of the managers want to identify the alignment between the jointly agreed
objectives of collaboration and the results achieved.
Common implementation problems, as already discussed in the literature, have been
found in the presented case. Lack of a structured development process of the PMS (Hudson
et al., 2001) and increased effort to collect data and support composite performance
measures (Ahn, 2001) have been barriers to the implementation effort. However,
resistance to measurement efforts (Bourne et al., 2000) and top management commitment
(Neely et al., 1995) have not been substantial problems to the implementation of the
presented PMS.
At the early 1980s, a PMS was close to the budgetary control and aligned with
accounting procedures (Traditional PMS). Ten years later, the management thinking
approach broadened the view of performance measurement and initiated the discussion
regarding strategic alignment of measuring performance, improvement though
measurement, focus on the quality, etc. The role of supply chain management enabled
by information technology allowed the discussion about an integrative approach on
more complex structures and how to manage them though performance measurement
(supply chain PMS). We could say that the case presented in this paper discusses what
we could call a collaborative PMS, making performance measurement a central issue in
managing collaboration (collaborative PMS). Table VIII summarizes the difference
among the three classes of PMS.
5. Conclusions
This paper discusses the development of a PMS in a collaborative context. Although
companies in supply chain networks have the constant need to measure performance,
18. Collaborative
Traditional PMS Supply chain PMS Collaborative PMS
performance
Measuring Identify performance Identify performance Measures derived from the measurement
measures dimensions according to the objective of collaboration
supply chain structure
Number of Variable number of Increased number of Limited number of
measures performance measures performance measures to performance measures 1313
cover all the dimensions
Measures Bias towards financial Focus on financial and non- Focus on non-financial
usage measures financial measures measures
Motives to Measure to improve Measure to understand, Measure to understand the
measure identify areas and improve success of collaboration
Approach Accounting Management thinking Systems thinking
System thinking
Data Significant effort to Very significant effort to Information sharing enabled
management identify and gather data identify and gather data by technology
Data issues Gather available data Integrate available data Information quality Table VIII.
Scope Firm Firm and trading partners Collaborating partners Classification of PMSs
the corresponding systems are in practice isolated. The existing knowledge in the area
of performance measurement needs to be extended to cover the needs of a supply chain,
where collaboration and information sharing practices integrate the participating
companies into a single and integrative unit.
The challenges we found during the development of a common PMS derive from data
management, business process management and collaboration issues. The field is open
in the identification of further challenges, opportunities and barriers. The proper use
of IT is essential in the development of a common PMS, but we argue that the most
important issues are context specific and related to the practical implementation.
There are several limitations in this study; many are associated with the data used
from the collaboration platform and others with the selected case setting. The first
problem relates to the gap between the available data and the business processes
supported by the collaboration network. Although the store-replenishment process is
common for all the trading partners, the data used to support the selected performance
measures have been found to be restrictive against the requirements of a common PMS,
due to the complex nature of the setting (e.g. many participants, different information
sources, etc.). Here, we can argue that the measures examined were in the area of a
feasible solution for the specific case. Nevertheless, the challenges we have faced can be
relevant to similar cases as well, where companies collaborate and share information to
accomplish a specific business objective and not to build a common PMS, which is
usually underestimated as a management function.
The second problem deals with the limitations posed by examining only two
performance measures. The examination of other performance measures might have led
to slightly different results. As with any case study, the findings cannot easily be
generalized to other empirical settings of relevant industrial sectors (e.g. pharmaceutics,
cosmetics, etc.). Since these industries are sharing the same supply chain management
principles, though, it is likely that they face similar challenges when developing a PMS.
However, further investigation is required and a cross-industry comparative research
might reveal a set of common challenges.
19. IMDS Up to now, the knowledge for implementing and maintaining a common PMS is
110,9 limited. With this work, we demonstrate some challenges related to the topic. Further
research is required for the identification of additional challenges, opportunities and
barriers though case studies, where collaboration and information sharing are the key
components of business-process management. Selecting common performance
measures is also a challenging area because it deals with important management and
1314 organizational issues like negotiations, strategic fit and alignment. Finally, the
acceptance of a common PMS is an important issue, because it is expected to facilitate
benchmarking within a collaborative network, allowing direct comparisons of existing
bilateral relationships of the trading partners.
References
Ahn, H. (2001), “Applying the balanced scorecard concept: an experience report”, Long Range
Planning, Vol. 34 No. 4, pp. 441-61.
Akintoye, A., McIntosh, G. and Fitzgerald, E. (2000), “A survey of supply chain collaboration and
management in the UK construction industry”, European Journal of Purchasing & Supply
Management, Vol. 6 No. 3, pp. 159-68.
Anderson, S. and Young, M. (1999), “The impact of contextual and process factors on the
evaluation of activity-based costing systems”, Accounting Organizations and Society,
Vol. 24 No. 7, pp. 525-59.
Azzone, G., Masella, C. and Bertele, U. (1991), “Design of performance measures for time-based
companies”, International Journal of Operations & Production Management, Vol. 11 No. 3,
pp. 77-85.
Beamon, B. (1999), “Measuring supply chain performance”, International Journal of Operations &
Production Management, Vol. 19 No. 3, pp. 275-92.
Beamon, B. and Ware, T. (1998), “A process quality model for the analysis, improvement and
control of supply chain systems”, Logistics Information Management, Vol. 11 No. 2,
pp. 105-13.
Bititci, U., Turner, T. and Begemann, C. (2000), “Dynamics of performance measurement
systems”, International Journal of Operations & Production Management, Vol. 20 No. 6,
pp. 692-704.
Bourland, K., Powell, S. and Pyke, D. (1996), “Exploiting timely demand information to reduce
inventories”, European Journal of Operational Research, Vol. 92 No. 2, pp. 239-53.
Bourne, M. (2005), “Researching performance measurement system implementation:
the dynamics of success and failure”, Production Planning & Control, Vol. 16 No. 2,
pp. 101-13.
Bourne, M., Neely, A., Mills, J. and Platts, K. (2003), “Implementing performance measurement
systems: a literature review”, International Journal of Business Performance Management,
Vol. 5 No. 1, pp. 1-24.
Bourne, M., Mills, J., Wilcox, M., Neely, A. and Platts, K. (2000), “Designing, implementing and
updating performance measurement systems”, International Journal of Operations &
Production Management, Vol. 20 No. 7, pp. 754-71.
Bowersox, D. and Closs, D. (1996), Logistical Management: The Integrated Supply Chain Process,
McGraw-Hill, New York, NY.
Brewer, P. and Speh, T. (2000), “Using the balanced scorecard to measure supply chain
performance”, Journal of Business Logistics, Vol. 21 No. 1, pp. 75-94.
20. Busi, M. and Bititci, U. (2006), “Collaborative performance management: present gaps and future Collaborative
research”, International Journal of Productivity and Performance Management, Vol. 55
No. 1, pp. 7-25. performance
Cachon, G. and Fisher, M. (2000), “Supply chain inventory management and the value of shared measurement
information”, Management Science, Vol. 46 No. 8, pp. 1032-48.
Chan, F., Qi, H., Chan, H., Lau, H. and Ip, R. (2003), “A conceptual model of performance
measurement for supply chains”, Management Decision, Vol. 41 No. 7, pp. 635-42. 1315
Chen, M., Yang, T. and Li, H. (2007), “Evaluating the supply chain performance of IT-based
inter-enterprise collaboration”, Information & Management, Vol. 44 No. 6, pp. 524-34.
Chu, W. and Lee, C. (2006), “Strategic information sharing in a supply chain”, European Journal
of Operational Research, Vol. 174 No. 3, pp. 1567-79.
Corsten, D. and Kumar, N. (2005), “Do suppliers benefit from collaborative relationships with
large retailers? An empirical investigation of efficient consumer response adoption”,
Journal of Marketing, Vol. 69 No. 3, pp. 80-94.
Croson, R. and Donohue, K. (2003), “Impact of POS data sharing on supply chain management:
an experimental study”, Production and Operations Management, Vol. 12 No. 1, pp. 1-11.
De Toni, A. and Tonchia, S. (2001), “Performance measurement systems: models, characteristics,
and measures”, International Journal of Operations & Production Management, Vol. 21
No. 2, pp. 46-70.
Dixon, J., Nanni, A. and Vollman, T. (1990), The New Performance Challenge – Measuring
Operations for World-Class Competition, Dow Jones-Irwin, Homewood, IL.
Eccles, R. (1991), “The performance measurement manifesto”, Harvard Business Review, Vol. 69
No. 1, pp. 131-7.
Fawcett, S.E., Magnan, G.M. and McCarter, M.W. (2008), “Benefits, barriers and bridges to
effective supply chain management”, Supply Chain Management: An International
Journal, Vol. 13 No. 1, pp. 35-48.
Fernandes, K., Raja, V. and Whalley, A. (2006), “Lessons from implementing the balanced
scorecard in a small and medium size manufacturing organization”, Technovation, Vol. 26
No. 6, pp. 623-34.
Fisher, M. (1997), “What is the right supply chain for your product?”, Harvard Business Review,
Vol. 75 No. 2, pp. 105-16.
Fliedner, G. (2003), “CPFR: an emerging supply chain tool”, Industrial Management & Data
Systems, Vol. 103 No. 1, pp. 14-21.
Folan, P. and Browne, J. (2005), “A review of performance measurement: towards performance
management”, Computers in Industry, Vol. 56 No. 7, pp. 663-80.
Fu, Y. and Piplani, R. (2004), “Supply-side collaboration and its value in supply chains”,
European Journal of Operational Research, Vol. 152 No. 1, pp. 281-8.
Gruen, T., Corsten, D. and Bharadwaj, S. (2002), Retail Out-of-Stocks: A Worldwide Examination
of Extent Causes and Consumer Response, Grocery Manufacturers of America,
Washington, DC.
Gunasekaran, A. and Kobu, B. (2007), “Performance measures and metrics in logistics and
supply chain management: a review of recent literature (1995-2004) for research and
applications”, International Journal of Production Research, Vol. 45 No. 12, pp. 2819-40.
Gunasekaran, A., Patel, C. and McGaughey, R. (2004), “A framework for supply chain
performance measurement”, International Journal of Production Economics, Vol. 87 No. 3,
pp. 333-47.
21. IMDS Gunasekaran, A., Patel, C. and Tirtiroglu, E. (2001), “Performance measures and metrics in a
supply chain environment”, International Journal of Operations & Production
110,9 Management, Vol. 21 No. 1, pp. 71-87.
Hadaya, P. and Cassivi, L. (2007), “The role of joint collaboration planning actions in a
demand-driven supply chain”, Industrial Management & Data Systems, Vol. 107 No. 7,
pp. 954-78.
1316 Hofman, D. (2004), “The hierarchy of supply chain metrics”, Supply Chain Management Review,
Vol. 8 No. 6, pp. 28-37.
Holmberg, S. (2000), “A systems perspective on supply chain measurements”, International
Journal of Physical Distribution & Logistics Management, Vol. 30 No. 10, pp. 847-68.
Holmstrom, J., Framling, K., Kaipia, R. and Saranen, J. (2002), “Collaborative planning forecasting
and replenishment: new solutions needed for mass collaboration”, Supply Chain
Management: An International Journal, Vol. 7 No. 3, pp. 136-45.
Hudson, M., Smart, A. and Bourne, M. (2001), “Theory and practice in SME performance
measurement systems”, International Journal of Operations & Production Management,
Vol. 21 No. 8, pp. 1096-115.
Kang, Y. and Gershwin, S. (2005), “Information inaccuracy in inventory systems”,
IIE Transactions, Vol. 37 No. 9, pp. 843-59.
Kaplan, R. and Norton, D. (1995), Translating Strategy into Action: The Balanced Scorecard,
Harvard Business School Press, Boston, MA.
Karaesmen, F., Liberopoulos, G. and Dallery, Y. (2004), “The value of advance demand
information in production/inventory systems”, Annals of Operations Research, Vol. 126
No. 1, pp. 135-57.
Kehoe, D. and Boughton, N. (2001), “New paradigms in planning and control across
manufacturing supply chains”, International Journal of Operations & Production
Management, Vol. 21 No. 5, pp. 582-93.
Kelepouris, T., Pramatari, K. and Doukidis, G. (2007), “RFID-enabled traceability in the food
supply chain”, Industrial Management & Data Systems, Vol. 107 No. 2, pp. 183-200.
Kleijnen, J. and Smits, M. (2003), “Performance metrics in supply chain management”, Journal of
the Operational Research Society, Vol. 54 No. 5, pp. 507-14.
Lambert, D. and Cooper, M. (2000), “Issues in supply chain management”, Industrial Marketing
Management, Vol. 29 No. 1, pp. 65-83.
Lambert, D. and Pohlen, T. (2001), “Supply chain metrics”, International Journal of Logistics
Management, Vol. 12 No. 1, pp. 1-19.
Law, K., Helo, P., Kanchana, R. and Phusavat, K. (2009), “Managing supply chains: lessons
learned and future challenges”, Industrial Management & Data Systems, Vol. 109 No. 8,
pp. 1137-52.
Lee, D. and Park, J. (2008), “RFID-based traceability in the supply chain”, Industrial Management
& Data Systems, Vol. 108 No. 6, pp. 713-25.
Lee, H. and Whang, S. (1999), “Decentralised multi-echelon supply chains: incentives and
information”, Management Science, Vol. 54 No. 5, pp. 633-40.
Lee, H., So, K. and Tang, C. (2000), “The value of information sharing in a two-level supply
chain”, Management Science, Vol. 46 No. 5, pp. 626-43.
Lohman, C., Fortuin, L. and Wouters, M. (2004), “Designing a performance measurement system:
a case study”, European Journal of Operational Research, Vol. 156 No. 2, pp. 267-86.
22. Neely, A., Adams, C. and Kennerley, M. (2002), The Performance Prism: The Scorecard for Collaborative
Measuring and Managing Business Success, Financial Times Prentice-Hall, London.
Neely, A., Gregory, M. and Platts, K. (1995), “Performance measurement system design – a
performance
literature review and research agenda”, International Journal of Operations & Production measurement
Management, Vol. 15 No. 4, pp. 80-116.
Otley, D. (1999), “Performance management: a framework for management control system
research”, Management Accounting Research, Vol. 10 No. 4, pp. 363-82. 1317
Otto, A. and Kotzab, H. (2003), “Does supply chain management really pay? Six perspectives to
measure the performance of managing a supply chain”, European Journal of Operational
Research, Vol. 144 No. 2, pp. 306-20.
Papakiriakopoulos, D., Pramatari, K. and Doukidis, G. (2009), “A decision support system for
detecting products missing from the shelf based on heuristic rules”, Decision Support
Systems, Vol. 46 No. 3, pp. 685-94.
Petersen, K., Ragatz, G. and Monczka, R. (2005), “An examination of collaborative planning
effectiveness and supply chain performance”, The Journal of Supply Chain Management,
Vol. 41 No. 2, pp. 14-25.
Phusavat, K., Anussornnitisarn, P., Helo, P. and Dwight, R. (2009), “Performance measurement:
roles and challenges”, Industrial Management & Data Systems, Vol. 109 No. 5, pp. 646-64.
Pramatari, K. and Miliotis, P. (2008), “Impact of collaborative store ordering on shelf
availability”, Supply Chain Management – An International Journal, Vol. 13 No. 1,
pp. 49-61.
Saura, I., Deltoro, M. and Taulet, A. (2009), “The value of B2B relationships”, Industrial
Management & Data Systems, Vol. 109 No. 5, pp. 593-609.
Searcy, C., Karapetrovic, S. and McCartney, D. (2008), “Application of a systems approach to
sustainable development performance measurement”, International Journal of Productivity
and Performance Management, Vol. 57 No. 2, pp. 182-97.
Seifert, D. (2002), Collaborative Planning, Forecasting, and Replenishment – How to Create
a Supply Chain Advantage, Galileo Press GmbH, Bonn.
Simatupang, T. and Shidharan, R. (2003), “The collaborative supply chain”, The International
Journal of Logistics Management, Vol. 13 No. 1, pp. 15-30.
Simchi-Levi, D., Kaminsky, P. and Simchi-Levi, E. (2008), Designing and Managing the Supply
Chain: Concepts, Strategies, and Case Studies, McGraw-Hill, Boston, MA.
Simons, R. (2000), Performance Measurement and Control Systems for Implementing Strategy:
Text & Cases, Prentice-Hall, Upper Saddle River, NJ.
Speakman, R., Kammouff, J. and Myhr, N. (1998), “An empirical investigation into supply chain
management: a perspective on partnerships”, Supply Chain Management, Vol. 3 No. 2,
pp. 53-67.
Van Hoek, R. (1998), “Measuring the unmeasurable – measuring and improving performance in
the supply chain”, Supply Chain Management, Vol. 3 No. 4, pp. 187-92.
Wagner, S. and Kaufmann, L. (2004), “Overcoming the main barriers in initiating and using
purchasing – BSCs”, Journal of Purchasing & Supply Management, Vol. 10 No. 6,
pp. 269-81.
Yu, Z., Yan, H. and Cheng, E. (2001), “Benefits of information sharing with supply chain
partnerships”, Industrial Management & Data Systems, Vol. 101 No. 3, pp. 114-21.
Zaheer, A., McEvily, B. and Perrone, V. (1998), “Does trust matter? Exploring the effects of
interorganizational and interpersonal trust on performance source”, Organization Science,
Vol. 9 No. 2, pp. 141-59.
23. IMDS Further reading
110,9 Slack, N. (1991), The Manufacturing Advantage, Mercury Books, London.
About the authors
Dimitris Papakiriakopoulos holds a BSc in Informatics and MSc in Information Systems from
Athens University of Economics and Business (AUEB), and a PhD in Information Systems and
1318 Artificial Intelligence also from AUEB. He is a Senior Research Officer at the ELTRUN Research
Centre at AUEB. He has extensive research experience, having been involved in various research
European projects for the last ten years and has more than 15 publications in scientific journals
and international conferences. His research interests are on the area of machine learning methods,
supply chain management and performance improvement though the intervention of technology.
Dimitris Papakiriakopoulos is the corresponding author and can be contacted at: dpap@aueb.gr
Katerina Pramatari is an Assistant Professor at the Department of Management Science and
Technology of the AUEB. She holds a BSc in Informatics and MSc in Information Systems from
AUEB, and a PhD in Information Systems and Supply Chain Management also from AUEB. She
has won both business and academic distinctions and has been granted eight state and school
scholarships. Her research and teaching areas are supply and demand chain collaboration,
traceability and RFID, e-procurement, e-business integration and electronic services. She has
published more than 60 papers in edited books, international conferences and scientific journals,
including Decision Support Systems, Journal of Information Systems, Journal of Information
Technology, The European Journal of OR, Computers and OR, Supply Chain Management:
An International Journal, and International Journal of Information Management.
To purchase reprints of this article please e-mail: reprints@emeraldinsight.com
Or visit our web site for further details: www.emeraldinsight.com/reprints