This document summarizes a presentation about managing enterprise data quality using SAP Information Steward. It discusses:
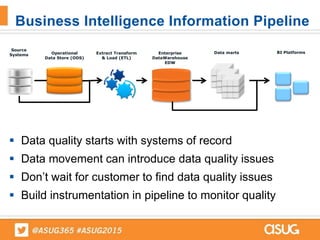
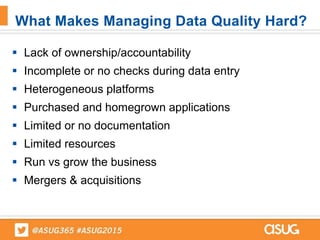
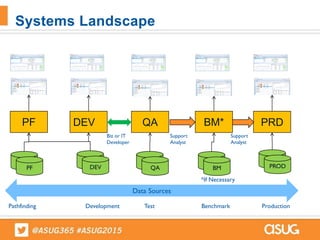
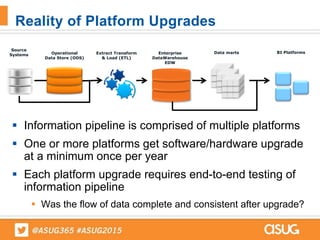
1) How data quality challenges can arise within a business intelligence information pipeline as data moves between systems.
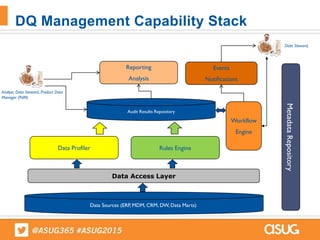
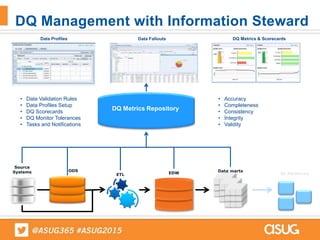
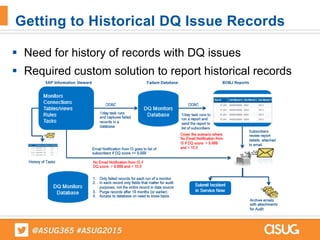
2) The role of Information Steward in providing visibility into data quality issues across systems and addressing those issues.
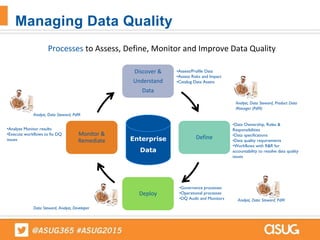
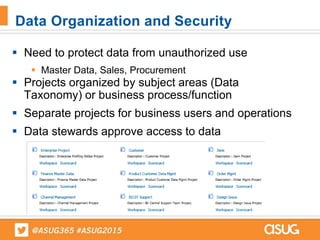
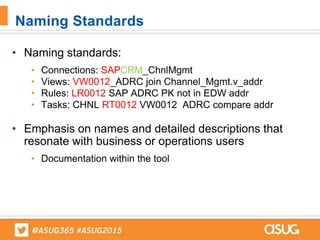
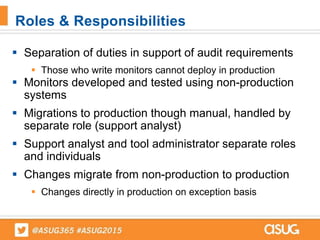
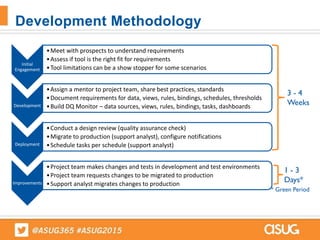
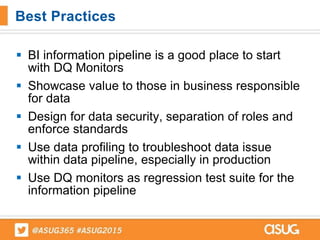
3) Best practices for implementing a data quality tool, such as defining roles and responsibilities, and using the tool to monitor quality and detect issues.


![Disclaimer
This presentation is for informational purposes only. INTEL MAKES NO WARRANTIES, EXPRESS OR IMPLIED, IN
THIS SUMMARY.
Software and workloads used in performance tests may have been optimized for performance only on Intel
microprocessors. Performance tests, such as SYSmark and MobileMark, are measured using specific computer
systems, components, software, operations and functions. Any change to any of those factors may cause the results to
vary. You should consult other information and performance tests to assist you in fully evaluating your contemplated
purchases, including the performance of that product when combined with other products.
For more complete information about performance and benchmark results, visit www.intel.com/benchmarks
Intel and the Intel logo are trademarks of Intel Corporation in the U.S. and/or other countries.
For a list of Intel trademarks, go to http://legal.intel.com/Trademarks/NamesDb.htm]
* Other names and brands may be claimed as the property of others.
Copyright © 2015, Intel Corporation. All rights reserved.](https://image.slidesharecdn.com/e4b496fa-71ba-4a77-8f37-a9b57a89ac25-150619142904-lva1-app6891/85/593-Managing-Enterprise-Data-Quality-Using-SAP-Information-Steward-3-320.jpg)