
Recommended
Recommended
More Related Content
Similar to 5353The Molecular Structures and Thermodynamic Functions.docx
Similar to 5353The Molecular Structures and Thermodynamic Functions.docx (20)
More from troutmanboris
More from troutmanboris (20)
Recently uploaded
Recently uploaded (20)
5353The Molecular Structures and Thermodynamic Functions.docx
- 1. 5353 The Molecular Structures and Thermodynamic Functions of 2-Methylbutane and 2,3-Dimethylbutane Richard H. Boyd Contribution from the Department of Chemical Engineering and the Department of Materials Science and Engineering, University of Utah, Salt Lake City, Utah 84112. Received September 16, 1974 Abstract: Previous values of the stabilities of the conformational isomers of 2-methylbutane and 2,3- dimethylbutane as in- ferred from the Raman spectra and the thermodynamic functions of these compounds have not been in accord with confor- mational concepts as expressed by the number of gauche (skew methyl) interactions. Recent Raman studies have removed some previous ambiguities and have resulted in improved values of the conformational isomer stabilities which show that they cannot be accounted for in terms of numbers of gauche interactions alone. Further, the redetermined stability of the 2- methylbutane conformers is not in accord with previous interpretation of the thermodynamic functions. In the present work, we show that the isomer stabilities, the thermodynamic functions, and the conformational energy minimization calculations are all in reasonable mutual accord. It is emphasized that valence angle distortion is important in reducing gauche strain and accounts for the lack of correlation with the number of gauche
- 2. interactions. Interest in the interpretation and prediction of the con- formational properties of complex organic molecules and polymers has focused a great deal of attention on the prop- erties of those relatively few simple molecules whose prop- erties have been studied thoroughly experimentally. Ob- viously, methods for property prediction must work well on these “test” molecules if we are to have confidence in pre- dictions on more complex molecules. Two examples of the apparent failure of current qualitative concepts of hydro- carbon structure have been the properties of 2-methylbu- tane and 2,3-dimethylbutane. The series «-butane, 2-meth- ylbutane, and 2,3-dimethylbutane each should have two conformational isomers. The conformers of each molecule differ by one gauche (skew methyl) interaction (see Table I and Figures 1, 2, and 3). Hence, the difference in energy between each isomer pair should, on this basis, be nearly the same. In the case of «-butane, it has been known for some time that both the intensity of the Raman vibrational bands1 and the thermodynamic functions2 (S° and Cp°) are in accord with the gauche isomer being ~800 cal more en- ergetic than the trans. This value along with values3 from «-pentane and «-hexane forms the basis of much of the cur- rent interpretation of hydrocarbon conformational proper- ties. However, the situation with respect to 2-methylbutane and 2,3-dimethylbutane has been perplexing. In earlier work, the Raman spectrum of 2-methylbutane indicated an energy difference of ~100 cal between conformers.4 How- ever, from analysis of the thermodynamic functions (S°, Cp°) Scott et al.5 concluded that the Cs isomer was of much higher energy (at least several kilocalories) than the C form. For 2,3-dimethylbutane Szasz and Sheppard4 found no temperature sensitive conformer bands from which it was concluded that either one isomer was of much higher energy or that both existed in equal population (AH = 0).
- 3. Scott et al.5 concluded from the thermodynamic functions that both conformers have the same energy. Allinger et al.6 on the basis of conformational energy calculations predicted that the isomers should be of nearly equal energy. They pointed out the importance of valence angle distortion in determining conformer stabilities. The advent of laser Raman spectroscopy has made a much more careful analysis of the spectrum possible. Verma, Murphy, and Bernstein7 have recently restudied the temperature dependent conformer bands in 2-methylbutane and have found such bands in 2,3-dimethylbutane allowing them to assign energy differences between conformational isomers (see Table I). They also have redetermined the en- ergy difference in «-butane. They find a systematic drop in AH through the series with the isomers of 2,3-dimethylbu- tane being of nearly comparable energy. In confirmation of the latter, they find the ratio of intensities of the two forms to be ~2 to 1 in agreement with the statistical weights. The crystalline phase band corresponds to the less intense liquid band as is consistent with it being due to the more symmet- rical C2/1 form. In summary then, the situation seems to be that for 2-methylbutane the previous interpretation of the thermodynamic functions is not consistent with the new Raman results. For 2,3-dimethylbutane the energy differ- ence between conformers is now unambiguously settled in favor of nearly equally stable forms. This energy difference is anomalously low in the context of gauche interactions but is consistent with conformational energy calculations in which all internal degrees of freedom are allowed to partici- pate. In view of these new data that have removed the previous experimental ambiguities and the crucial importance of these well-studied molecules as test cases for predictive
- 4. methods, it now seems appropriate to undertake a unified critical comparison of the relationships among the confor- mer stabilities, thermodynamic functions, and results of conformational energy mimimization calculations. This is the purpose of the present paper. Calculations Energy minimization calculations were carried out using previously developed algorithms.8,9 The parameters with one exception have been reported earlier.10 The exception is an adjustment to the intrinsic rotational barrier. Recent work with barriers11 had shown that our previous intrinsic barrier is a bit low and in the present work we have in- creased it by 20% from 2.1 to 2.5 kcal/mol. The latter gives a total barrier of 2.8 kcal/mol for ethane. Calculated ener- gy differences reported by Allinger and his coworkers6 using their parameters are also listed. In order to evaluate the thermodynamic functions, the vi- brational frequencies are required. Calculated values of these are also available from the minimization algorithm.8 The calculated frequencies are listed in Table II along with observed frequencies. The latter are principally those re- ported by Snyder and Schachtschneider.12a'b A few com- ments concerning our calculated frequencies are in order. Snyder and Schachtschneider have shown123·6 that a proper set of transferable force constants leads to excellent agree- ment between calculated and observed frequencies for al- Boyd / 2-Methylbutane and 2,3-Dimethylbutane D ow nl oa
- 9. sh ar e pu bl is he d ar ti cl es . 5354 Table I. Summary of Experimental and Calculated Conformer Energies No. of //(earlier) gauche (skew Conforma- methyl) in- Thermodynamic AH(recent tional isomers teractions Oja Raman functions Raman)/ Ah (conf caled.)# (1) (2) (3) (4) (5) (6) (7) (8)
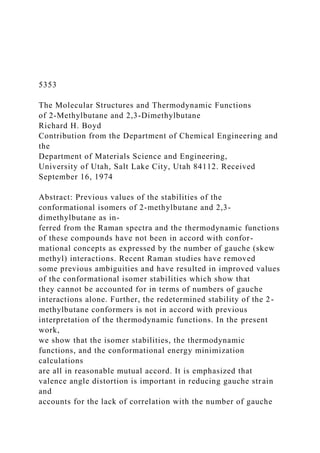
- 10. «-Butane Trans 0 1/2 Hob 800d 966 ± 54 675 (730) 670 Gauche 1 2/2 cal/mol cal/mol cal/mol cal/mol 2-Methylbutane c, 1 2/1 Cs 2 1/1 10CK >2000-? 809 ± 50 588 (640)440 2,3-Dimethylbutane C2h 2 1/2 c2 3 2/2 0 or >100 0<? 0<? 54 ± 30 201 (250)80 a Statistical weight (number of stereo isomers divided by rotational symmetry number), b Reference 1. c Reference 4. d Reference 2. e Reference 5. / Reference 7. S From conformational energy minimization calculations. The first value is from this work, the value in parentheses is the first value corrected for zero-point and vibrational energy (ref 10), the third value is from ref 6. Figure 1. Calculated structures of conformers of n-butane. In Figures 1-3 torsional angles are underlined, are based on atoms 1, 2, 3, and 4, and are.based on eclipsed as = 0°. In gauche n-butane both torsional angle adjustment (from 60 to 66.0°) and valence angle adjustment (both 1, 2, 3 and 2, 3, 4) contribute to increasing the nonbonded dis- tance (1,4) and reducing methyl—methyl repulsion. Figure 2. Calculated structures of conformers of 2- methylbutane. In the Ci form, torsional angle adjustment (from 180° to 186.6°) assists
- 11. in increasing the methyl—methyl (1,5) distance but only one valence angle adjustment (1, 2, 3) can assist. Thus, the methyl—methyl dis- tance is less and the repulsion greater than in gauche-n-butane (see Figure 1). Although torsional adjustment is not possible in the Cs form, methyl-methyl distances (1, 5 and 1, 4) greater than in the Ci form re- sult from valence angle (1, 2, 3) adjustment to 115°. kanes (about 1% overall). To achieve this agreement, they found it necessary to include interaction force constants, especially between bending and stretching. Our conforma- tional energy force field does not include (valence) interac- tion constants and therefore our overall agreement with the observed frequencies is not as good. However, the largest discrepancies involve principally various C-H bending mo- tions with frequencies above 1000 cm-1. The thermody- namic functions are relatively insensitive to these and our calculated values are quite satisfactory. The thermodynam- ic functions are most sensitive to the low frequency torsion- al motions. The methyl torsional frequencies are sensitive to differ- ences in nonbonded interactions in different conformations. The Snyder-Schachtschneider force field does not include nonbonded interactions and thus does not accurately reflect the effect of steric interactions on methyl torsional frequen- Figure 3. Calculated structures of conformers of 2,3- dimethylbutane. In the Cih form, methyl—methyl distances (1,5 and 4, 6) are excep- tionally short since alleviation by torsional adjustment or by
- 12. valence angle adjustment is not possible. In the C2 form, torsional angle adjust- ment increases distances (1,4) and (5, 6). The otherwise shortened 1, 5 distance is increased by adjustments of valence angles (1, 2, 3) and (2, 3,5). cies. Since there was little experimental information on such frequencies available to them, this inadequacy was not apparent in the overall accuracy of their calculated frequen- cies. In Table II calculated frequencies for both the Snyder- Schachtschneider force field and ours are compared with the observed frequencies for propane. Experimental values of the methyl torsional frequencies are now available for the latter from neutron diffraction.13 The above mentioned points of the superiority of the (valence) interaction con- stant containing force field in the middle frequency region and the superiority of our nonbonded interaction containing force field for the methyl torsions are illustrated by this molecule. The calculated frequencies together with the calculated moments of inertia were used to calculate the thermody- namic functions for each conformer. The functions for the torsional vibrations were corrected for anharmonicity using the tables of Pitzer.14 The required barrier heights were cal- culated from the harmonic frequencies and the effective moments of inertia. The conformer functions were then combined to obtain the thermodynamic functions of the equilibrium mixture of conformers by methods previously described.9 The equilibrium mixture calculation requires the enthalpy difference between conformers. The calcula- tion was carried out for both the observed (column 7) and calculated (column 8) AH values of Table I. Both sets of re-
- 13. sulting thermodynamic functions are listed in Table III. In the case of 2-methylbutane, the value of AH = <=(>2000 cal) proposed by Scott et al.5 is also included. The observed values are shown also. The values for 2-methylbutane and 2,3-dimethylbutane are those tabulated by Scott et al.5 For 2-methylbutane they are based on the experimental values of Scott et al.5 for Cp°(gas) and AHvap° and the values of Journal of the American Chemical Society / 97:19 / September 17, 1975 Table II. Calculated and Observed Vibrational Frequencies (cm l)a Propane 5355 trans-n-Butane Caled. Obsd. Caled. Obsd. Caled. Obsd. Caled. Obsd. A, a; 2974 (2966)6 2872 (2882) 2855 (2856) 1493 (1471) 1421 (1445) 1404 (1378) 1064 (1151) 851 ( 870)
- 14. 388 ( 382) 2973 (2964) 1441 (1459) 1200 (1279) 970 ( 903) 212 ( 200) 2965 2875 1473 1449 1385 1157 868 375 1278 899 217 ± 8C B, 2971 2865 1561 1412 1370 1000 929 B2 2973 2925 1444 1053
- 15. 774 259 (2963) (2882) (1465) (1367) (1342) (1046) ( 924) (2965) (2921) (1464) (1185) ( 747) ( 220) 2965 2875 1464 1370 1332 1049 921 2965 2915 1459 1187 748 265 ± 8c Ag 2973 2872 2859
- 18. 965 gauche-n-Butane Cj 2-methylbutane Cs 2-methylbutane Caled. Obsd. Caled. Obsd. Caled. Obsd. Caled. Obsd. Caled.d Calcd.d A 2974 B 2973 2974 1400 1351 A’ 2975 298 2972 2971 2973 1345 1337 2971 230 2925 2923 2973 1304 1298 2971 A" 2974 2872 2868 2972 1220 1268 2897 2972 2860 2854 2972 1113 1176 2870 2971 1576 1529 2970 1073 2864 2923 1473 1440 2923 1066 1149 2858 2865 1450 1417 2897 1014 1037 1570 1549 1410 1404 2869 1000 1011 1516 1452 1398 1368 2865 970 969 1462 1438 1210 1282 1207 1233 2864 967 952 1445 1410 1063 1167 1027 1133 2857 941 917 1420 1341 1023 1077 994 1584 904 910 1415 1209 983 981 937 956 1544 827 796 1397 1066 854 835 752 747 1503 758 764 1345 1014 777 789 449 1464 443 459 1110 972 329 325 213 1448 419 1069 940 274 1444 361 368 1010 770 110 1442 292 961 375 1417 1384 255 896 275 1414 1377 227 760 207 1410 1366 212 531 87 93 388 C2n 2,3-dimethylbutane C2 2,3-dimethylbutane Caled.d Caled. Obsd. Caled ß Caled. Obsd. Caled. Obsd. Calcd.d Caled. Obsd.
- 19. 2974 Au 2972 Bg 2971 Bu 2973 A 2975 931 1410 2973 2970 2968 2972 2973 746 1352 2899 2865 2863 2892 2972 454 1284 1297 2866 1533 1561 2865 2970 343 1082 1168 1571 1456 1439 1496 2897 308 1063 1103 1471 1409 1368 1412 1442 2866 274 1021 1038 1449 1306 1304 1350 1417 1377 1569 234 970 1403 1053 1067 1079 1292 1278 1549 67 940 910 1137 969 956 972 1089 1155 1457 877 835 1069 941 918 938 1019 989 1447 B 2974 537 932 314 401 870 871 1445 2972 412 799 219 207 421 1416 2971 298 481 65 360 1409 2970 242 372 223 1341 1297 2894 209 248 1139 1199 2866 1088 1161 2863 1045 1029 1501 976 954 1548 942 1455 1437 1419 a Observed frequencies are from ref. 12a and 12b except where noted. 6 Calculated values from force field using interaction constants (ref 12b). c Methyl torsional frequency from neutron diffraction (ref 13). d No observed values. Boyd / 2-Methylbutane and 2,3-Dimethylbutane
- 20. 5356 Guthrie and Huffman15 for S°(liquid). For 2,3-dimethylbu- tane they are based on the results of Waddington et al.16 for Cp°(gas) and AHnp° and those of Douslin and Huffman17 for S°(liquid). For comparison the calculated and experi- mental18 functions for -butane are also shown. Discussion From comparison of columns 7 and 8 of Table I, it is ap- parent that although there is not exact agreement, the con- formational energy minimization calculations reproduce reasonably well the features of conformer stabilities. It is of interest to emphasize why the concept of the number of gauche interactions determining stability fails. Since, in en- ergy minimization calculations, simultaneous adjustments of all of the internal coordinates of the molecule are made and the total energy is the sum of a large number of individ- ual energy functions, it is difficult to ascribe the overall re- sult to any given structural feature. However, simple quali- tative rationales can often be extracted from the details of the calculation. In the present examples, we point out the following. If the skeletal geometries all involved the same bond lengths and valence angles, and the torsional angles were at the exact 60, 180, 300° gauche, trans, gauche' values, the energy function method would be essentially equivalent to counting gauche methyl interactions. The lack of correlation with the latter is the result of relatively mod- est adjustments in the valence and torsional angles. In «- butane (see Figure 1), the methyl-methyl nonbonded inter- actions19 in the gauche conformation result in the minimum energy position of the skeletal torsional angle being dis- placed (in our calculation) from 60 to 66.0° and the valence angles (1, 2, 3 and 2, 3, 4) being increased over the trans to 113.3 from 111.9°. In 2-methylbutane this adjustment is
- 21. possible for the torsional angle and one of the valence an- gles (1, 2, 3) (valence angle 2, 3, 5 does not increase due to hindrance from methyl group 4) in the C form. The torsional angle adjustment is not possible in the sym- metrical Cs form (see Figure 2). Thus, it might be expected that the gauche-trans difference would be greater than in «-butane rather than less as is observed. However, in the Cs form an exceptionally large adjustment of the valence angle (1, 2, 3) results in an increase in the nonbonded distances and a reduction of the methyl—methyl repulsions between centers 1, 4 and 1, 5 to below that in the C¡ form. The large valence angle change appears to be possible because it alle- viates two simultaneous gauche interactions. Turning to 2,3-dimethylbutane, we see that in the C2h form no adjustment of the skeletal torsional angle as in gauche «-butane or Cj 2-methylbutane is possible. Further, any adjustment of a valence angle would be hindered by the other methyl substituent on the center carbon (i.e., presence of methyl group 6 hinders changes in angle 1, 2, 3, etc.). Thus, the Czh form is a relatively high-energy conformation for the number of gauche interactions it possesses. In con- trast, in the C2 form adjustment of the skeletal torsional angle reduces two methyl—methyl repulsions (1,4 and 5, 6) and increases one (1, 5). However, simultaneous adjust- ments of the valence angles 1, 2, 3 and 2, 3, 5 are effective in reducing the 1,5 repulsion. Just as in Cs 2-methylbutane, these valence angle adjustments are effective because each alleviates two gauche interactions. Thus, the overall effect of the lack of strain-relieving possibilities in the C2/, form and the presence of them in the C2 form results in the two forms being of nearly equal energy in spite of the greater number of gauche interactions in the latter. In discussing the thermodynamic functions, we will focus
- 22. our attention on the entropy, S°, and the heat capacity, Cp°, as they are more or less independently measured quantities. Table III. Calculated and Observed Thermodynamic Functions0 T - (G° - G0°)/r (H° - H0°)/T S° C 0LP 298.15 58.68 «-Butane6 15.41 74.10 23.36 58.44 15.42 73.86 23.76 58.54 15.58 74.12 23.29 400.0 63.57 18.26 81.84 29.59 63.34 18.35 81.70 29.86 63.51 18.35 81.86 29.60 500.0 67.97 21.13 89.10 35.49 67.76 21.24 89.00 35.67 67.91 21.19 89.10 35.34 600.0 72.07 23.90 96.03 40.58 71.88 24.08 95.97 40.71 72.01 23.98 95.99 40.30 298.15 64.95 2-Methylbutanec 17.62 82.58 28.70 64.90 17.42 82.52 28.56 64.70 17.35 82.05 28.45 64.36 17.75 82.12 28.39 400.0 70.66 21.46 92.12 36.58 70.61 21.47 92.08 36.43 70.33 21.20 91.53 36.41
- 23. 70.07 21.49 91.56 36.49 500.0 75.88 25.21 101.10 43.77 75.84 25.02 101.07 43.81 75.50 24.97 100.47 43.64 75.28 25.24 100.51 43.71 600.0 80.81 28.81 109.63 49.90 80.77 28.83 109.61 49.93 80.39 28.59 108.98 49.79 80.21 28.83 109.05 49.89 298.15 67.13 2,3-Dimethylbutanetf 20.56 87.70 34.11 67.48 20.25 87.74 34.01 67.58 19.84 87.42 33.59 400.0 73.80 25.25 99.05 43.55 74.08 25.00 99.08 43.51 74.06 24.58 98.64 43.30 500.0 79.93 29.79 109.72 52.01 80.15 29.58 109.54 51.99 80.04 29.22 109.26 51.94 600.0 85.74 34.12 119.87 59.26 85.93 33.95 119.88 59.05 85.77 33.61 119.38 59.23 0 All units are cal/°K/mol. At each temperature the values are calculated for the experimental and the calculated energy differences between conformers (see Table I columns 7 and 8). For 2- methyl-
- 24. butane, the value AH = °° is also included. The values of AH used are indicated at the 298°K entries. 6 At each temperature row one is at AH = 730, row two is at Ah = 966, and row three is the ob- served values. c At each temperature row one is at AH = 640, row two is at AH = 809, row three is at AH= ==, and row four is the observed values. d At each temperature row one is at AH = 250, row two is at AH = 54, and row three is the observed values. The entropy, S°, is derived from integrated condensed phase heat capacities down to low temperatures and heats of vaporization. The vapor heat capacity Cp° is indepen- dently measured. The entropy tends to be sensitive to.both the vibrational frequencies and the population of confor- mers while Cp° is sensitive to vibrational frequencies but somewhat less sensitive to conformer population. Scott et al.5 estimate the uncertainty interval of their vapor-phase Cp° values for 2-methylbutane at ~0.3%, so an overall reliability of 0.1-0.2 cal/°K/mol is probably rea- sonable. For the liquid entropies, the uncertainties for 2- methylbutane and 2,3-dimethylbutane were estimated at ±0.1 and ±0.14 cal/°K/mol, respectively, by the investiga- tors.15·17 The overall uncertainty of the ideal gas entropies is likely to be of the order of 0.2-0.3 cal/°K/mol. Thus, it is seen in Table III that good agreement is obtained between calculated and observed values of S'0 and Cp° for «-butane for both values of AH used. For 2-methylbutane the agree- Journal of the American Chemical Society / 97:19 j September 17, 1975
- 25. ment is good for Cp° for all three of the AH values calculat- ed. For S° the agreement is certainly better for AH = =° in accord with Scott et al.5 However, conversely we are not prepared to say that the discrepancy of 0.5 cal/°K/mol for AH = 600-800 cal/mol is significant in the light of experi- mental uncertainties and uncertainties in the calculated values. For 2,3-dimethylbutane the situation is similar, the Cp° values are in good agreement, and the calculated en- tropies are a bit high but probably not significantly so in view of the uncertainties. In summary, it appears that the stabilities of the confor- mers of 2-methylbutane and 2,3-dimethylbutane are consis- tent with conformational energy calculations and have a simple qualitative explanation in terms of valence and tor- sional angle adjustments. Further, the stabilities are in rea- sonable accord with the thermodynamic functions. Acknowledgment. The author is indebted to the U.S. Army Research Office (Durham) for financial support of this work. References and Notes (1) G. J. Szasz, N. Sheppard, and D. H. Rank, J. Chem. Phys., 16, 704 (1948). (2) K. S. Pitzer, J. Chem. Phys., 6, 711 (1940). (3) N. Sheppard and G. J. Szasz, J. Chem. Phys., 17, 86 (1949). (4) G. J. Szasz and N. Sheppard, J. Chem. Phys., 17, 93 (1949). 5357 (5) D. W. Scott, J. P. McCullough, K. D. Williamson, and G.
- 26. Waddlngton, J. Am. Chem. Soc., 73, 1707 (1951). (6) N. L. Allinger, J. A. Hlrsch, . A. Miller, I. Tyminski, and F. A. Van- Catledge, J. Am. Chem. Soc., 90, 1199 (1968). (7) A. L. Verma, W. F. Murphy, and H. J. Bernstein, J. Chem. Phys., 60, 1540(1974). (8) R. H. Boyd, J. Chem. Phys., 49, 2574 (1968). (9) R. H. Boyd, S. M. Breitling, and M. Mansfield, AlChE J., 19, 1016 (1973). (10) S. J. Chang, D. McNally, S. Shary-Tehrany, M. J. Hickey, and R. H. Boyd, J. Am. Chem. Soc., 92, 3109 (1970). (11) K. B. Wiberg and R. H. Boyd, J. Am. Chem. Soc., 94, 8426 (1972). (12) (a) R. G. Snyder and J. H. Schachtschneider, Spectrochim. Acta, 21, 169 (1965); (b) J. H. Schachtschneider and R. G. Snyder, ibid., 19, 117 (1963). (13) D. M. Grant, R. J. Pugmire, R. C. Livingston, K. A. Strong, H. L. McMurry, and R. M. Brugger, J. Chem. Phys., 52, 4424 (1970). (14) K. S. Pitzer, "Quantum Chemistry", Prentice-Hall, New York, N.Y., 1952, p 492.
- 27. (15) G. B. Guthrie and . M. Huffman, J. Am, Chem. Soc., 65, 1139 (1943). (16) G. Waddlngton, J. C. Smith, D. W. Scott, and . M. Huffman, J. Am. Chem. Soc., 71, 3902 (1949). (17) D. R. Douslin and . M. Huffman, J. Am. Chem. Soc., 68, 1704 (1946). (18) F. D. Rossini, “Selected Values of Physical and Thermodynamic Proper- ties of Hydrocarbons and Related Compounds", Carnegie Press, Pitts- burgh, Pa., 1953. (19) D. H. Wertz and N. L. Allinger have recently (Tetrahedron, 30, 1579 (1974)) proposed that gauche H—H nonbonded Interactions play a domi- nant role In the structure of conformational Isomers. In our parameteri- zation, at least, they play a relatively minor role. In gauche- vs. trans-n- butane for example, we find methyl—methyl nonbonded Interactions contribute 0.50 kcal/mol to the gauche-trans energy difference with other contributions to the total difference of 0.66 kcal/mol from the fol- lowing sources of Me— —0.30, H—H 0.16, torsional angle distortion 0.11, valence angle distortion 0.21, bond length distortion 0.03, and non-bonded Interaction differences on the same side of the center C-C bond —0.05. It also seems clear that most of the torsional and
- 28. valence angle distortional energies are due to the methyl—methyl repulsions. A Study on the Interaction of Eu2+(aq) with Pyridinecarboxylic Acids E. Vrachnou-Astra1 a and D. Katakis*lb Contribution from N.R.C. “Demokritos", Aghia Paraskevi Attikis, Athens, Greece, and Laboratory of Inorganic Chemistry, University of Athens, Athens, Greece. Received September 9, 1974 Abstract: Europous ion forms with isonicotinic, /V- methylisonicotinic, nicotinic, and picolinic acids one to one complexes hav- ing several features, which are rather unusual for a lanthanide ion. They are formed in strongly acidic aqueous solutions and have absorption maxima around 420 nm. The formation constants are 0.15 1. mol-1 for nicotinic acid, 0.2 1. mol-1 for picol- inic acid, 1.9 1. mol-1 for isonicotinic acid, and 0.4 1. mol-1 for /V-methylisonicotinic acid, respectively. Evidence is presented that the complexes involve charge transfer from the metal ion to the ligand. The complexes of nicotinic and picolinic acids are stable toward further redox reaction. The complexes of isonicotinic acid and its /V-methyl derivative, however, undergo further reduction leading in the first case to isonicotinaldehyde and in the second very likely to the dihydro derivative. In the presence of Eu3+(aq) the kinetics of the redox reaction of isonicotinic acid and its /V-methyl derivative are second order in europous ion, first order in the organic acid, first order in hydrogen ion, and inverse first order in Eu3+(aq). A unified mech-
- 29. anism is proposed to explain the results for both of these acids, which is also consistent with the results obtained on complex formation and with the postulate of a charge transfer from europous ion to the ligand. The mechanism of electron transfer through reducible organic ligands is related to the mechanism of transfer to such ligands. It must be recalled that even when these lig- ands are bound, the electron is very likely first transferred to them, before finding its way to the central ion.2 If the ligands are bound, the presence of the central metal ion makes it impossible to detect and study some im- portant details of the electron transfer process. In the reac- tions of free ligands3 with low valent metal ions some of these “missing aspects” become more pronounced and can be studied by conventional techniques. Focusing attention on substituted pyridine ligands, it is worth mentioning the following two such aspects, (i) In studies of electron trans- fer through substituted pyridine ligands4 the electron may “reside” for a while on the ligand. The intermediate radi- cal-complex is, however, difficult to detect. In the corre- sponding reactions of free ligands5 complex formation and subsequent reaction are time-resolved, and the course of the reaction from the precursor complex to the products can be explored more effectively, (ii) Kinetically, the reactions be- tween substituted pyridine complexes and reducing metal ions are generally quite simple. The ligand, whether bound4 or free6 essentially acts as a catalyst. The differences in the overall chemistry caused by changes of the substituents on pyridine are rather trivial. In the corresponding free ligand reactions the products Vrachnou-Astra, Katakis / Interaction of Eu2+(aq) with
- 30. Pyridinecarboxylic Acids scale factors were obtained before and after each experi- ment from separate audio side band spectra which were derived from Hi and located within several hertz of the original satellites. In each case, the before and after scale factors agreed to less than 0.001 Hz/cm. For all seven temperature experiments described above, the average scale factor never varied by more than 0.02 Hz/cm, and most values were within 0.01 Hz/cm of the average, 0.99 Hz/cm. In the remaining temperature experiments, an audio side band, generated by a frequency of 8.6-9.2 Hz, was produced from one transition of the satellite doublet, and measured with respect to the remaining transition about 1.5 Hz away. At any temperature, a maximum expected error of 0.02 Hz/cm in the above average scale factor (0.99 Hz/cm) would introduce a maximum total scaling error of 0.03 Hz in Jcc but for most cases, the scaling error is thought to be less than 0.01 Hz. Nmr data for 3 are shown in Table III. Experimental Section 2.3- Dideuterio-l,3-butadiene (2). 2,3-Dideuterio-2,3-butanediol was prepared by reduction of biacetyl with lithium aluminum deuteride according to the procedure of Loewus, Westheimer, and Vennesland.32 The crude 2,3-dideuterio-2,3-butanediol was dis- tilled through a Vigreux column under vacuum, and the major frac- tion was collected at 89-92° (21 mm) (reported 95-105° (40
- 31. mm)). 2.3- Dideuterio-2,3-butanediol was acetylated in the usual man- ner33 using an excess of acetic anhydride and pyridine. The crude product was distilled through a Vigreux column, and the major (32) F. A. Loewus, F. H. Westheimer, and B. Vennesland, J. Amer. Chem. Soc., 75, 5018 (1953). (33) L. F. Fieser and M. Fieser, “Reagents for Organic Synthesis," Wiley, New York, N. Y., 1967, p 958. 6375 fraction of 2,3-dideuterio-2,3-diacetoxybutane was collected at 94.0-94.5° (22 mm). 2,3-Dideuterio-2,3-diacetoxybutane (3 g) was added dropwise into a heated Vycor column containing Vycor chips under an atmosphere of N2 at 585°, using the procedure of Shlechter, Othmer, and Brand.34 The crude gaseous product was purified by passage through an ice-cooled trap, followed by a bubbler containing 10% aqueous sodium hydroxide solution and a second bubbler con- taining water. The wet gas was passed through a tube containing a weighed mixture of carbon disulfide and hexamethyldisilane. The nmr tube, which was immersed in a Dry Ice-acetone bath, was evacuated and sealed under vacuum. The mixture was found to be 8.3% (w/w) 2,3-dideuterio-1,3-butadiene (2) and 4.6% hexa- methyldisilane in carbon disulfide solvent.
- 32. 1,1,4,4-Tetradeuterio-l,3-butadiene (3). 2,2,5,5-Tetradeuterio- 2,5-dihydrothiophene 1,1-dioxide was prepared from sulfolene by alkaline deuterium exchange according to the method of Cope, Berchtold, and Ross.35 Eight exchanges yielded 99.3% isotopic purity (by nmr integration). Recrystallization from 2:1 THF- pentane gave a mp 63-65° (reported mp 66.8-67.3°). The above dihydrothiophene 1,1-dioxide (5 g) was pyrolyzed at 130° to generate 3 at a convenient rate. Gaseous 3 was bubbled through two traps, each containing about 100 ml of 10% aqueous sodium hydroxide solution to remove the sulfur dioxide by- product formed in the reaction. The purified 3 was passed through a tube containing Drierite, and into two preconstricted tared nmr tubes containing known weights of hexamethyldisilane. The nmr tubes were immersed in Dry Ice-acetone contained in a dewar flask. In order to minimize boiling of 3 during high temperature experi- ments, one of these filled nmr tubes was sealed under nitrogen at atmospheric pressure. The second nmr tube, sealed under vacuum, was used for the remaining variable-temperature study. Both samples contained 11 % (w/w) hexamethyldisilane in neat 3. Acknowledgment. The authors are grateful to the National Science Foundation for Grant No. GP- 3815 which provided support for this work. (34) N. Shlechter, D. F. Othmer, and R. Brand, Ind. Eng. Chem., 37, 905 (1945).
- 33. (35) A. C. Cope, G. A. Berchtold, and D. L. Ross, J. Amer. Chem. Soc., 83, 3859 (1961). Conformational Analysis of 2-Methylbutane1 Robert L. Lipnick and Edgar W. Garbisch, Jr.*2 Contribution from the Department of Chemistry, University of Minnesota. Minneapolis, Minnesota 55455. Received November 9, 1972 Abstract: The AB2 deuterium-decoupled pmr spectrum of 2- methylbutane-d9 (1) was determined at ten tempera- tures in the range —91 to +72°. The observed temperature dependences of the three nmr parameters (va, vs, and Jab) were ascribed to changes in conformer population with temperature (eq 1). These parameters were subse- quently used in a least-squares analysis to obtain quantitative estimates of AH and the intensive nmr parameters of conformers la and lb. The value of AH for the equilibrium la ^ lb is 888 ± 18 cal/mol ( 5 = —1.376 eu). The torsional angle, a, for la was estimated to fall between 60 and 72° from the calculated vicinal coupling con- stant. Rotational isomerism in 2-methylbutane has been . observed by Raman,3 infrared,4 ultrasonic,5 and thermodynamic6 methods, and estimates were made of (1) Presented in part by R. L. L. at the 23rd Congress of Pure and Applied Chemistry, Boston, Mass., July 1971. (2) Correspondence may be directed to E. W. G., Center for Applied
- 34. Research in Environmental Sciences, St. Michaels, Md. 21663. (3) G. J. Szasz and N. Sheppard, J. Chem. Phys., 17, 93 (1949). (4) J. K. Brown and N. Sheppard, J. Chem. Phys., 19, 976 (1951). (5) J. M. Young and A. A. Petrauskas, J. Chem. Phys., 25, 943 (1956). (6) D. W. Scott, J. P. McCullough, K. D. Williamson, and G. Wad- dington, J. Amer. Chem. Soc., 73, 1707 (1951). both the enthalpy difference between the two possible conformers and their barrier to interconversion. Szasz and Sheppard concluded from Raman3 that the enthalpy difference for the equilibrium la lb was Lipnick, Garbisch / Conformational Analysis of 2-Methylbutane D ow nl oa de d vi a L A
- 39. he d ar ti cl es . 6376 Figure 1. The 60-Mc/sec nmr spectra of 1 at (a) 35.5° with deu- terium decoupling, (b) 35.5° without deuterium decoupling, and (c) the calculated theoretical spectrum using the spectral parameters obtained from laocoon3 at 35.5°. either less than 200 cal/mol or greater than 1000 cal/mol. Brown and Sheppard4 drew no quantitative conclu- sions from their infrared study. Scott and coworkers6 concluded from their heat capacity measurements that the C, conformer, lb, is at least several thousand cal/ mol less stable than la, the C, conformer. More re- cently, Au-Chin,7 using theoretical considerations, has estimated AH for la lb as 1.33 kcal/mol. This work attempts to confirm through variable- temperature nmr that la is the more stable conformer in the equilibrium la lb and to determine more pre- cisely the enthalpy difference between la and lb. In addition, the derived vicinal coupling constants will be used to estimate the torsional angle, a, for the Cj con-
- 40. former. Results and Discussion Under conditions of deuterium decoupling, 2-methyl- butane-t/g (1) gives rise to eight nmr transitions, corre- sponding to a spectrum of the type AB2.8 Initial values of va, vb, and Jab were obtained from eq 1-3,9 where were subsequently inputed into iterative laocoon310 calculations along with the corresponding experimental frequencies of all eight transitions to obtain best least- squares values of vK, vB, and JAb. Figure 1 shows un- decoupled and deuterium-decoupled spectra of 1 along with a laocoon3 computed spectrum. These laocoon3 derived parameters were used in- dependently to determine the best solution values to eq 411,1 s where Paj and PbJ are the y'th of / intensive param- eters of conformers la and lb, and Ptf is the y'th of / observed parameters at the /th of k temperatures, <;. As solution of eq 4 varying all of the unknowns, in- P,j - , = —AH AS Ptf - ¿V RTij + R (4) eluding AH and AS, was not achieved, it was found necessary to reduce the number of unknowns by one through assuming AS = —R In 2 (—1.376 eu), the statistical value corresponding to two enantiomeric Cs conformers.14 A number of requirements which must be satisfied for
- 41. the quantitative application of eq 4 to conformational analysis have been discussed critically.13 It is essential that P&j and Pb¡ both be temperature independent so that the observed temperature dependences, °, reflect only changes in conformer population. We use as an operational criterion of this condition, the self-consis- tency of the independent eq 4 solution values of AH provided by the respective nmr parameters and the chemical shift difference, . These solution values of AH obtained in the single parameter calculations are presented in Table I (solutions 1-4). They are seen to fall within the probable errors of one another, and therefore meet our operational criterion for the temper- ature independence of the respective intensive param- eters. Therefore, it is felt justified to use as the most reliable solution of eq 4 these values obtained in a single combined parameter calculation of vA, vB, and Jab (solution 4). This multiple parameter calculation leads to an enthalpy difference AH - 888 ± 18 cal/mol at AS = —1.376 eu for the equilibrium la ^ lb. Figure 2 shows the theoretical temperature dependences of va, vb, and Jab corresponding to solution 5 (Table I) along with the experimental values of these parameters. The derived vicinal coupling constants for conformers la and lb obtained in solution 5 of Table I allow us to estimate the torsional angle, a, for the Ct conformer la, using the theoretical relationship15 between dihedral angle, , and vicinal coupling, J J = A(cos2 + n cos ) (5) In these calculations, the projected torsional angle, , in both la and lb is assumed to be 120°. Since the C,« VA = Vl (1)
- 42. VB = (v¡ + Vl)¡2 (2) Jab = Vs[(vs — ve) + (v4 — n)] (3) va and vB are the chemical shifts of HA and HB (relative to hexamethyldisilane), and Jab is the vicinal proton coupling across the 2,3 C-C bond. These initial values (7) T. Au-Chin, Sci. Sínica, 3, 279 (1954). (8) See J. Lee and L. H. Sutcliffe, Trans. Faraday Soc., 55, 880 (1959). (9) E. W. Garbisch, Jr„ J. Chem. Educ., 45, 402 (1968). (10) S. M. Castellano and A. A. Bothner-By in “Computer Programs for Chemistry,” Vol I, D. F. Detar, Ed., W. A. Benjamin, New York, N.Y., 1968, pp 10-39. (11) See ref 12 and references cited therein. (12) R. L. Lipnick and E. W. Garbisch, Jr., J. Amer. Chem. Soc., 95, 6370 (1973). (13) E. W. Garbisch, Jr., B. L. Hawkins, and K. D. MacKay in "Con- formational Analysis: Scope and Present Limitations,” E. Chiurdogu, Ed., Academic Press, New York, N. Y., 1971, pp 93-110. (14) The entropy of mixing is normally used to account for any entropy differences between conformers. See E. L. Eliel, N. L. Allinger, S. J. Angyal, and G. A. Morrison, “Conformational Analysis," Wiley.
- 43. New York, N. Y., 1965, pp 11-12. (15) M. Barfield and D. M. Grant, Advan. Magn. Resonance, 1, 149 (1965). Journal of the American Chemical Society j 95:19 / September 19, 1973 Table I. Solution Parameters" of Equation 1
- 45. 5 6377 < s I o .y V3 ~ intninviCvhmfNrNfN — —-intntn ooooooooooooooo ooooocdodddddod odd 4 4 4 333 odd 4 4 4 In <N (N 4
- 46. o o o 4 4 4 ON ON (N M fN rf O O O 4 4 4 o o o 4 4 4 o o o 4 4 4 33 3 odd 4 4 4 ddo 4 4 4
- 47. o o o 4 4 4 o o o 4 4 4 o o o 4 4 4 o — — odd 4 4 4 — — fN r- r- - o 4 4 4 o o o
- 48. odd 4 4 4 ’two MMfnrt’t’t00'£>-<fSnooww Csir4CNiNfN<N<NrN(NN0NDNC—> — —< -H-H+I-H-H-FI-H-H-H-H-H-H-H-H-H •nmr-O'P-'—NOrfr-OOONDOOOCNONNommoooocintNp- infNrNocxO P-r-P-ON^C0000000OOOON0000 r-r-r-r-p-t-r-r-r-r-r-r-r-r-t— wnoownwwwoowfiwwfbw o*-»—o — — O’— — o—'--o — «— efl •8 s § cd cd
- 49. Q. I c u o e 8 -d e e'd- £ S' c 'o S .| _> o "cb ,3 O M .8 S gIs
- 50. cd t— cd ^ o ¡2 v c JJ = 25 s O Figure 2. The experimental temperature dependences of pa (0), pb (·), and Jab (A), along with their theoretical dependences (solid lines). The theoretical dependences (solid lines) were derived from the combined parameter solution of eq 5 (solution 5 of Table I). conformer (lb) is symmetric, the derived coupling 16 is given by eq 6. For the C¿ conformer (la), the Jb = 3.52 Hz = A(cos2 60° + n cos 60°) (6)
- 51. corresponding coupling is given by eq 7,17 where a is = 7.06 Hz = -"-4--· = A(COS2 a + « COS a) + A(cos2 ( + a) + « COS ( + a)) 2 (7) the torsional angle between the two gauche related methyl groups. Application of eq 5 to the experi- mental vicinal couplings for the series ethane, propane, and isobutane allows an estimate to be made of the value for A for a series of hydrocarbons obtained by increasing methyl substitution of an ethane skeleton. For ethane, propane, and isobutane, the experimental vicinal coupling, JviCinai, is given by eq 8, where 0g = _ 2/e + _ «'vicinal ^
- 52. 2^(cos2 + n cos 0g) + /4(cos2 4 + n cos 4) 1 (8) 60° and = 180°. Simplification of eq 8 leads to eq (16) Ja and Jb refer here to the vicinal interproton couplings across the 2,3 C-C bond for conformers la and lb, respectively. (17) Je and Jt refer to the gauche and trans vicinal interproton cou- plings across the 2,3 C-C bond for conformer la. Lipnick, Garbisch / Conformational Analysis of 2-Methylbutane 6378 N Figure 3. The dependence of A (eq 10) as a function of the number of methyl groups substituted on ethane for ethane (a), propane
- 53. (b), isobutane (c), cyclohexane (d), and butane (e). The triangles (f) indicate values of A for 2-methylbutane corresponding to a = 60, 66, and 72°. 9. In Figure 3, A is plotted as a function of the number A 3Jvicinal/1 *50 ^Aioinal (9) of methyl substitutions, N, for the series ethane,18 propane,19 isobutane,20 butane,21 and cyclohexane.22 The qualitative decrease in A with increasing substitu- tion probably limits A to a value no greater than 13.6 Hz, the largest such coefficient obtained for a disub- stituted ethane. This value of A is found to corre- spond to = 0.02 and = 72° upon simultaneous solu- tion of eq 6 and 7. The lower limiting value for is 60° ( = 0.10, A = 11.7 Hz), corresponding to no in- crease in the normal sp3-sp3 torsional angle. The gauche conformer of «-butane (A = 12.56, = 0.11), a similar system with one gauche methyl-methyl inter- action, has been found to be skewed 66°.21·23 The gauche butane value for the torsional angle, which is probably the best empirical estimate for a, falls be- tween the lower and upper limits (60-72°) obtained
- 54. above. It is of interest to compare the enthalpy change la lb (AH = +888 ± 18 cal/mol) with that found for the comparable butane equilibrium 2a +; 2b (AH = ch3 h 2a 2b +681 ± 35 cal/mol).21 In both equilibria, conformer a is the energetically more favorable form due to an additional methyl-methyl interaction present in b. For gauche butane (2b), this steric interaction is par- tially relieved by an increase in the torsional angle. The Cs conformer of 2-methylbutane, lb, contains two symmetrical methyl-methyl interactions, and cannot undergo torsional deformation. If the additional enthalpy change for la lb over 2a ;=± 2b of 207 cal/ mol is due to unrelieved methyl-methyl interactions, (18) R. M. Lynden-Bell and N. Sheppard, Proc. Roy. Soc., Ser. A, 269, 385 (1962). (19) D. R. Whitman, L. Onsager, M. Saunders, and . E. Dubb,
- 55. J. Chem. Phys., 32, 67 (1960). (20) J. S. Waugh and F. W. Dobbs, J. Chem. Phys., 31, 1235 (1959). (21) P. B. Woller and E. W. Garbisch, Jr., J. Amer. Chem. Soc., 94, 5310 (1972). (22) E. W. Garbisch, Jr., and M. G. Griffith, J. Amer. Chem. Soc., 90, (6543 1968). (23) K. Kuchitsu, Bull. Chem. Soc. Jap., 32, 748 (1959). then each such interaction is equivalent to an increase in enthalpy of approximately 104 cal/mol. This anal- ysis would predict an enthalpy difference of approxi- mately 785 cal/mol (681 + 104) for the equilibrium 3a =5 3b of 2,3-dimethylbutane. This estimate is in qualitative agreement with the value of 0.95 kcal/mol,24 obtained by ultrasonic absorption, in which the ex- pected tolerance is approximately ± 400 cal/mol.25 Nmr Spectral Determinations. High resolution deu-
- 56. terium-decoupled nmr spectra were taken on a modified Varían A-60 nmr spectrometer, as described pre- viously.12 Spectra were obtained from a neat sample of 2-methylbutane-<f9 containing ~10% (v/v) hexa- methyldisilane, and sealed under vacuum. Spectra were determined at ten temperatures from —91 to +72°, and 12-22 spectra were recorded at each temper- ature. Frequencies for each transition were calculated from the center at half-height of each peak from audio side band calibration. Scale factor corrections ranged from 0.984 to 0.991 Hz/cm. Average values and the corresponding standard deviations were calculated for each transition and any frequency values whose devia- tions were greater than twice the standard deviation for that transition were automatically discarded. This process was repeated automatically until experimental values were no longer discarded. Initial values for ¡ , vb, and As which were obtained from eq 1-3 were used as input for least-squares lao- coon3 calculations. For each temperature, any transi- tion whose average experimental frequency differed from the corresponding calculated value by more than twice the laocoon3 calculated standard deviation was discarded, and allowed to vary in a second iterative
- 57. calculation. Table II shows the final results for ten temperatures. Table II. Temperature Dependences of the Pmr Parameters for 1 Temp“ VAb -7abc 6abc 71 .7 82.321 (0.004)“ 68.796 (0.004)“ 6.623 (0.004)“ 13. 525 51. 3 82.056 (0.007) 68.605 (0.007) 6.662 (0.007) 13 .451 30. 8 81.717 (0.010) 68.381 (0.009) 6.716 (0.009) 13 336 19 7 81.563 (0.007) 68.258 (0.006) 6.739 (0.006) 13 .305 -4. 3 81.180 (0.015) 67.994 (0.013) 6.760 (0.013) 13 .186 -20. 5 80.933 (0.004) 67.792 (0.004) 6.779 (0.004) 13. 141 -41 .6 80.593 (0.019) 67.575 (0.019) 6.792 (0.017) 13 .018 -61 .7 80.227 (0.005) 67.283 (0.005) 6.855 (0.005) 12 .944 -80 .6 79.866 (0.010) 67.029 (0.010) 6.912 (0.009) 12. 837 -91 2 79.703 (0.015) 66.900 (0.015) 6.923 (0.013) 12. 803 “In °C; accurate to ±1°. 6 Downfield from HMDS in Hz. c In Hz. d Values in parentheses are standard deviations. Experimental Section 2-Methylbutane-+ was prepared in three steps according to
- 58. Scheme I. (24) J. H. Chen and A. A. Petrauskas, J. Chem. Phys., 30, 304 (1959). (25) E. Wyn-Jones and R. A. Pethrick, Top. Stereochem., 5, 240 (1970). Journal of the American Chemical Society j 95:19 / September 19, 1973 6379 Scheme I CD3MgI-Et20 Cl Cl OH CD:i A CD3 CD,
- 59. 4 5 jTsCl/Py CD, OTs CD, aX LiAlH4-THF / CD;, CD, CD; CD. 2-Methyl-3-butanoW9 (5). 2-Methyl-3-butanol-rfs (5) was pre- pared using a procedure similar to that reported by Huston, Jack- son, and Spero26 for the undeuterated compound. The apparatus, which consisted of a 500-ml three-necked flask fitted with a Hof- mann condenser, dropping funnel, nitrogen intake, and drying tubes, was dried in an oven for several hours, and flushed with dry nitrogen after assembly. Reagent grade magnesium turnings, 5.20 g (0.214 mol), and a small quantity of methyl-rf3 iodide (Stohler,
- 60. 99.5% D) were added. The mixture was stirred vigorously and the remaining methyl-^ iodide (30 g total or 0.211 mol), dissolved in 100 ml of anhydrous ether, was added dropwise over a 1.5-hr period. Following the addition, the mixture was stirred for an additional 0.5 hr. Chloroacetyl chloride, 5.96 g (0.0527 mol), was dissolved in 100 ml of anhydrous ether, and added dropwise to the Grignard over a 1-hr interval so as to maintain a mild reflux. The ether was removed by distillation and the residue heated for 2 days at 95-100°. The tarry residue was hydrolyzed by addition of ice, 100 ml of ether, and concentrated hydrochloric acid until the mixture was just acidic. The aqueous phase was extracted ten times with about 300 ml of ether, and the ether was dried over anhydrous potassium carbonate and sodium sulfate, and filtered. The filtrate was dis- tilled slowly through a vacuum-jacketed Vigreux column. Several
- 61. fractions were collected and analyzed by glc. The final two frac- tions (2.80 g, 55% theory), bp 94-112° (lit. bp 112° (734 mm)), were suitable for the next reaction. The undecoupled nmr spectrum of (26) R. C. Huston, R. I. Jackson, and G. B. Spero, J. Amer. Chem. Soc., 63, 1459 (1941). 5 exhibits three broad signals at 1.6 (C-H ß to OH), 2.1 (C-H a to OH), and 3.5 (OH), with the expected integration ratio 1:1:1. Methyl-3-butanol-c/g Tosylate (6). To a stirred solution of 2.35 g (0.0242 mol) of 5 in 20 ml of dry reagent grade pyridine which was cooled in an ice bath was added dropwise a solution of 9.25 g (0.0484 mol) of p-toluenesulfonyl chloride in 20 ml of pyridine. Pyridinium chloride crystallized out after about 15 min. The reac- tion mixture was sealed in a flask and left for 2 days at 7°. After this time, the mixture was poured over ice and concentrated hydro- chloric acid added until the resultant mixture was distinctly
- 62. acid. The product was extracted three times with ether, and the combined ether extracts were washed with 5% hydrochloric acid and water and then dried over a mixture of anhydrous potassium carbonate and sodium sulfate. After filtration, the ether was removed on a rotary evaporator, and the residue was dissolved in pentane. The pentane was distilled and the process was repeated until no water droplets were observed in the distillate. The dry tosylate (6) was recrystallized three times from pentane, yield 5.36 g (88.5%), mp 20—21 °. The undecoupled nmr spectrum of 6 exhibits an AB quartet centered at 7.6 (aromatic), a broad doublet at 4.5 (H a to -OTs), a singlet at 2.4 (aromatic methyl), and a múltiple! at 1.8 ( ß to -OTs), with the expected integration ratio 4:1; 3:1. 2-Methylbutane-ífg (1). Reagent grade tetrahydrofuran (30 ml) was distilled from lithium aluminum hydride into a dry three- necked 100-ml flask. The flask was fitted with a condenser and a pressure-equalizing dropping funnel with an intake for dry nitro-
- 63. gen. Lithium aluminum hydride, 2.0 g (0.052 mol), was added slowly through a powder funnel. The stirred mixture was heated in an oil bath at 65-70°, and 3.0 g (0.012 mol) of three times re- crystallized 5 dissolved in 20 ml of dried tetrahydrofuran was added dropwise. The vaporized hydrocarbon, 1, was conducted through a micro purification train connected to the generating apparatus, consisting of bromine water (to remove 2-methyl-2-butene which was previously detected by glpc), sodium thiosulfate solution, and two ethylene glycol bubblers (to remove tetrahydrofuran solvent), and a tube of Drierite. Purified 1 was conducted finally through a finely drawn polyethylene tube into a constricted nmr tube im- mersed in a Dry Ice-2-propanol bath. A previous undeuterated sample, prepared and purified in the same way, was found by glpc to be pure. Acknowledgment. The authors are grateful to the National Science Foundation for Grant No. GP-3815 which provided support for this work. Stereochemical Control of Reductions. III. An
- 64. Approach to Group Haptophilicities1 Hugh W. Thompson* and Richard E. Naipawer2 Contribution from the Department of Chemistry, Rutgers University, Newark, New Jersey 07102. Received January 15, 1973 Abstract: The tetrahydrofluorene system 1, angularly substituted with a series of functional groups R, has been catalytically hydrogenated over a palladium catalyst. For each functional group the percentage of cis isomer in the product is taken as a measure of that group’s tendency, termed haptophilicity, to be bound to the catalyst sur- face during olefin reduction and thereby to enforce addition of hydrogen from its own side of the molecule. The nature of haptophilic activity and its correlation with various measures of group electronic characteristics and size are discussed. Since the work of Linstead on the reduction of phen- anthrenes,3 many of the stereochemical aspects of heterogeneous catalytic hydrogenation have been
- 65. (1) (a) Abstracted in part from the Ph.D. Thesis of R. E. N. (b) Part II: H. W. Thompson and R. E. Naipawer, J. Org. Chem., 37, 1307 (1972). (2) NASA Predoctoral Trainee, 1966-1967. (3) R. P. Linstead, W. E. Doering, S. B. Davis, P. Levene, and R. R. Whetstone, J, Amer. Chem. Soc., 64, 1985 (1942), and following articles. made comprehensible in terms of the approach, fit, and binding of the reducible molecule to the surface of the catalyst.4 These concepts have been applied with particular success to molecules whose geometry or substituents present severe steric hindrance to this (4) (a) R. L. Burwell, Jr„ Chem. Rev., 57, 895 (1957); (b) S. Siegel, Advan. Catal. Relat. Subj., 16, 123 (1966). Thompson, Naipawer / An Approach to Group Haptophilicities
- 66. Calculating the Distribution of Butane Conformations at a Particular Temperature Assume that we have an equilibrium mixture of the gauche and anti conformations at 25°C (298 K). gauche⇋anti K= [anti ] [gauche] To calculate the value of K, we will use the following equation. K=e RT ∆G will be calculated using ∆G=∆H-T∆S ∆H is the difference in potential energy between the anti and
- 67. gauche conformations. At 25˚C, this value is -3.8 kJ/mol. While it might appear that there is no entropy change in this process, ∆S is not equal to zero. There are two possible gauche conformations with the same potential energy, while there is only one possible anti conformation. Thus there exists more possible microstates for the gauche conformation than for the anti. To calculate the value of ∆S, we will use the following equation. ∆S=RlnWanti-RlnWgauche R is the gas constant (8.31 J/mol K) W is the number of possible microstates for each conformation Thus for butane: ∆S=Rln1 – Rln2 =0-(8.31 J/mol K x ln2) =5.76 J/mol K Now back to ∆G
- 68. ∆G = -3.8x10³ J/mol K – (298K x -5.76 J/mol K) =-2100 J/mol Returning to the calculation of K K=e 2100J /mol 8.31J /mol K×298K K=2.3 To calculate the percent anti conformation present at 298K, we recall that the value of K is this process is essentially the ratio of anti:gauche Thus, since the ratio is 2.3:1.0, the percentage can be calculated as follows. 2.3 ×100 = 70% (anti)
- 69. CHEM 12A—Trego Computational Chemistry Formal Report Additional Guidelines General Formal Report Guidelines • See the general guidelines document • Note that the general guidelines are more geared towards a “wet experiment” but all the components described in the general guidelines should be part of your report. Abstract • Provide a synopsis of what you did and what you discovered. You have collected a lot of data and
- 70. should not report all of it in the abstract, but you should report major findings. The abstract should not exceed one paragraph. Introduction • The introduction should focus on background material. Do not discuss your results or explain how you performed the experiment. • You should discuss what is meant by conformational analysis and how conformational preferences is determined. o How are conformational preferences determined experimentally? What techniques are used? o How are conformational energies calculated (other than from computational chemistry methods) o Why is conformational analysis important (for example: possible applications to biochemistry)? o What structural factors influence conformational preference? o Butane is considered a prototype molecule for understanding conformational analysis. You should discuss what we know about butane in terms of conformational preference and how this
- 71. data is used to predict conformational equilibria for other structures. Results • Prepare a table organized by the conformations modeled for each compound. Provide the energy of the conformation (kJ/mol) determined by ab initio calculation, and the total strain energy calculated using values from Klein. In a separate column of the table, give the difference in energy between the higher and lower energy conformations. As well, when reporting the energy of the eclipsed conformations report the difference in energy between the lower energy staggered conformation and the eclipsed conformation. Use Newman projections in the table to identify the conformations. Example: E (HF) ∆E Strain E (Klein) ∆E
- 72. H H CH3 CH3 HH 4.131×10⁵ kJ/mol 3.68 kJ/mol 3.8 kJ/mol 3.8 kJ/mol • Calculate the percent distribution of each conformer (see handout) based on your ab initio computational data and report these results in a separate table. • Prepare a table that shows the following data from your HF calculations for each compound.
- 73. o For each staggered conformation of 2-methylbutane -C2-C5 bond angle -C3-C4 bond angle -C4 dihedral angle -C3 bond length o For each staggered conformation of 2,3-dimethylbutane -C2-C5 bond angle -C3 bond length -C6 dihedral angle, C1-C4 dihedral angle and C5-C4 dihedral angle o For the eclipsed conformations, report the C2-C3 bond lengths Discussion • Discuss the results of your calculations. Discuss each
- 74. compound separately. o Which conformer is more stable? o Discuss any findings that deviate from expectations (such as deviations from ideal bond angles, lengths, and dihedral angles) • Compare your ab initio calculations to the simple calculations using strain energy values from Klein. • Compare your results to any literature experimental results you were able to find (in addition to the papers shared in canvas, you might consult the CRC handbook for bond angles and lengths). Experimental • Describe the method used for your ab initio calculations Citations • You should refer to the papers and textbook entry uploaded to Canvas. Perhaps start by reading the entry from more advanced textbook, then attempt to read the journal articles.
- 75. • The papers are challenging to read (and understand), but attempt to find the results so that you can use them as a point of comparison in your discussion. Questions • There are no additional questions for this report 1 2 3 4 5 1 2 3 4 5
- 77. CHEM 12A—Trego Formal Lab Report Guidelines The formal lab report should be similar to the format used in the chemical literature. Your report should have the following components/sections in the order shown below: • A Cover Page with the following information: o Title o Names of Authors o Name of Institution where the work was performed o Date of Submission • Abstract • Introduction • Results and Discussion • Experimental Section • References (sources cited) • Supporting Documents (attachments)
- 78. • Responses to assigned questions (separate page attached at the end of the report) Title, Authors, etc. Example: The Isomerization of (-)-Borneol to (-)-Isoborenol by an Oxidation-Reduction Scheme William E. Trego Chemistry, Physics and Astronomy Department, Laney College, Oakland, CA Submitted: February 12, 2014 Abstract—In 4-5 sentences (no more than a paragraph), describe the experiment and results. Keep procedural detail to a minimum—this is not the place to report significant quantities of data—but should report the major findings of the experiment. Example: The isomerization of borenol to isoborenol was
- 79. achieved in moderate overall yield by the oxidation of borenol to camphor and subsequent reduction to isoborneol. The sodium borohydride reduction of camphor proceeded with a moderately high diastereoselectivity. Introduction—Here is where you justify your work and provide pertinent background information. In a research paper, you would attempt to convince the reader that your research is novel and significant. You might describe how the product of your work is biologically or clinically important, or discuss how the product is expected to exhibit interesting physical/chemical properties. The product may have been particularly challenging to synthesize—so you might use the introduction to review past attempts to make the product, and speculate on why the synthesis of this product posed such a challenge. If you are reporting a new reaction, you will want to review similar reactions that already exist in the literature. If you are communicating new physical properties of an interesting molecule, you will want to convince your reader that this data is previously unreported. Results/Discussion—If your work involved synthesizing a product, you should show the reaction scheme
- 80. employed. You are strongly encouraged to use an organic chemistry drawing program.† You should discus the reactions used, yield(s) obtained and report any difficulties encountered. If you are reporting on a particular chemical reaction, you should propose a mechanism for the reaction. You should discuss how you verified the †ChemSketch is a free for download drawing program available on the following site: http://www.acdlabs.com/resources/freeware/chemsketch/ formation of the desired product through spectroscopy. Be specific—identify peaks observed in the various spectra. Correlate these signals to functional groups, protons, or carbon atoms in the product. You do not need to interpret every peak in each spectrum (especially for the infrared spectra). Again, you should not provide actual experimental procedure detail in this section—just report the results and provide commentary on your work. Experimental Section—For a synthetic organic chemistry research paper, the experimental section is generally
- 81. organized by the compounds synthesized. The synthesis of each compound receives an entry in the experimental section. The title of each procedure is the IUPAC name for the compound synthesized. If the research was centered on making measurements or carrying out a new spectral technique, you would describe the procedure employed. The melting point, chromatographic and spectral data are reported at the end of each entry for each compound. Chemical shifts, multiplicity and integral values (as number of hydrogen atoms) are reported for 1H NMR spectra. For 13C spectra, only the chemical shifts are reported. FTIR spectral data should be reported for all the diagnostic bands (in other words, bands >1500 cm-1 that can readily correlated to functional groups in the product). (1S,2S,4S)-1,7,7-trimethylbicyclo[2.2.1]heptan-2-ol (-)-Camphor (0.100 g, 0.648 mmol) was dissolved in 5 mL of anhydrous methanol at room temperature. NaBH4 (0.100 g, 2.64 mmol) was added slowly in four portions. The resulting mixture was heated to boiling, and then stirred for 2 minutes. After cooling to room temperature, 5 mL of ice water were added which resulted in the precipitation of a white solid. The solid was collected by vacuum filtration, dissolved in 5 mL of CH2Cl2
- 82. and dried over anhydrous Na2SO4. The supernatant was decanted from the Na2SO4, which was rinsed with an additional 2 mL of CH2Cl2. The combined solutions were concentrated on the rotary evaporator until a constant mass was attained. 75 mg (0.49 mmol, 74%) of a white solid were collected, mp = 212°C. 1H NMR (300 MHz, CDCl3) δ 3.6 (t, 1H), 1.75 (m, 3H), 1.5 (q, 1H), 1.10 (s, 3H), 0.81 (m, 3H), 0.80 (s, 3H), 0.75 (s, 3H) 13C NMR (100 MHz, CDCl3) δ 80, 50, 47, 45, 41, 37, 34, 20, 21, 15 FTIR (thin film) ν (cm-1) 3320, 2980, 2960, 2910, 2860 References You will want to cite outside resources in the introduction and results sections of your report. These resources might include your textbooks and papers in the chemical literature. While Wikipedia is generally a useful resource, it should not be cited as a reference in your report—it does not conform to the editorial/peer review standards that other resources meet. But…you might consider the references cited on the Wikipedia page. When citing a reference in your report, use a superscript number at the end of the sentence (outside the punctuation) that refers to a citation in the reference section. The entries in the reference section should
- 83. conform to the style shown below. Book Citation: 1Pavia, D.; Lampman, G.M.; Kriz, G.S. Introduction to Organic Laboratory Technique: A Microscale Approach, 3rd ed. Saunders:Philadelphia,, 1999; pp. 268-269. Journal Citation: 2Paquette, L.A.; Trego, W.E. Chem. Commun., 1996, 419-420 Supporting Documents: Attach any spectra recorded, chromatograms, and the copies from your lab notebook. Questions: Attach the responses to assigned questions on a separate page at the end of the report.