This document provides an overview of PINE, a Brazilian bank that specializes in corporate banking services. It discusses PINE's history, organizational structure, business strategy, products, and financial highlights. Some key points:
- PINE was founded in 1997 and focuses on providing credit, risk management, and investment banking services to mid-large Brazilian companies.
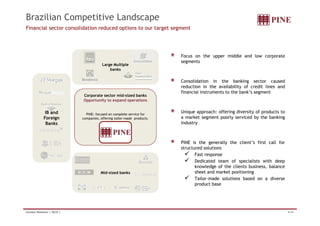
- It has a non-bureaucratic structure with origination teams in key business centers. Product lines include corporate credit, sales desk, investment banking, and distribution.
- PINE aims to establish long-term relationships by offering a diverse range of financial instruments and tailoring solutions to clients' needs.
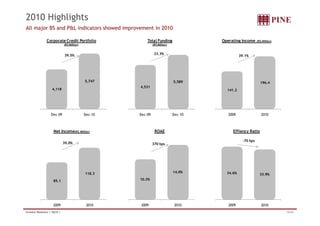
- In 2010, PINE