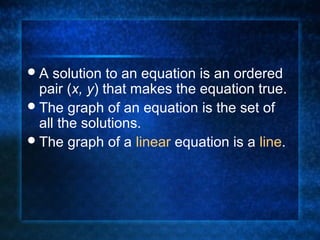
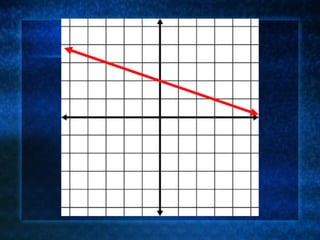
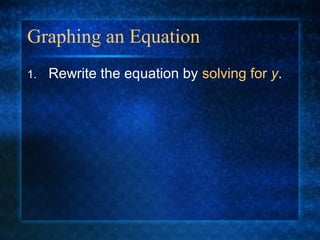
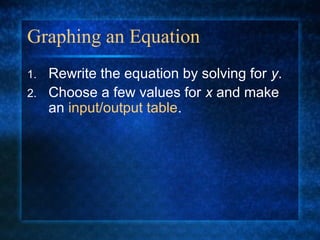
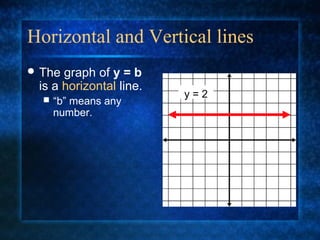
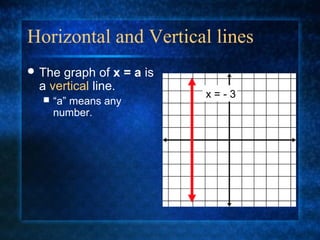
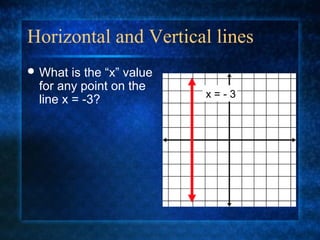
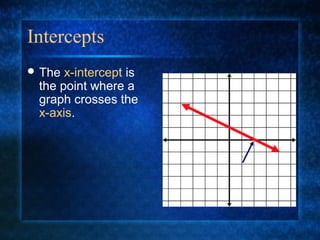
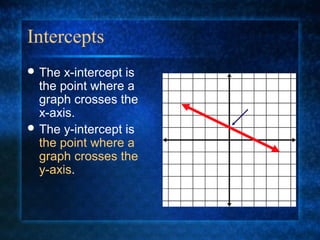
Graphing Linear Equations
4.2
p. 210
A solution to an equation is an ordered
pair (x, y) that makes the equation true.
A solution to an equation is an ordered
pair (x, y) that makes the equation true.
The graph of an equation is the set of
all the solutions.
A solution to an equation is an ordered
pair (x, y) that makes the equation true.
The graph of an equation is the set of
all the solutions.
The graph of a linear equation is a line.
Graphing an Equation
1. Rewrite the equation by solving for y.
Graphing an Equation
1. Rewrite the equation by solving for y.
2. Choose a few values for x and make
an input/output table.
Graphing an Equation
1. Rewrite the equation by solving for y.
2. Choose a few values for x and make
an input/output table.
3. Plot each ordered pair.
Graphing an Equation
1. Rewrite the equation by solving for y.
2. Choose a few values for x and make
an input/output table.
3. Plot each ordered pair.
4. Connect the points with a straight line.
Horizontal and Vertical lines
 The graph of y = b
is a horizontal line.
 “b” means any
number.
y = 2
Horizontal and Vertical lines
 The graph of x = a is
a vertical line.
 “a” means any
number.
x = - 3
Horizontal and Vertical lines
 What is the “x” value
for any point on the
line x = -3? x = - 3
Intercepts
4.3
Intercepts
 The x-intercept is
the point where a
graph crosses the
x-axis.
Intercepts
 The x-intercept is
the point where a
graph crosses the
x-axis.
 The y-intercept is
the point where a
graph crosses the
y-axis.
Finding Intercepts
To find the x-intercept of a graph, plug
in y=0 and solve for x.
Finding Intercepts
To find the x-intercept of a graph, plug
in y=0 and solve for x.
To find the y-intercept of a graph, plug
in x=0 and solve for y.

4.2,4.3 graphing