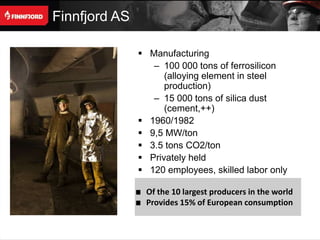
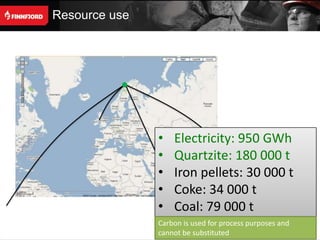
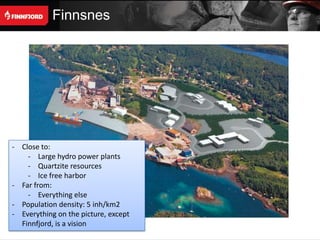
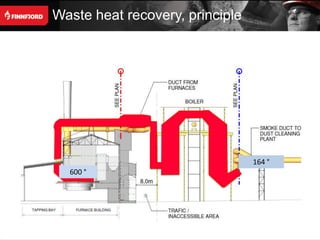
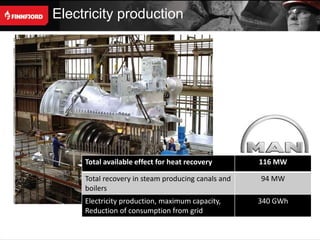
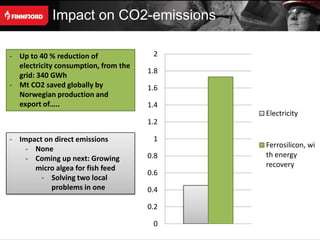
Resource efficency and energy intensive
industry
Dr. Toini Løvseth, Policy
Manager, Finnfjord AS
Finnfjord AS

                Manufacturing
                  – 100 000 tons of ferrosilicon
                     (alloying element in steel
                     production)
                  – 15 000 tons of silica dust
                     (cement,++)
                1960/1982
                9,5 MW/ton
                3.5 tons CO2/ton
                Privately held
                120 employees, skilled labor only

                Of the 10 largest producers in the world
                Provides 15% of European consumption
Resource use


               •   Electricity: 950 GWh
               •   Quartzite: 180 000 t
               •   Iron pellets: 30 000 t
               •   Coke: 34 000 t
               •   Coal: 79 000 t
               Carbon is used for process purposes and
               cannot be substituted
Flagship Roadmaps etc


 ”By reducing reliance on increasingly scarce fuels and
  materials, boosting resource efficiency can also improve
  the security of Europe's supply of raw materials and
  make the EU's economy more resilient to future
  increases in global energy and commodity prices”.

 ”The fact that resource efficiency requires action in such
  a broad range of areas means that modelling is
  particularly complex”.
   – Add: And policies even more complex, and
     overlapping…?
Pros


 Focus and awareness
 Policy incentives
 Possibilities for improved global
  competitiveness
Cons


 Use of scrap metal/recycling not always possible
 Relationship between the choice of raw materials,
  product quality and local emissions
   – Scrap increases local emissions
   – Limited availability of bio coal from hard wood
 Dedusting and cleansing means increased energy
  consumption
 Value chains need to be sustainable on all accounts
 The solution is flexibility for choosing local solutions
The importance of energy


                                      Labour
                       Finance


                                               Quarts, coal, ir
                                                   on…
                         Other
                     operating cost


                                 Electricit
                                     y


               Local pricing, EU carbon market
Energy consumption and “waste”


       FeSi Furnaces               Electricity    Energy in
                                  consumption    waste heat
             1                      18,2 MW      14,6 MW
             2                      43,8 MW      36,5 MW
             3                      44,1 MW      38,1 MW


Most efficient use of waste heat energy:
- Process heat for industrial customers
- District heating
Finnsnes


- Close to:
    - Large hydro power plants
    - Quartzite resources
    - Ice free harbor
- Far from:
    - Everything else
- Population density: 5 inh/km2
- Everything on the picture, except
  Finnfjord, is a vision
Waste heat recovery, principle


                                 164 °
  600 °
Electricity production


     Total available effect for heat recovery       116 MW

     Total recovery in steam producing canals and   94 MW
     boilers
     Electricity production, maximum capacity,      340 GWh
     Reduction of consumption from grid
Impact on CO2-emissions

- Up to 40 % reduction of              2
  electricity consumption, from the
                                      1.8
  grid: 340 GWh
- Mt CO2 saved globally by            1.6
  Norwegian production and
  export of…..                        1.4
                                            Electricity
                                      1.2

- Impact on direct emissions           1
    - None                                  Ferrosilicon, wi
    - Coming up next: Growing         0.8   th energy
      micro algea for fish feed             recovery
                                      0.6
        - Solving two local
           problems in one            0.4

                                      0.2

                                       0
Policy message

 Know that
   – Investments in upstream manufacturing is not
     rewarded by consumers/customers
   – State aid often necessary. Which means: Cannot be
     mandatory, yet.
 Side effects of detailed regulation
   – ETS: Almost impossible to reach allocation
     benchmark if located in rural areas
   – Good example: EED and the possibility to take into
     account: “geographical feasibility, financial investment
     potential of the installations and the existence of
     alternatives”
 Double/triple and inconsistent regulation: ETS, EED and
  Ecodesign on heat recovery: Which is the official view?
 Aim high, but allow for flexibility in the choice of
  measures
Join the discussion!


 ER>ER: http://erer.ee-ip.org/erer_matrix/

View from other industry: resource management, Toini Løvseth, Finnord, Norway

  • 1.
    Resource efficency andenergy intensive industry Dr. Toini Løvseth, Policy Manager, Finnfjord AS
  • 2.
    Finnfjord AS  Manufacturing – 100 000 tons of ferrosilicon (alloying element in steel production) – 15 000 tons of silica dust (cement,++)  1960/1982  9,5 MW/ton  3.5 tons CO2/ton  Privately held  120 employees, skilled labor only Of the 10 largest producers in the world Provides 15% of European consumption
  • 3.
    Resource use • Electricity: 950 GWh • Quartzite: 180 000 t • Iron pellets: 30 000 t • Coke: 34 000 t • Coal: 79 000 t Carbon is used for process purposes and cannot be substituted
  • 4.
    Flagship Roadmaps etc ”By reducing reliance on increasingly scarce fuels and materials, boosting resource efficiency can also improve the security of Europe's supply of raw materials and make the EU's economy more resilient to future increases in global energy and commodity prices”.  ”The fact that resource efficiency requires action in such a broad range of areas means that modelling is particularly complex”. – Add: And policies even more complex, and overlapping…?
  • 5.
    Pros  Focus andawareness  Policy incentives  Possibilities for improved global competitiveness
  • 6.
    Cons  Use ofscrap metal/recycling not always possible  Relationship between the choice of raw materials, product quality and local emissions – Scrap increases local emissions – Limited availability of bio coal from hard wood  Dedusting and cleansing means increased energy consumption  Value chains need to be sustainable on all accounts  The solution is flexibility for choosing local solutions
  • 7.
    The importance ofenergy Labour Finance Quarts, coal, ir on… Other operating cost Electricit y Local pricing, EU carbon market
  • 8.
    Energy consumption and“waste” FeSi Furnaces Electricity Energy in consumption waste heat 1 18,2 MW 14,6 MW 2 43,8 MW 36,5 MW 3 44,1 MW 38,1 MW Most efficient use of waste heat energy: - Process heat for industrial customers - District heating
  • 9.
    Finnsnes - Close to: - Large hydro power plants - Quartzite resources - Ice free harbor - Far from: - Everything else - Population density: 5 inh/km2 - Everything on the picture, except Finnfjord, is a vision
  • 10.
    Waste heat recovery,principle 164 ° 600 °
  • 11.
    Electricity production Total available effect for heat recovery 116 MW Total recovery in steam producing canals and 94 MW boilers Electricity production, maximum capacity, 340 GWh Reduction of consumption from grid
  • 12.
    Impact on CO2-emissions -Up to 40 % reduction of 2 electricity consumption, from the 1.8 grid: 340 GWh - Mt CO2 saved globally by 1.6 Norwegian production and export of….. 1.4 Electricity 1.2 - Impact on direct emissions 1 - None Ferrosilicon, wi - Coming up next: Growing 0.8 th energy micro algea for fish feed recovery 0.6 - Solving two local problems in one 0.4 0.2 0
  • 13.
    Policy message  Knowthat – Investments in upstream manufacturing is not rewarded by consumers/customers – State aid often necessary. Which means: Cannot be mandatory, yet.  Side effects of detailed regulation – ETS: Almost impossible to reach allocation benchmark if located in rural areas – Good example: EED and the possibility to take into account: “geographical feasibility, financial investment potential of the installations and the existence of alternatives”  Double/triple and inconsistent regulation: ETS, EED and Ecodesign on heat recovery: Which is the official view?  Aim high, but allow for flexibility in the choice of measures
  • 14.
    Join the discussion! ER>ER: http://erer.ee-ip.org/erer_matrix/