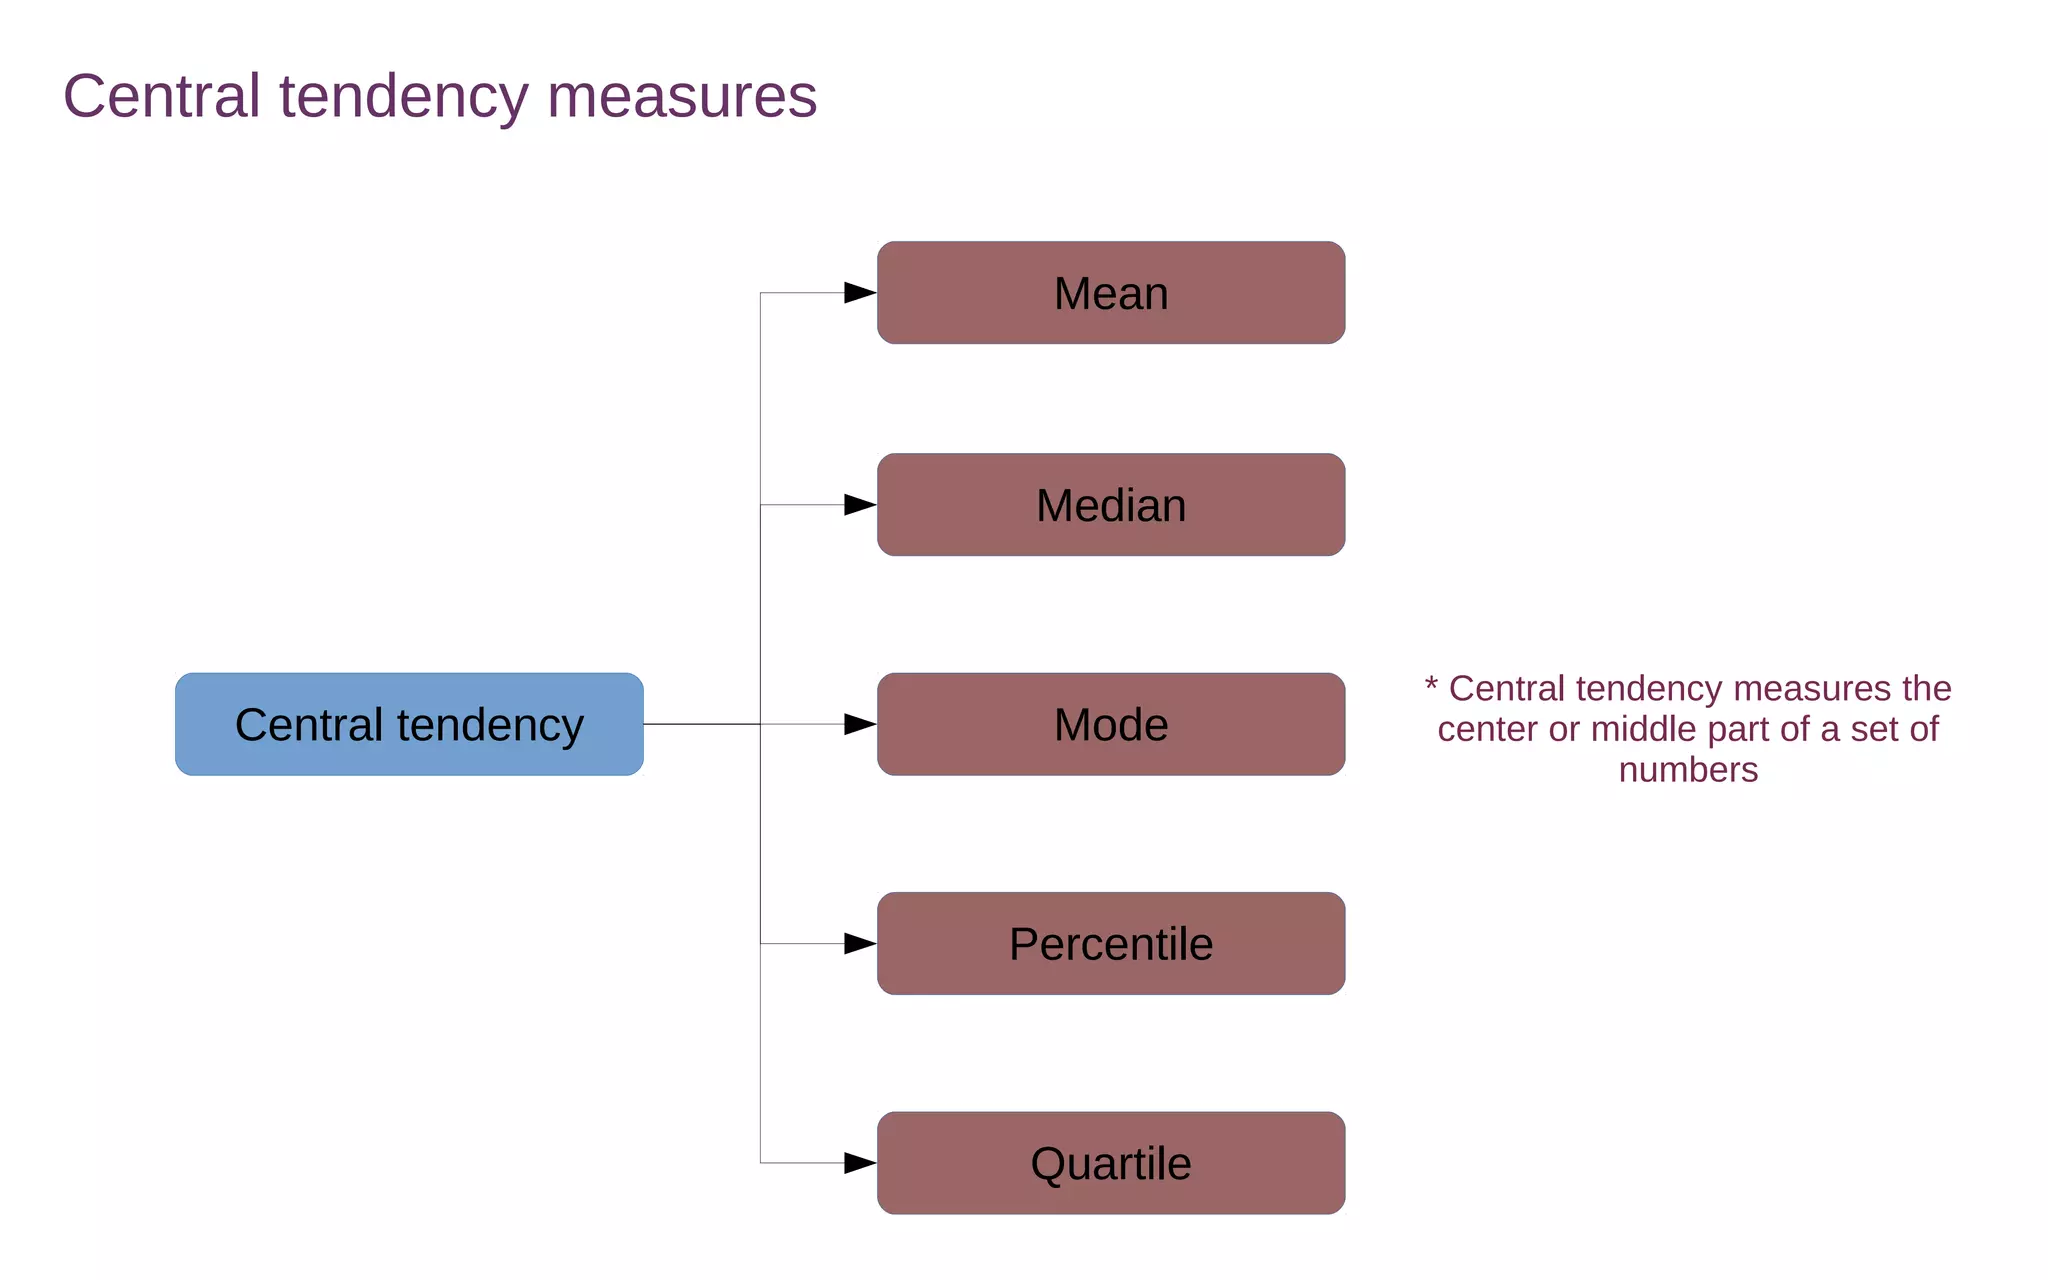
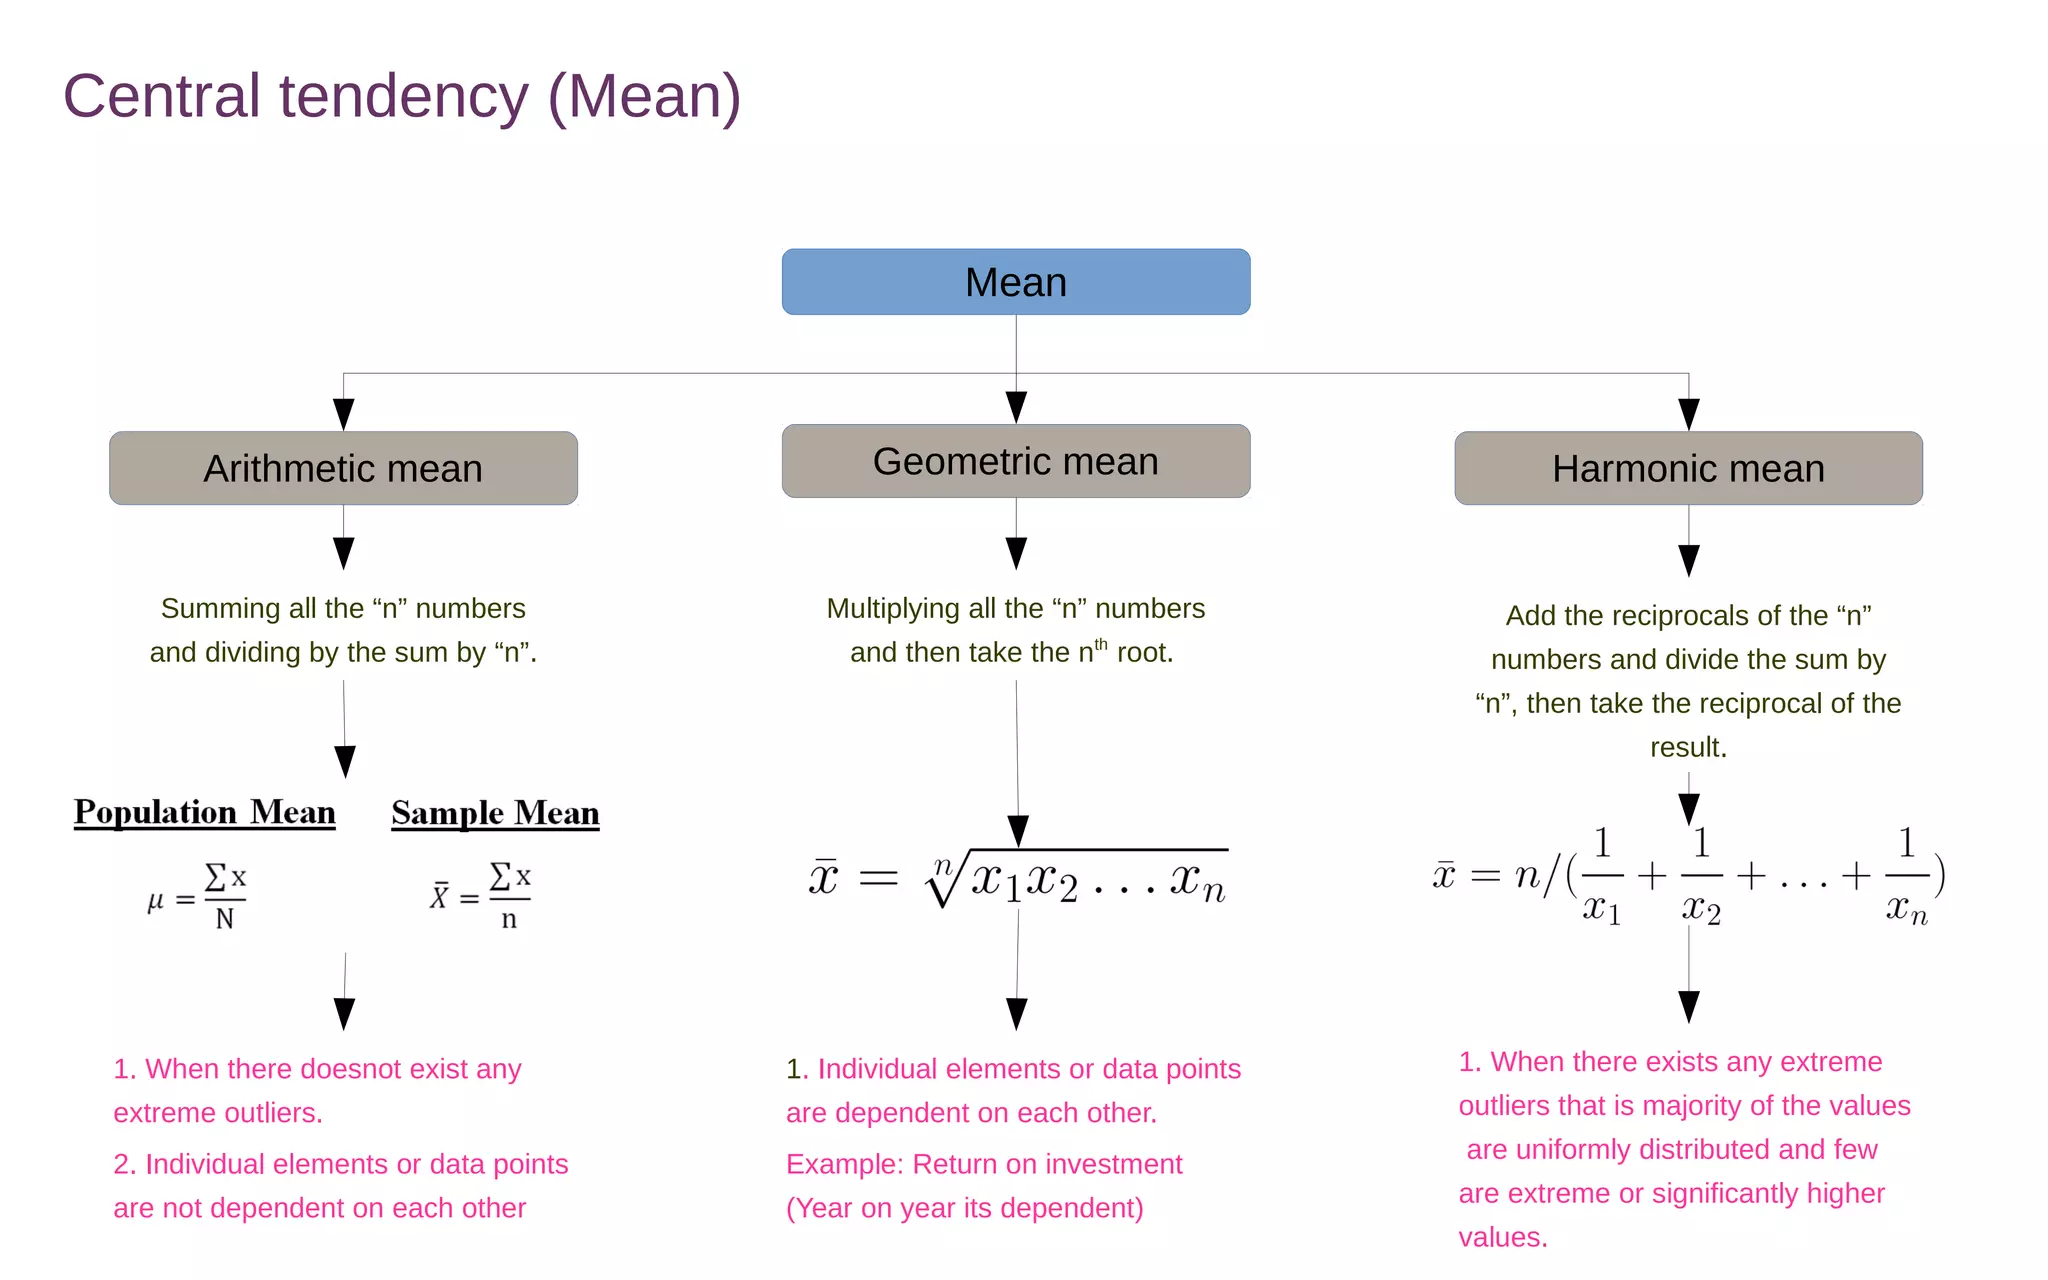
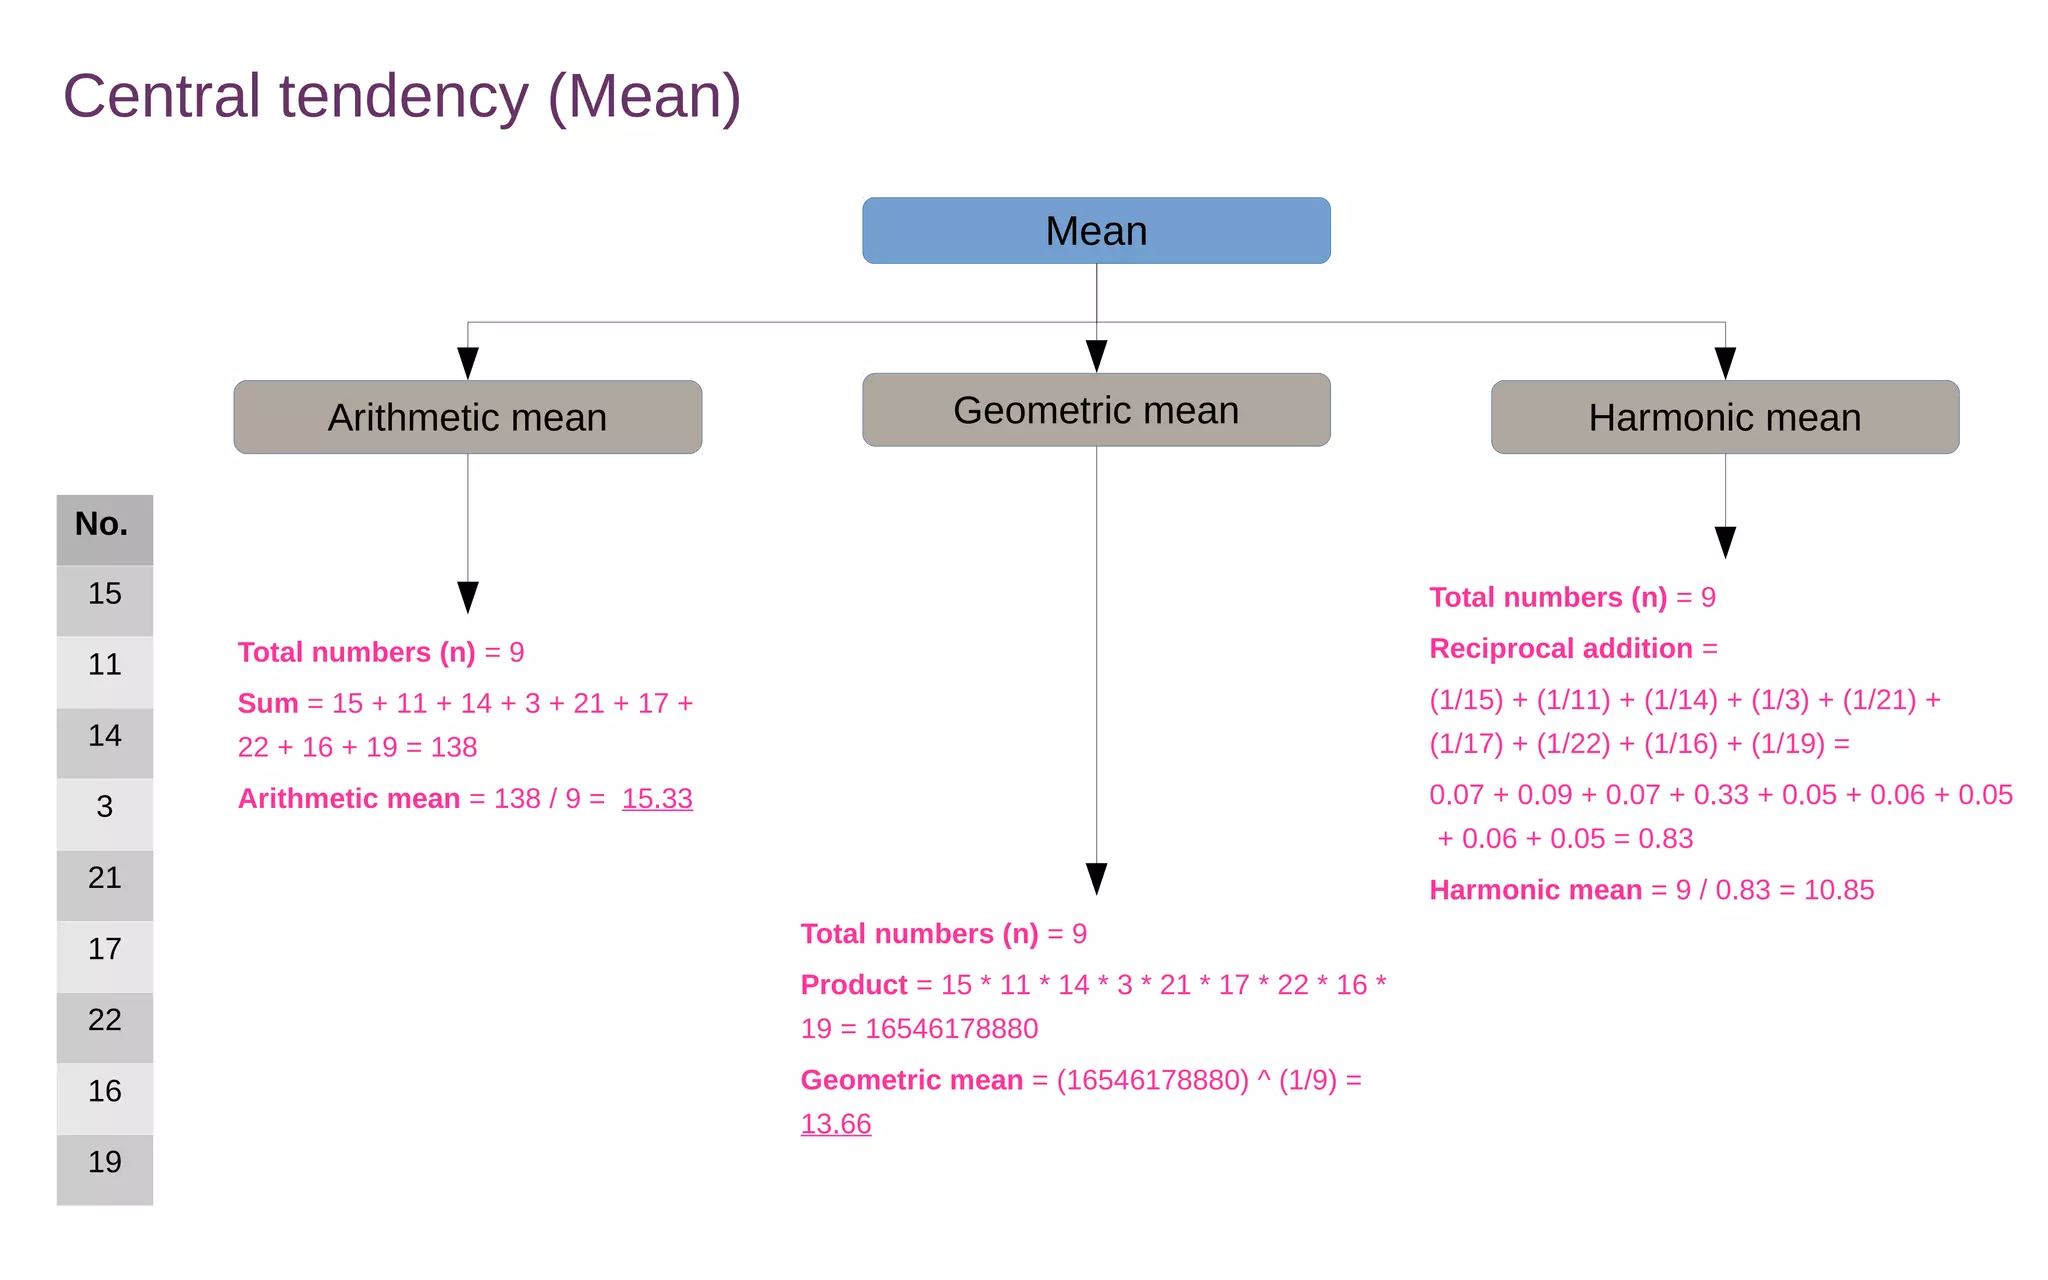
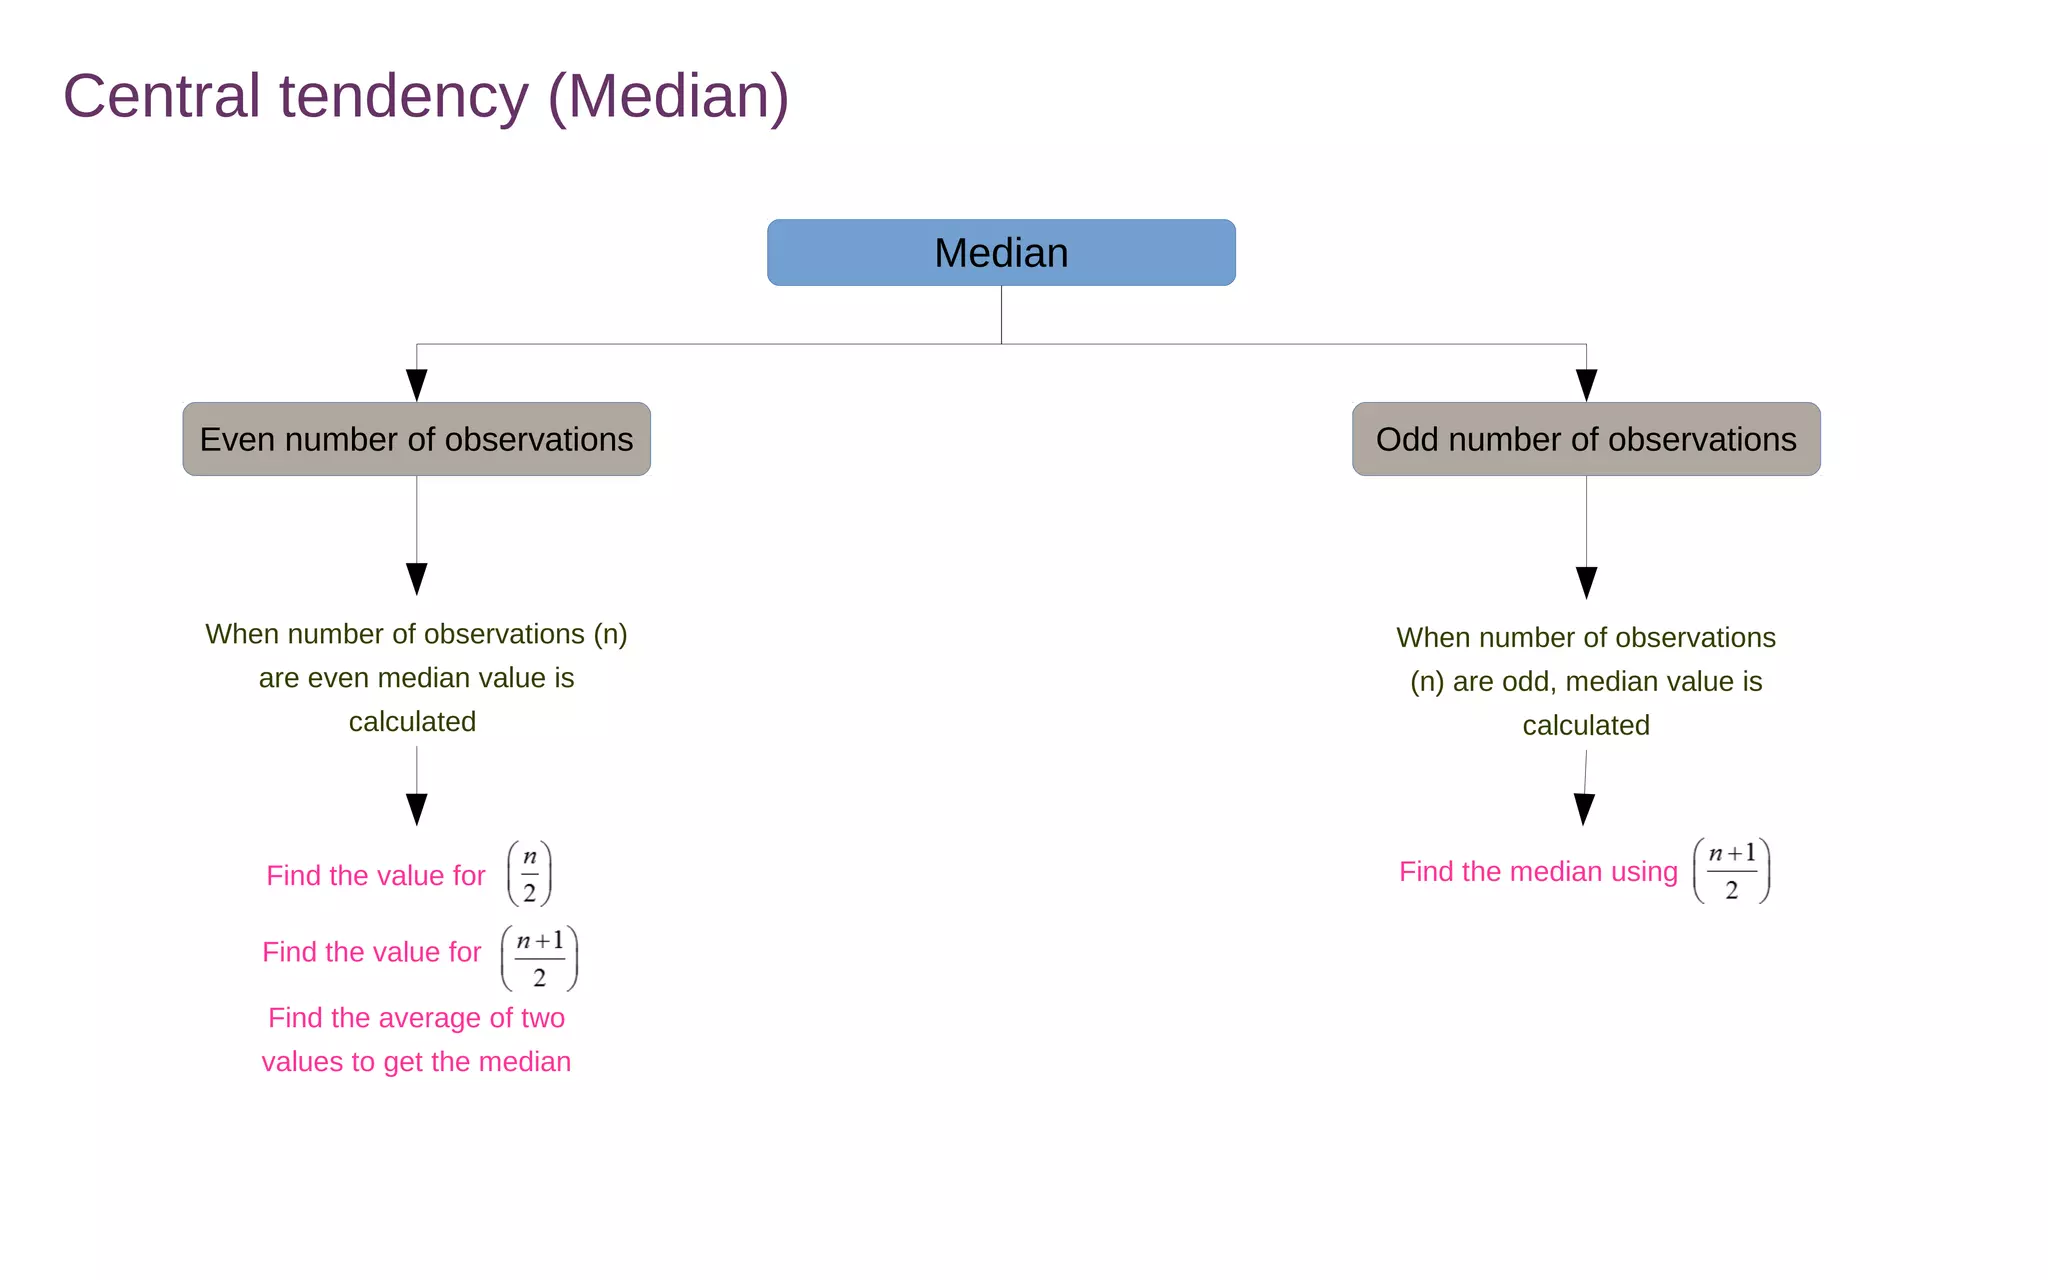
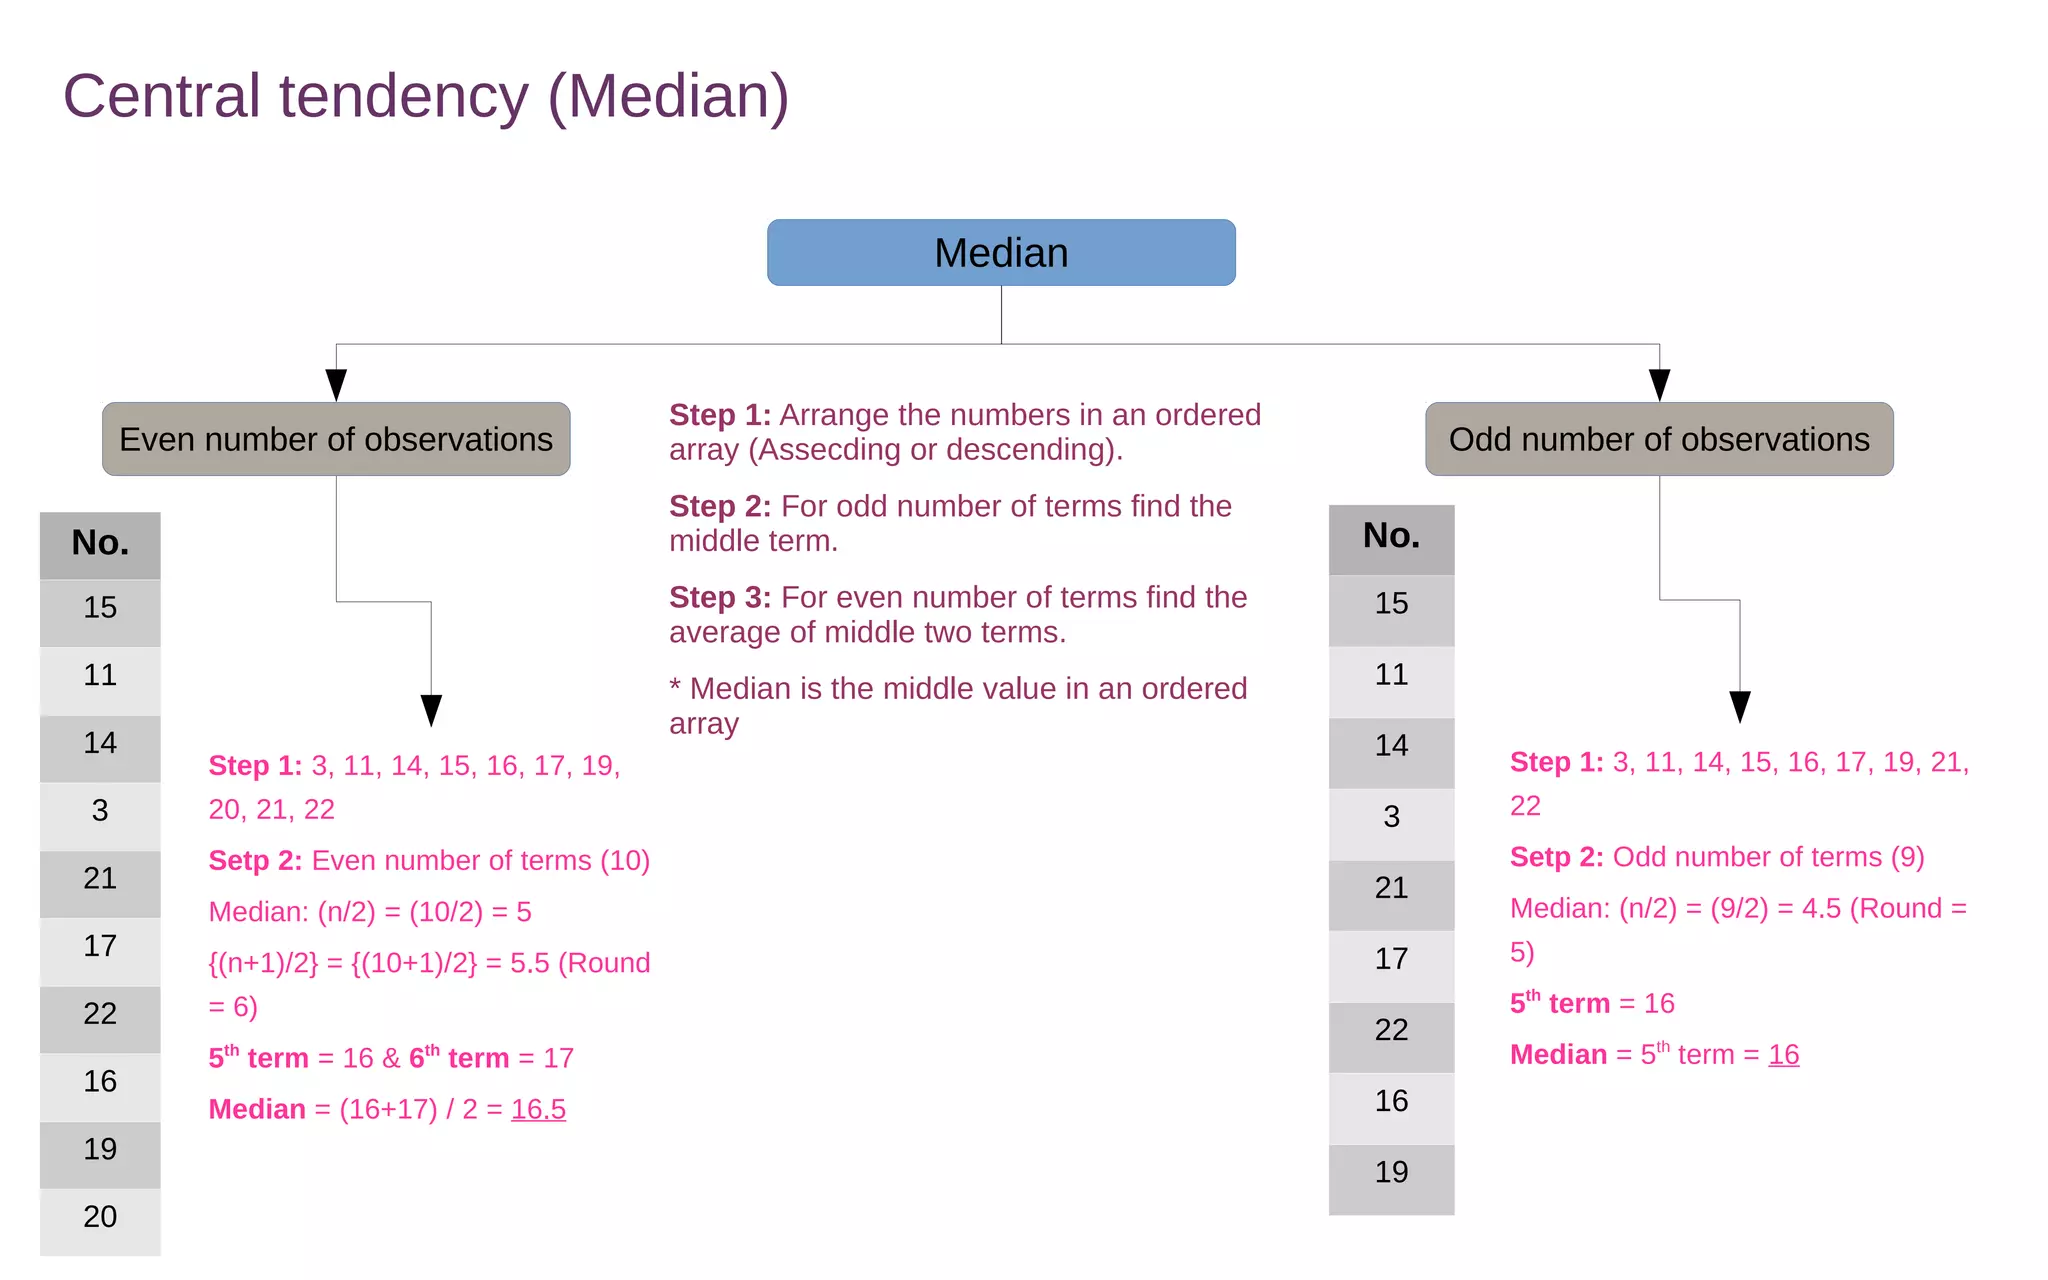
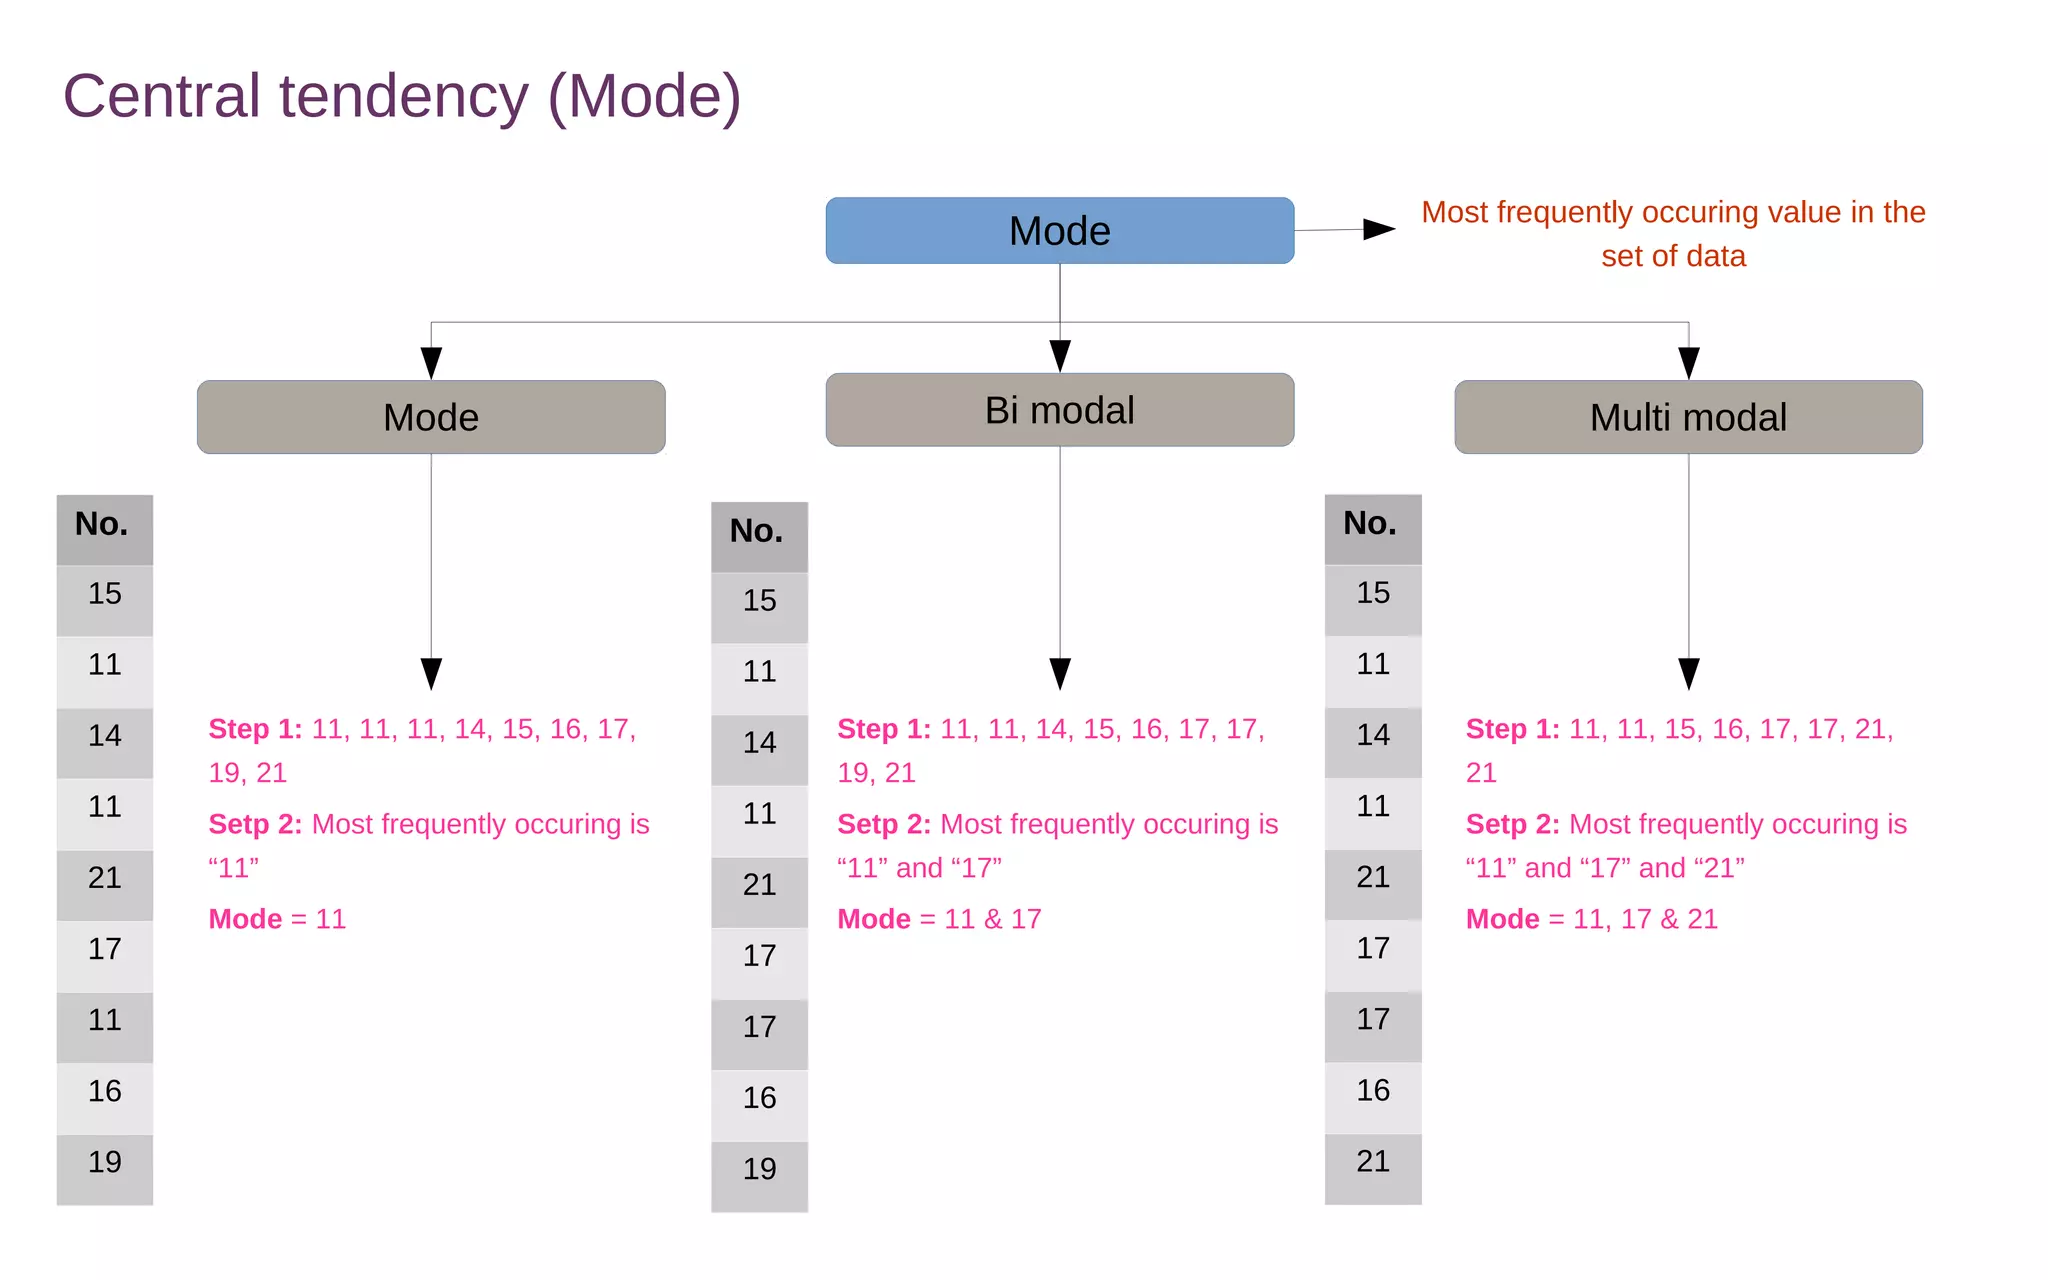
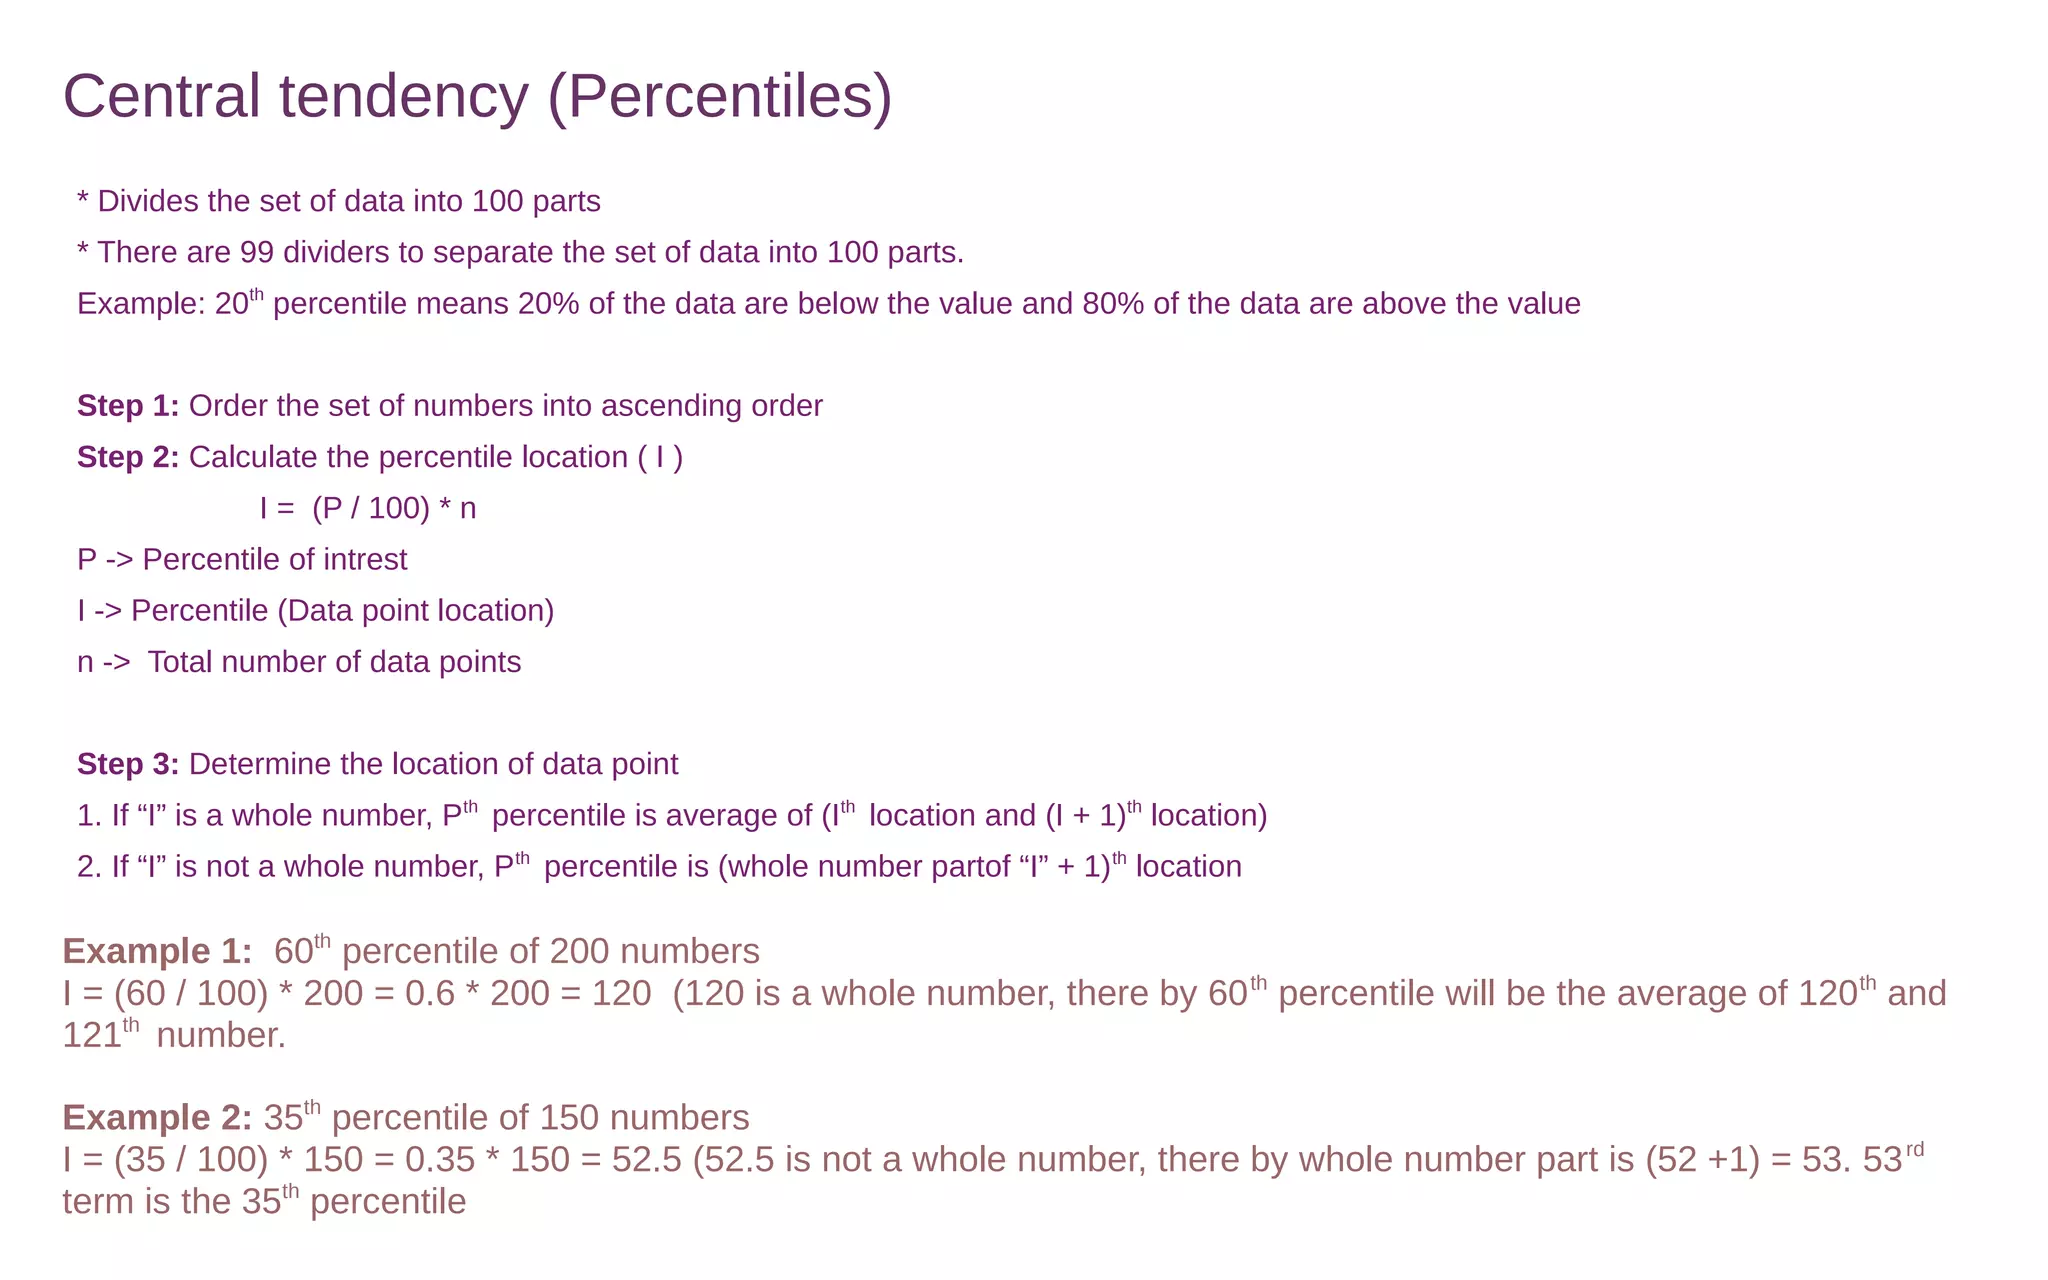
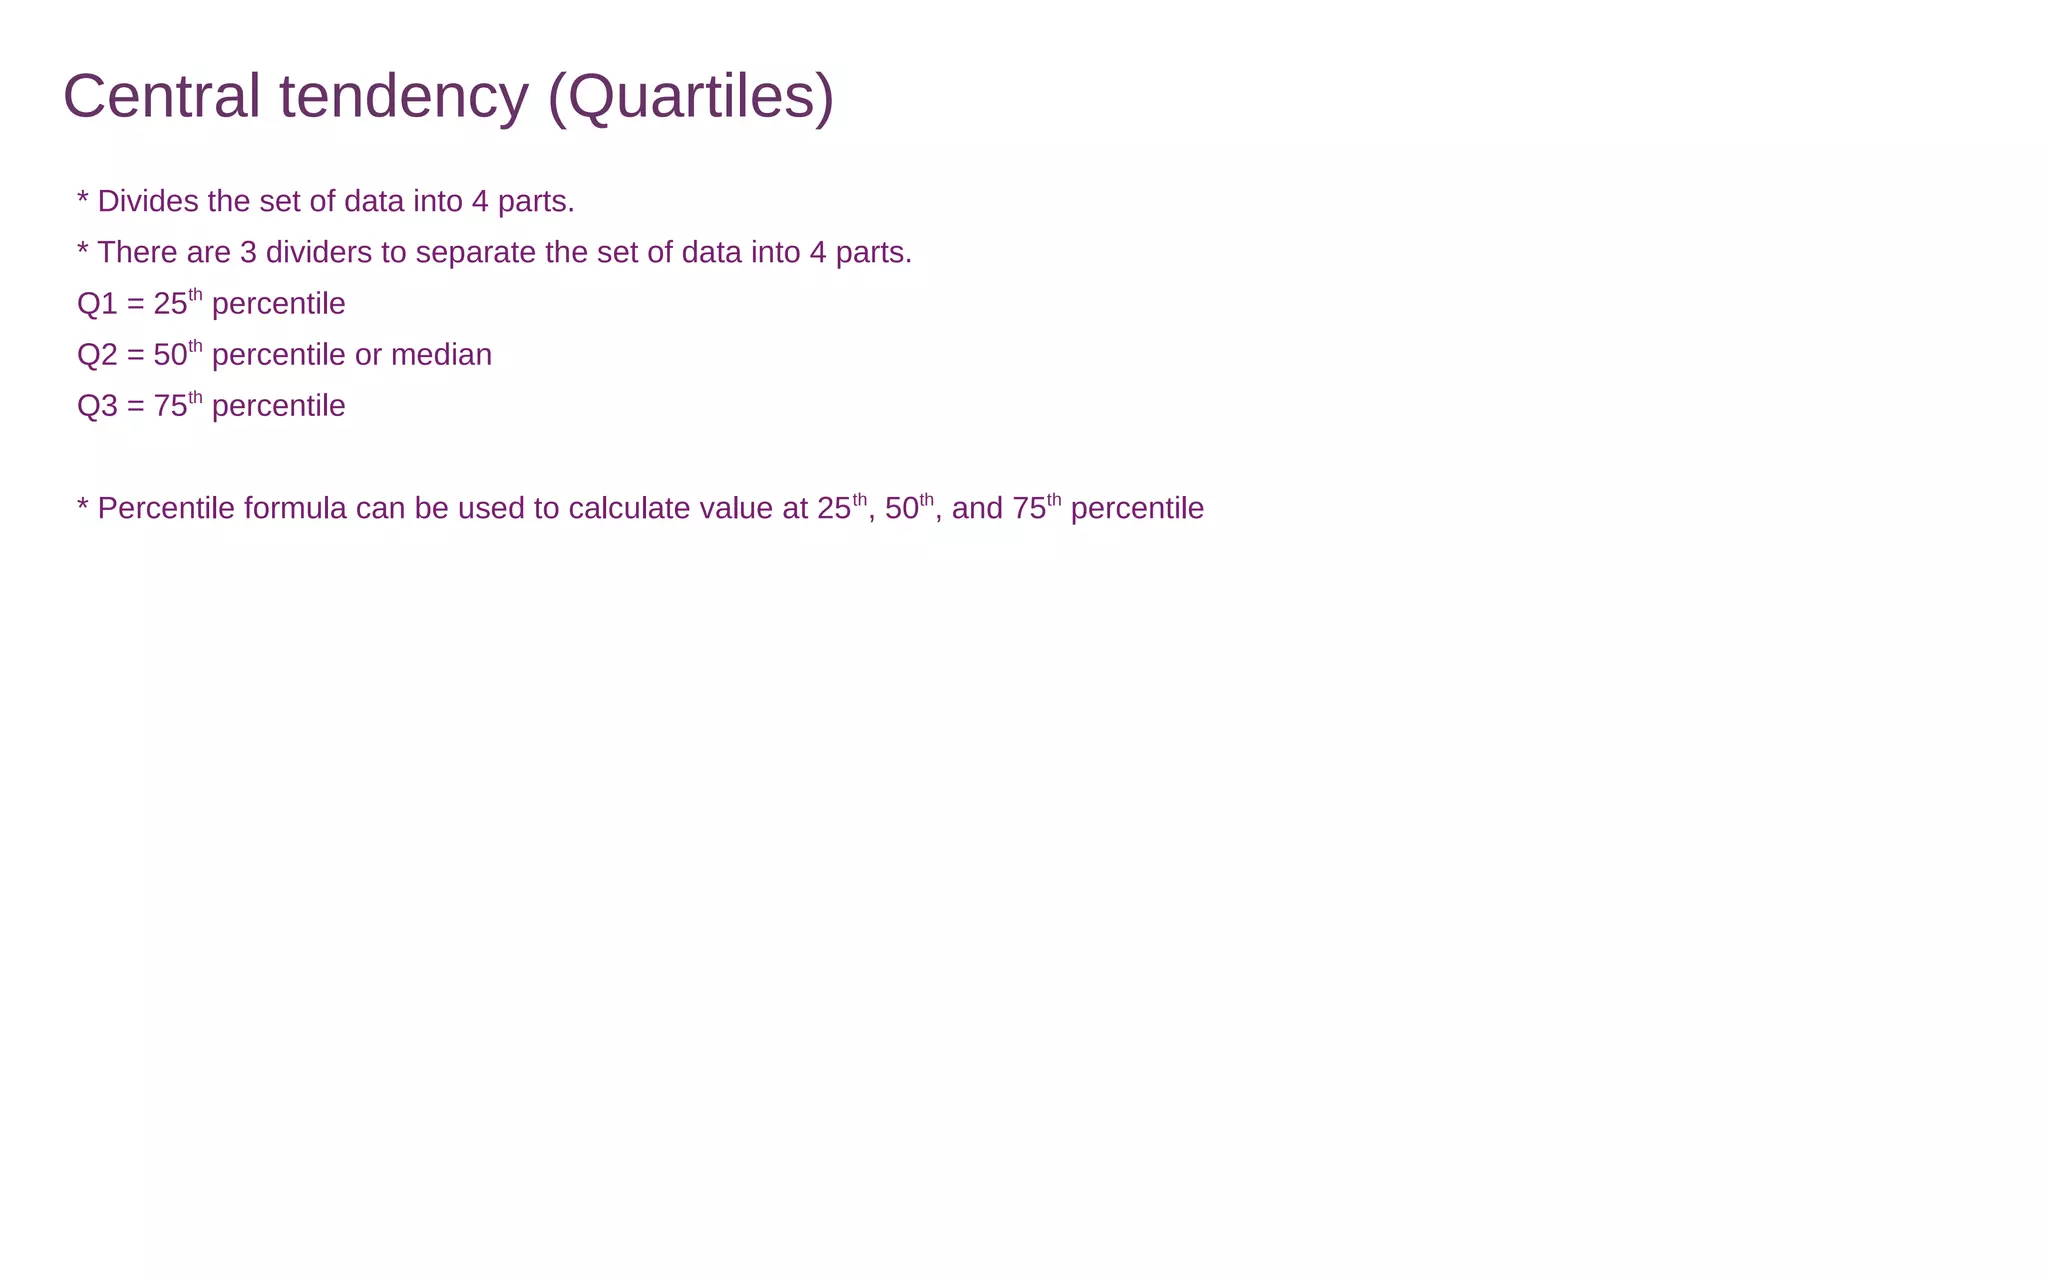
Descriptive statistics (Central tendency)
Central tendency measures
Central tendency
Mean
Median
Mode
Percentile
Quartile
* Central tendency measures the
center or middle part of a set of
numbers
Central tendency (Mean)
Mean
Harmonic meanGeometric meanArithmetic mean
Summing all the “n” numbers
and dividing by the sum by “n”.
Multiplying all the “n” numbers
and then take the nth
root.
Add the reciprocals of the “n”
numbers and divide the sum by
“n”, then take the reciprocal of the
result.
1. When there doesnot exist any
extreme outliers.
2. Individual elements or data points
are not dependent on each other
1. Individual elements or data points
are dependent on each other.
Example: Return on investment
(Year on year its dependent)
1. When there exists any extreme
outliers that is majority of the values
are uniformly distributed and few
are extreme or significantly higher
values.
Central tendency (Mean)
Mean
Harmonic meanGeometric meanArithmetic mean
No.
15
11
14
3
21
17
22
16
19
Total numbers (n) = 9
Sum = 15 + 11 + 14 + 3 + 21 + 17 +
22 + 16 + 19 = 138
Arithmetic mean = 138 / 9 = 15.33
Total numbers (n) = 9
Product = 15 * 11 * 14 * 3 * 21 * 17 * 22 * 16 *
19 = 16546178880
Geometric mean = (16546178880) ^ (1/9) =
13.66
Total numbers (n) = 9
Reciprocal addition =
(1/15) + (1/11) + (1/14) + (1/3) + (1/21) +
(1/17) + (1/22) + (1/16) + (1/19) =
0.07 + 0.09 + 0.07 + 0.33 + 0.05 + 0.06 + 0.05
+ 0.06 + 0.05 = 0.83
Harmonic mean = 9 / 0.83 = 10.85
Central tendency (Median)
Median
Odd number of observationsEven number of observations
When number of observations
(n) are odd, median value is
calculated
When number of observations (n)
are even median value is
calculated
Find the value for
Find the value for
Find the average of two
values to get the median
Find the median using
Central tendency (Median)
Median
Odd number of observationsEven number of observations
Step 1: Arrange the numbers in an ordered
array (Assecding or descending).
Step 2: For odd number of terms find the
middle term.
Step 3: For even number of terms find the
average of middle two terms.
* Median is the middle value in an ordered
array
No.
15
11
14
3
21
17
22
16
19
20
No.
15
11
14
3
21
17
22
16
19
Step 1: 3, 11, 14, 15, 16, 17, 19,
20, 21, 22
Setp 2: Even number of terms (10)
Median: (n/2) = (10/2) = 5
{(n+1)/2} = {(10+1)/2} = 5.5 (Round
= 6)
5th
term = 16 & 6th
term = 17
Median = (16+17) / 2 = 16.5
Step 1: 3, 11, 14, 15, 16, 17, 19, 21,
22
Setp 2: Odd number of terms (9)
Median: (n/2) = (9/2) = 4.5 (Round =
5)
5th
term = 16
Median = 5th
term = 16
Central tendency (Mode)
Mode
Multi modalBi modalMode
No.
15
11
14
11
21
17
11
16
19
Most frequently occuring value in the
set of data
Step 1: 11, 11, 11, 14, 15, 16, 17,
19, 21
Setp 2: Most frequently occuring is
“11”
Mode = 11
No.
15
11
14
11
21
17
17
16
19
No.
15
11
14
11
21
17
17
16
21
Step 1: 11, 11, 14, 15, 16, 17, 17,
19, 21
Setp 2: Most frequently occuring is
“11” and “17”
Mode = 11 & 17
Step 1: 11, 11, 15, 16, 17, 17, 21,
21
Setp 2: Most frequently occuring is
“11” and “17” and “21”
Mode = 11, 17 & 21
Central tendency (Percentiles)
* Divides the set of data into 100 parts
* There are 99 dividers to separate the set of data into 100 parts.
Example: 20th
percentile means 20% of the data are below the value and 80% of the data are above the value
Step 1: Order the set of numbers into ascending order
Step 2: Calculate the percentile location ( I )
I = (P / 100) * n
P -> Percentile of intrest
I -> Percentile (Data point location)
n -> Total number of data points
Step 3: Determine the location of data point
1. If “I” is a whole number, Pth
percentile is average of (Ith
location and (I + 1)th
location)
2. If “I” is not a whole number, Pth
percentile is (whole number partof “I” + 1)th
location
Example 1: 60th
percentile of 200 numbers
I = (60 / 100) * 200 = 0.6 * 200 = 120 (120 is a whole number, there by 60th
percentile will be the average of 120th
and
121th
number.
Example 2: 35th
percentile of 150 numbers
I = (35 / 100) * 150 = 0.35 * 150 = 52.5 (52.5 is not a whole number, there by whole number part is (52 +1) = 53. 53rd
term is the 35th
percentile
Central tendency (Quartiles)
* Divides the set of data into 4 parts.
* There are 3 dividers to separate the set of data into 4 parts.
Q1 = 25th
percentile
Q2 = 50th
percentile or median
Q3 = 75th
percentile
* Percentile formula can be used to calculate value at 25th
, 50th
, and 75th
percentile

4. descriptive statistics (central tendency)

  • 1.
  • 2.
    Central tendency measures Centraltendency Mean Median Mode Percentile Quartile * Central tendency measures the center or middle part of a set of numbers
  • 3.
    Central tendency (Mean) Mean HarmonicmeanGeometric meanArithmetic mean Summing all the “n” numbers and dividing by the sum by “n”. Multiplying all the “n” numbers and then take the nth root. Add the reciprocals of the “n” numbers and divide the sum by “n”, then take the reciprocal of the result. 1. When there doesnot exist any extreme outliers. 2. Individual elements or data points are not dependent on each other 1. Individual elements or data points are dependent on each other. Example: Return on investment (Year on year its dependent) 1. When there exists any extreme outliers that is majority of the values are uniformly distributed and few are extreme or significantly higher values.
  • 4.
    Central tendency (Mean) Mean HarmonicmeanGeometric meanArithmetic mean No. 15 11 14 3 21 17 22 16 19 Total numbers (n) = 9 Sum = 15 + 11 + 14 + 3 + 21 + 17 + 22 + 16 + 19 = 138 Arithmetic mean = 138 / 9 = 15.33 Total numbers (n) = 9 Product = 15 * 11 * 14 * 3 * 21 * 17 * 22 * 16 * 19 = 16546178880 Geometric mean = (16546178880) ^ (1/9) = 13.66 Total numbers (n) = 9 Reciprocal addition = (1/15) + (1/11) + (1/14) + (1/3) + (1/21) + (1/17) + (1/22) + (1/16) + (1/19) = 0.07 + 0.09 + 0.07 + 0.33 + 0.05 + 0.06 + 0.05 + 0.06 + 0.05 = 0.83 Harmonic mean = 9 / 0.83 = 10.85
  • 5.
    Central tendency (Median) Median Oddnumber of observationsEven number of observations When number of observations (n) are odd, median value is calculated When number of observations (n) are even median value is calculated Find the value for Find the value for Find the average of two values to get the median Find the median using
  • 6.
    Central tendency (Median) Median Oddnumber of observationsEven number of observations Step 1: Arrange the numbers in an ordered array (Assecding or descending). Step 2: For odd number of terms find the middle term. Step 3: For even number of terms find the average of middle two terms. * Median is the middle value in an ordered array No. 15 11 14 3 21 17 22 16 19 20 No. 15 11 14 3 21 17 22 16 19 Step 1: 3, 11, 14, 15, 16, 17, 19, 20, 21, 22 Setp 2: Even number of terms (10) Median: (n/2) = (10/2) = 5 {(n+1)/2} = {(10+1)/2} = 5.5 (Round = 6) 5th term = 16 & 6th term = 17 Median = (16+17) / 2 = 16.5 Step 1: 3, 11, 14, 15, 16, 17, 19, 21, 22 Setp 2: Odd number of terms (9) Median: (n/2) = (9/2) = 4.5 (Round = 5) 5th term = 16 Median = 5th term = 16
  • 7.
    Central tendency (Mode) Mode MultimodalBi modalMode No. 15 11 14 11 21 17 11 16 19 Most frequently occuring value in the set of data Step 1: 11, 11, 11, 14, 15, 16, 17, 19, 21 Setp 2: Most frequently occuring is “11” Mode = 11 No. 15 11 14 11 21 17 17 16 19 No. 15 11 14 11 21 17 17 16 21 Step 1: 11, 11, 14, 15, 16, 17, 17, 19, 21 Setp 2: Most frequently occuring is “11” and “17” Mode = 11 & 17 Step 1: 11, 11, 15, 16, 17, 17, 21, 21 Setp 2: Most frequently occuring is “11” and “17” and “21” Mode = 11, 17 & 21
  • 8.
    Central tendency (Percentiles) *Divides the set of data into 100 parts * There are 99 dividers to separate the set of data into 100 parts. Example: 20th percentile means 20% of the data are below the value and 80% of the data are above the value Step 1: Order the set of numbers into ascending order Step 2: Calculate the percentile location ( I ) I = (P / 100) * n P -> Percentile of intrest I -> Percentile (Data point location) n -> Total number of data points Step 3: Determine the location of data point 1. If “I” is a whole number, Pth percentile is average of (Ith location and (I + 1)th location) 2. If “I” is not a whole number, Pth percentile is (whole number partof “I” + 1)th location Example 1: 60th percentile of 200 numbers I = (60 / 100) * 200 = 0.6 * 200 = 120 (120 is a whole number, there by 60th percentile will be the average of 120th and 121th number. Example 2: 35th percentile of 150 numbers I = (35 / 100) * 150 = 0.35 * 150 = 52.5 (52.5 is not a whole number, there by whole number part is (52 +1) = 53. 53rd term is the 35th percentile
  • 9.
    Central tendency (Quartiles) *Divides the set of data into 4 parts. * There are 3 dividers to separate the set of data into 4 parts. Q1 = 25th percentile Q2 = 50th percentile or median Q3 = 75th percentile * Percentile formula can be used to calculate value at 25th , 50th , and 75th percentile