This document summarizes a conference paper about modeling a 6.09 MW PV plant in PSCAD software to analyze its integration with the power grid based on grid code requirements. It presents two models of the PV plant - a simplified model that does not include transformers and cables, and a more complex model that does. The complex model is needed to accurately capture the reactive power influence of components like transformers and cables at the common coupling point. Simulation results show the maximum real and reactive power that can be exported while meeting the grid code, and that the complex model is needed to be compliant with reactive power limits during low irradiance and at night.


![THE 9
th
INTERNATIONAL SYMPOSIUM ON ADVANCED TOPICS IN ELECTRICAL ENGINEERING
May 7-9, 2015
Bucharest, Romania
978-1-4799-7514-3/15/$31.00 ©2015 IEEE
PV Plant Modeling for Power System Integration
using PSCAD Software
Bogdan GORGAN1
, Stefan BUSOI1
, Gabriel TANASESCU1
, Petru V. NOTINGHER2
, Member IEEE
1
SC SIMTECH INTERNATIONAL SRL, Amurgului St., No. 45B, Ilfov, Romania
2
University POLITEHNICA of Bucharest, Splaiul Independentei St., No. 313, 060042, Bucharest, Romania
bgorgan@simtech-international.ro, sabusoi@simtech-international.ro, gtanasescu@simtech-international.ro,
petrunot@elmat.pub.ro
Abstract-PV Plants connected to the medium voltage grid do not
contribute to the grid stability. In order to prevent grid
instability, directives (codes) for connecting PV plants to the
medium voltage power grid have been released. The supply and
control of the reactive power from the renewable generation
plants are becoming important issues to be studied, because they
can facilitate the integration of PV in power grids. In this paper,
two new models of a 6.09 MW PV plant, used to analyze its grid
integration according to the grid code, are presented. The first is
a simplified model, without taking into account transformers
and cables, while the second one is a more complex model which
includes these components. The model was developed using
PSCAD-EMTDC software. The final part of the paper presents
the active-reactive power (P-Q) charts, calculated at the common
coupling point (CCP), for different levels of solar radiation (0%
to 100%). Based on these charts, it is determined the maximum
output power level which can be generated by the plant,
according to the current grid code.
Keywords: common coupling point, P-Q chart, PSCAD software,
PV plant, reactive power control.
I. INTRODUCTION
There is an increasing interest in renewable energy sources,
explained by changes occurred in the electro-energetic system
(manufacturing quality increase, lower equipment costs,
renewed interest in environmental pollution, continuous
decrease of classic fuel energy sources and worries regarding
nuclear energy) [1].
Until 2012, the installed PV capacity all over the world
exceeded 100 gigawatt (GW) [2]. Statistical data show that
PV systems are now developing in two directions: in large-
scale grid connected PV systems and in small-scale PV
systems integrated with other distributed generators in micro-
grids. Large-scale grid connected PV systems are generally
connected to the utility on the medium (20 kV/35 kV) or
high-voltage side (110 kV), with the rated capacity ranging
from 1 MW to hundreds of megawatts or even more [2].
PV units were operated to maximize the production of
energy in the past, regardless of the possibility of using
reactive power as a resource to improve the performance of
the energy system. During recent years, the possibility of
using PV plants as service providers has also been analyzed.
Moreover, it is a matter of fact that several transmission
system operators (TSO) are introducing in their grid-code
specific requirements concerning the possible application of
PV plants to control the reactive power and to participate in
voltage regulation [3].
Details of this can be found in the Italian, German,
Canadian, Australian and North American regulations [3]-[5].
In North America, the required power factor range is 0.95
lead (capacitive)/lag (inductive) at maximum power output
and must be supplied at the CCP [4]. Most grid codes in
Europe recognize that reactive power capability depends on
voltage conditions and contain specifications to that effect.
Thus, in Germany, the power factor design criterion is 0.95
lead/lag at full power output [5], which requires inverters to
be oversized or de-rated. This standard also requires dynamic
reactive power support during voltage variations [4]-[5]. In
Romania, the required power factor range is 0.9 lead/lag at
maximum power output and must be supplied at the CCP [6]-
[7]. Regulation [7] adds up a new deadline for PV plant grid
integration and maximum allowed limits for reactive power
generated during the night, in comparison with [6].
The major issues encountered when a PV plant is
connected to the power grid (stipulated in the grid code) are
the difficulty in operating at full power (taking into account
that the plant must operate at a certain power factor –
lead/lag, which implies generation/absorption of reactive
power to control the voltage at CCP), low/zero voltage ride
through (LVRT/ZVRT) function and no reactive power
generated/absorbed during the night [4]-[7].
Models regarding hybrid or single type power plants
behavior (wind/PV/diesel) and financial issues studies were
developed [8]-[20]. In [8] is presented a PV plant model
which takes into account environmental working conditions
(temperature and wind speed) and specific plant
configuration, for performance analysis and power production
forecast. In [9] are presented two models for wind and
photovoltaic power plants, which can evaluate (forecast) the
output power. In [10] is presented a steady-state model of a
grid connected power converter system and electrical
characteristics of the power converter under different control
conditions. Also, a solar cell model is presented, which is
used for energy transfer and grid integration study of the solar
PV system by incorporating together electrical characteristics
of the power converter and extracted power characteristics of](https://image.slidesharecdn.com/36-pvplant-modeling-gorgan-200729082629/85/36-p-vplant-modeling-gorgan-2-320.jpg)
![the PV generator. A detailed dynamic model, containing the
control and simulation of a smart grid-connected PV/WT
(wind turbine) hybrid power generation system, is proposed
in [11]. The dynamic behavior of the proposed model is
examined under different operating conditions. Solar
irradiance, temperature and wind speed data is gathered from
a 28.8 kW grid connected solar power system [11]. In [12] is
presented a simulation environment for the analysis of PV
generators connected to a micro-grid. An optimal planning
model for investment in large-scale solar PV generation (5
MW and above) from the perspective of an individual
investor is proposed in [13]. In [14], a 260 kW grid-tied PV
plant model is described, as well as harmonic distortion
analysis.
This paper presents two new models of a PV plant located
in Romania (P = 6.09 MW). The first one is a simplified
model and it takes into account PV modules, inverters,
transformers and the grid, without taking into account the
reactive power influence of cables and transformers. The
second one takes into account the transformers and cables
reactive power contributions at the common coupling point.
The models were developed to study the issues which appear
during the PV plant grid integration, according to the current
grid code (the difficulty in operating at full power, low/zero
voltage ride through (LVRT/ZVRT) function and no reactive
power generated/absorbed during the night [4]-[7]).
Such studies require a complete modeling of the PV plant
in an electromagnetic transient software environment. For this
reason, PSCAD with full facilities was chosen to simulate the
PV plant model. PSCAD is a powerful and flexible graphical
user interface to the world-renowned EMTDC simulation
engine. Also, PSCAD’s interface is designed in a way that is
easily used [14].
In the second part of the paper, the mathematical model of
the PV plant is presented. The models for solar panels,
inverters, transformers, cables and grid are described.
The third part refers to results and discussions of the
simulations (maximum output power level which can be
generated by the plant and the reactive power generated
during the night). A comparison between the results of the
simplified and the complete model is made, which shows that
to be in accordance with the current grid codes [6]-[7], the
reactive power influence of subcomponents like transformers
and cables are of utmost importance.
II. PV PLANT MODEL
To study the grid integration of a PV plant, the developed
model should take into account all the equipment installed
on-site. Usually, in a simplified model, transformers and
cables are simulated as resistances and inductances in series
and parallel [10-12]. The model presented in this paper
contains special modules for transformers and cables used to
take into account parameters like transformer magnetizing
current, short-circuit voltage, load and no-load losses, cable
dielectric parameters, length and diameters of cable
conductors and insulation. All these elements contribute to
the final active and especially reactive power generation and
absorption, thus they must be taken into account. The PV
plant model is based on [14] and [21], where more
information is given about the configuration of photovoltaic
modules, dc-dc converter, inverters power control/command
and transformers.
The studied PV plant (which is in operation in Romania)
consists of a number of 29232 photovoltaic modules of rated
power 240 W, 406 inverters with the rated power of 15 kVA,
4 transformers with rated power of 1600 kVA (20/0.4 kV).
There are two types of underground power cables (with cross
sections of 70 and 240 mm2 and lengths of 0.6 and 1.7 km)
connecting the transformers with the common coupling point.
The power of the PV plant is limited by the inverters’
maximum active power and is also called the installed power.
The model uses real data for each equipment, given by the
manufacturers and client.
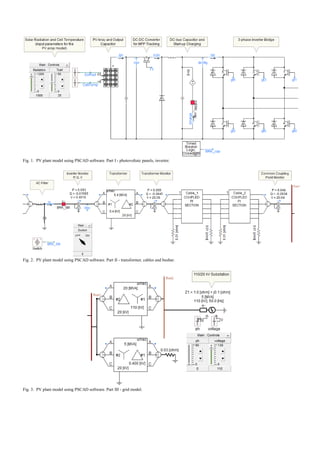
In Figures 1-3, the entire PV plant model, split into three
parts for better resolution, is presented. Fig. 1 presents the PV
plant model containing the photovoltaic modules and the
inverters. Parameters Vpv and Ipv are the dc voltage and
current at the solar panels output. These parameters are
adjusted by the dc-dc converter to ensure that the PV plant
active power is maximum at a given time and also that the
input voltage value of the inverters is dcVltg = 900 V. The
inverters feed the transformers (0.4/20 kV) by converting the
dc input voltage in three phase ac voltage (Vinv). Also, the
inverters are the key elements for the active and reactive
power control of the PV plant. By reactive power absorption
(lag/inductive reactive power) or generation (lead/capacitive
reactive power), the inverters control the voltage level at the
common coupling point, around the rated value of 20 kV
(given by the transformers), by lowering it (inductive regime)
or increasing it (capacitive regime). The inverters control the
active (P) and reactive (Q) power using two PI (proportional-
integral) regulators, which were developed based on [14].
The next part of the PV plant, including transformers and
cables, until the common coupling point, is presented in Fig.
2. The switch breaker BRK_SM is used to simulate the PV
plant operation during the night, by putting the inverters in
“night mode”.
Active power losses and reactive power contributions of
transformers and cables can be determined using the meters
(P, Q and V) found in Fig. 2. The active power P is calculated
with the equation [21]-[22]:
)cos(3 ϕ⋅⋅⋅= IVP , (1)
where V is the phase to ground RMS voltage, I is the RMS
line current and φ is the power factor angle.
The reactive power Q is calculated with the equation [21]-
[22]:
)sin(3 ϕ⋅⋅⋅= IVQ , (2)](https://image.slidesharecdn.com/36-pvplant-modeling-gorgan-200729082629/85/36-p-vplant-modeling-gorgan-3-320.jpg)
![where V is the phase to ground RMS voltage, I is the RMS
line current and φ is the power factor angle. The total reactive
power absorbed by the transformer (ΔQt) is calculated with
the equation [21]-[22]:
( ) ( ) 2
0
2
0
222
0 PnSiscPnSscukQscQtQ −⋅+−⋅=Δ+Δ=Δ , (3)
where ΔQsc [kVAr] is the reactive power absorbed by the
transformer during operation, ΔQ0 [kVAr] – the no-load
reactive power absorbed by the transformer, k [%] – load, usc
[%] – shortcircuit voltage, i0 [%] – the magnetizing current,
Sn [kVA] – the rated power, Psc [kW] – the active power load
losses and P0 [kW] – the active power no-load losses.
The total reactive power generated by the cable (ΔQc) is
calculated with the equation [21]-[22]:
2
32
2
3 VfCVC
c
Q ⋅⋅⋅⋅=⋅⋅⋅=Δ πω , (4)
where C [F] is the cable capacity, ω [rad/s] – the angular
frequency, V [V] – the grid voltage, f [Hz] – the grid
frequency.
The total active power loss of the transformer (ΔPt) is
calculated with the equation [21]-[22]:
0
2
0 PscPkPscPtP +⋅=+Δ=Δ , (5)
where ΔPsc [kW] is the active power loss of the transformer
during operation, P0 [kVAr] – the active power no-load
losses, k [%] – load and Psc [kW] – the active power load
losses.
The total active power loss of the cable (ΔPc) is calculated
with the equation [21]-[22]:
2
3
.
3
2
3 ⎟
⎠
⎞
⎜
⎝
⎛
⋅
⋅⋅=⋅⋅=Δ
V
nSk
RlIRcP , (6)
where R [Ω] is the cable resistance, Il [A] – the grid line
current, k [%] – load, Sn [kVA] – the rated power and V [V] –
the grid voltage. The grid model is presented in Fig. 3 and it
consists of a power substation with rated voltage of 110 kV, a
20 MVA power transformer (110/20 kV) and line consumers
(represented by a 5 MVA transformer).
III. RESULTS AND DISCUSSIONS
In this section, the P-Q charts in the common coupling
point, using the simplified and the complex PV plant models
are determined. The simulation is faster for the simplified
model due to the absence of cables and transformers. When
these are taken into account, the simulation time increases by
10 %.
In Fig. 4 the P-Q curve for one inverter, given by the
manufacturer, is presented.
Fig. 4. P-Q capability curve for one inverter.
It can be seen that the active power at grid voltages of (1-
1.1) Vn (respectively, 20-22 kV) is greater than if the value is
0.9 Vn (18 kV). This type of inverter can supply a reactive
power value of maximum ±9 kVAr. This capability curve was
extended for the entire PV plant and was used for all the
simulations.
For each level of solar radiation between 0 and 1000 W/m2
and cell temperature of 25 o
C, the active and reactive power
desired at steady state have been established at inverters
output, according to the capability curve presented in Fig. 4.
Then, in steady state regime, the reactive power contributions
of transformers and cables in CCP were determined, by
reading the monitors values in Fig. 2.
The results of the two models (with and without
transformers and cables reactive power contributions) are
presented in Tables I-III and Figs. 5 - 6. For grid voltages of
20, 18 and 22 kV, the P-Q charts in CCP are presented (Figs.
5 - 6). The corresponding voltage levels were simulated by
modifying the secondary voltage of the transformers from the
grid model.
A. P-Q chart in CCP at grid voltage V = 20 kV
Table I and Fig. 5 present the models’ results in CCP for
grid voltage V = 20 kV. The values for reactive power at the
common coupling point, when the model does not take into
account the contributions of transformers and cables, are
smaller than the values for the case when the model is
completed with the respective contribution. The differences
are up to 0.4 MVAr, on inductive regime. On the capacitive
regime, at the same voltage, the differences between the
reactive power values are up to 0.3 MVAr. At full power, the
transformers’ losses have high values, in comparison with
cables’ losses. This is the reason that the differences between
the two models are bigger on the inductive part. Thus, the
reactive power contributions at CCP level of transformers and
cables have to be taken into account.
According to Romania’s current grid codes, the maximum
active power values at which the PV plant can operate are P =
5.63 MW (inductive regime) and P = 5.39 MW (capacitive
regime). The power limitations were done based on the
complex model’s results. To limit the PV plant output power](https://image.slidesharecdn.com/36-pvplant-modeling-gorgan-200729082629/85/36-p-vplant-modeling-gorgan-5-320.jpg)
![is one possibility, the other being the installation of additional
compensation devices, which can supply the necessary
reactive power, so that the limitation line can be heightened
closer to the rated active power (P = 6.09 MW). On the other
hand, as it can be seen in Fig. 5, the necessary reactive power
of these devices should be approximately 3 MVAr, on both
inductive and capacitive regimes. During the night (P = 0),
the reactive power resulted from the simulation (given by
transformers and cables), by opening the switch breaker
BRK_SM (Fig. 2), is Q = 84 kVAr capacitive (Table I),
which has to be compensated by installing a coil with the
same reactive power value. The reactive power given by the
simplified model is zero, because the contributions of the
reactive components are neglected (Table I).
TABLE I
ACTIVE (P) AND REACTIVE (Q) POWER IN CCP WITH AND
WITHOUT TAKING INTO ACCOUNT TRANSFORMERS AND
CABLES INFLUENCE AT V = 20 KV.
Solar
radiation
[W/m2
]
P CCP
cap
[MW]
P
CCP
ind
[MW]
Q CCP
cap
[MVAr]
Q CCP
ind
[MVAr]
Q CCP
cap – no
transformers
and cables
[MVAr]
Q CCP
ind - no
transformers
and cables
[MVAr]
0 -0.007 -0.007 0.084 0.084 0 0
100 0.126 0.126 3.609 -3.702 3.561 -3.456
200 0.872 0.872 3.686 -3.667 3.639 -3.422
300 1.616 1.616 3.596 -3.693 3.548 -3.449
400 2.328 2.328 3.552 -3.706 3.45 -3.412
500 3.076 3.076 3.52 -3.73 3.387 -3.409
600 3.591 3.591 3.489 -3.799 3.315 -3.441
670 4.035 4.035 3.424 -3.84 3.215 -3.449
700 4.206 4.206 3.441 -3.85 3.217 -3.448
800 4.905 4.905 3.368 -3.909 3.088 -3.457
870 5.382 5.382 2.785 -3.333 2.501 -2.877
900 5.436 5.436 2.488 -3.059 2.202 -2.601
940 5.666 5.666 1.903 -2.49 1.615 -2.032
975 5.928 5.928 0.972 -1.561 0.679 -1.098
1000 5.978 5.978 -0.428 -0.428 -0.726 0.038
Fig. 5. P-Q diagram in CCP at grid voltage V = 20 kV. Comparison between
the models with and without taking into account the transformers and cables
reactive power contributions.
B. P-Q chart in CCP at grid voltages V = 18 kV and V = 22 kV
Tables II-III and Fig. 6 present the models’ results in CCP
for grid voltages V = 18 kV (capacitive regime) and V = 22
kV (inductive regime). The inductive regime for V = 18 kV
was not simulated because it would decrease the voltage in
CCP below the existing relay protection at minimum voltage.
Also, the capacitive regime for V = 22 kV was not simulated
because it would increase the voltage in CCP above the
existing relay protection at maximum voltage.
The differences between the two models’ values are up to
0.42 MVAr, on inductive regime (V = 22 kV). On the
capacitive regime, at V = 18 kV, the differences between the
reactive power values are up to 0.43 MVAr.
According to Romania’s current grid codes, the maximum
active power values at which the PV plant can operate are P =
5.64 MW (inductive regime) and P = 4.9 MW (capacitive
regime). To operate at full power with respect to Romania’s
grid codes, as it can be seen in Fig. 6, the necessary reactive
power of the compensation devices should be approximately
3 MVAr, on inductive regime and 2.5 MVAr on capacitive
regime.
TABLE II
ACTIVE (P) AND REACTIVE (Q) POWER IN CCP WITH AND
WITHOUT TAKING INTO ACCOUNT TRANSFORMERS AND
CABLES INFLUENCE AT V = 18 KV, CAPACITIVE REGIME.
Solar
radiation
[W/m2
]
P CCP
cap
[MW]
Q CCP
cap
[MVAr]
Q CCP cap -
no transformers and cables
[MVAr]
0 -0.005 0.07 0
100 0.1 3.585 3.338
200 0.692 3.579 3.328
300 1.392 3.579 3.313
400 2.019 3.549 3.259
500 2.626 3.508 3.19
600 3.186 3.468 3.118
670 3.601 3.429 3.055
814 4.499 2.794 2.381
880 4.919 2.201 1.777
940 5.255 1.416 0.984
1000 5.438 -0.408 -0.846
TABLE III
ACTIVE (P) AND REACTIVE (Q) POWER IN CCP WITH AND
WITHOUT TAKING INTO ACCOUNT TRANSFORMERS AND
CABLES INFLUENCE AT V = 22 KV, INDUCTIVE REGIME.
Solar
radiation
[W/m2
]
P CCP
ind
[MW]
Q CCP
ind
[MVAr]
Q CCP ind -
no transformers and cables
[MVAr]
0 -0.008 0.112 0
100 0.204 -3.598 -3.334
200 0.912 -3.62 -3.352
300 1.743 -3.621 -3.343
400 2.256 -3.652 -3.356
500 2.918 -3.662 -3.345
600 3.683 -3.677 -3.325
670 3.984 -3.712 -3.346
700 4.3 -3.73 -3.347
800 4.917 -3.78 -3.363
870 5.278 -3.204 -2.784
900 5.43 -2.913 -2.493
940 5.648 -2.348 -1.93
975 5.929 -1.418 -0.996
1000 5.975 -0.227 0.195](https://image.slidesharecdn.com/36-pvplant-modeling-gorgan-200729082629/85/36-p-vplant-modeling-gorgan-6-320.jpg)
![Fig. 6. P-Q diagram in CCP at grid voltages V = 18 kV (capacitive regime)
and V = 22 kV (inductive regime). Comparison between the models with and
without taking into account the transformers and cables reactive power
contributions.
During the night (P = 0), the reactive power resulted from
the simulation (given by transformers and cables), by opening
the switch breaker BRK_SM (Fig. 2), is Q = 70 kVAr
capacitive, at V = 18 kV (Table II) and Q = 112 kVAr
capacitive, at V = 22 kV (Table III) which has to be
compensated by installing a coil with the same reactive power
value. The reactive power given by the simplified model is
zero (Tables II and III - when solar radiation is zero), because
the contributions of the reactive components are neglected.
IV. CONCLUSIONS
The models presented in this paper, can be used to study
the integration of photovoltaic power plants in the power
system grid, according to the existing regulations (codes). It
is also the first complete study regarding grid integration of
MW-type PV plants, the other previous models studying kW-
type PV plants, which present fewer simulation issues and
constraints.
The reactive power contributions of transformers and
cables have to be taken into account, due to their importance
in the reactive power value obtained at the common coupling
point with the grid. The complex model is more appropriate
to be used for the simulation of a real photovoltaic power
plant.
REFERENCES
[1] F. Vatra, C. A. Vatra, P. Postolache, A. Poida, “Integrarea si
functionarea centralelor eoliene si a instalatiilor fotovoltaice in sistemul
electroenergetic (Wind and PV Power Plants Integration and Function
in the Electro-energetic System)”, SIER Publishing House; 2012,
Bucharest.
[2] M. Mao, P. Jin, L. Chang, H. Xu, “Economic Analysis and Optimal
Design on Microgrids with SS-PVs for Industries” IEEE Transactions
on Sustainable Energy, 2014, vol. 5, no. 4, pp. 1328-1336.
[3] A. Bonfiglio, M. Brignone, F. Delfino, R. Procopio, “Optimal Control
and Operation of Grid-Connected Photovoltaic Production Units for
Voltage Support in Medium-Voltage Networks”, IEEE Transactions on
Sustainable Energy, 2014. vol. 5, no. 1, pp. 254-563.
[4] A. Ellis, R. Nelson, E. Von Engeln, R. Walling, J. MacDowell, L.
Casey, E. Seymour, W. Peter, C. Barker, B. Kirby, J. R. Williams,
“Review of Existing Reactive Power Requirements for Variable
Generation”, IEEE Power Energy Soc. General Meeting, 2012, pp. 1–7.
[5] E. Troester, “New German Grid Codes for Connecting PV Systems to
the Medium Voltage Power Grid”, 2nd
International Workshop on
Concentrating Photovoltaic Power Plants: Optical Design, Production,
Grid Connection, 2008, pp. 1-4.
[6] The National Energy Regulatory Authority, “Procedure on Power
Connection for the Trial Period and Certification of the Technical
Compliance of Wind and Photovoltaic Power Plants”, Bucharest, no.
74/2013.
[7] The National Energy Regulatory Authority, “Procedure on Power
Connection for the Trial Period and Certification of the Technical
Compliance of Wind and Photovoltaic Power Plants”, Bucharest, no.
59/2014.
[8] F. Bizzarri, M. Bongiorno, A. Brambilla, G. Gruosso, G. S. Gajani,
“Model of Photovoltaic Power Plants for Performance Analysis and
Production Forecast”, IEEE Transactions on Sustainable Energy; 2013,
vol. 4, no. 2, pp. 278-285.
[9] M. Marinelli, P. Maule, A. N. Hahmann, O. Gehrke, P. B. Nogard, N.
A. Cutululis, “Wind and Photovoltaic Large-Scale Regional Models for
Hourly Production Evaluation”, IEEE Transactions on Sustainable
Energy, 2014, vol. PP, no. 99, pp. 1-8.
[10] S. Li, T. A. Haskew, D. Li, F. Hu, “Integrating photovoltaic and power
converter characteristics for energy extraction study of solar PV
systems”, Renewable Energy Journal, 2011, pp. 3238-3245.
[11] E. M. Natsheh, A. Albarbar, J. Yazdani, “Modeling and Control for
Smart Grid Integration of Solar/Wind Energy Conversion System”,
2011, 2nd
IEEE PES International Conference and Exhibition on
Innovative Smart Grid Technologies, pp. 1-8.
[12] J. R. Rodriguez, F. Ruiz, D. Biel, F. Guinjoan, “Simulation and
Analysis of Distributed PV Generation in a LV Network Using
MATLAB-Simulink”, Proceedings of IEEE International Symposium
on Circuit and Systems (ISCAS), 2010, pp. 2322-2325.
[13] W. Muneer, K. Bhattacharya, C. A. Canizares, “Large-Scale Solar PV
Investment Models, Tools, and Analysis: The Ontario Case”, IEEE
Transactions on Power Systems; 2011, vol. 26, no. 4, pp. 2547-2555.
[14] A. Kalbat, “PSCAD Simulation of Grid-Tied Photovoltaic Systems and
Total Harmonic Distortion Analysis”, 3rd
International Conference on
Electric Power and Energy Conversion Systems, Yildiz Technical
University, Istanbul, Turkey, 2013, pp. 1-6.
[15] W. Xiao, K. Torchyan, M. S. El Moursi, J. L. Kirtley, “Online
Supervisory Voltage Control for Grid Interface of Utility-Level PV
Plants”, IEEE Transactions on Sustainable Energy, 2014, vol. 5, no. 3,
pp. 843-853.
[16] P. Thounthong, A. Luksanasakul, P. Koseeyaporn, B. Davat,
”Intelligent Model-Based Control of a Standalone Photovoltaic/Fuel
Cell Power Plant With Supercapacitor Energy Storage”, IEEE
Transactions on Sustainable Energy; 2012, vol. 4, no. 1, pp. 240-249.
[17] Y. Y. Hong, R. C Lian, “Optimal Sizing of Hybrid Wind/PV/Diesel
Generation in a Stand-Alone Power System Using Markov-Based
Genetic Algorithm”, IEEE Transactions on Power Delivery, 2012, vol.
27, no. 2, pp. 640-647.
[18] J. Kabouris, G. C. Contaxis, “Autonomus System Expansion Planning
Considering Renewable Energy Sources – A Computer Package”, IEEE
Transactions on Energy Conversion, 1992, vol. 7, no. 3, pp. 374-381.
[19] C. H. Lin, W. L. Hsieh, C. S. Chen, C. T. Hsu, T. T. Ku, C. T. Tsai,
“Financial Analysis of a Large-Scale Photovoltaic System and Its
Impact on Distribution Feeders”, IEEE Transactions on Industry
Applications, 2011, vol. 47, no. 4, pp. 1884-1891.
[20] W. Xiao, F. F. Edwin, G. Spagnuolo, J. Jatskevich, “Efficient
Approaches for Modeling and Simulating Photovoltaic Power
Systems”, IEEE Journal of Photovoltaics, 2013, vol. 3, no. 1, pp. 500-
508.
[21] PSCAD X4 (v4.5.2) User Guide.
[22] C. Bala, Electrical Machines, EDP Publishing House, Bucharest, 1982.
View publication statsView publication stats](https://image.slidesharecdn.com/36-pvplant-modeling-gorgan-200729082629/85/36-p-vplant-modeling-gorgan-7-320.jpg)