Download to read offline

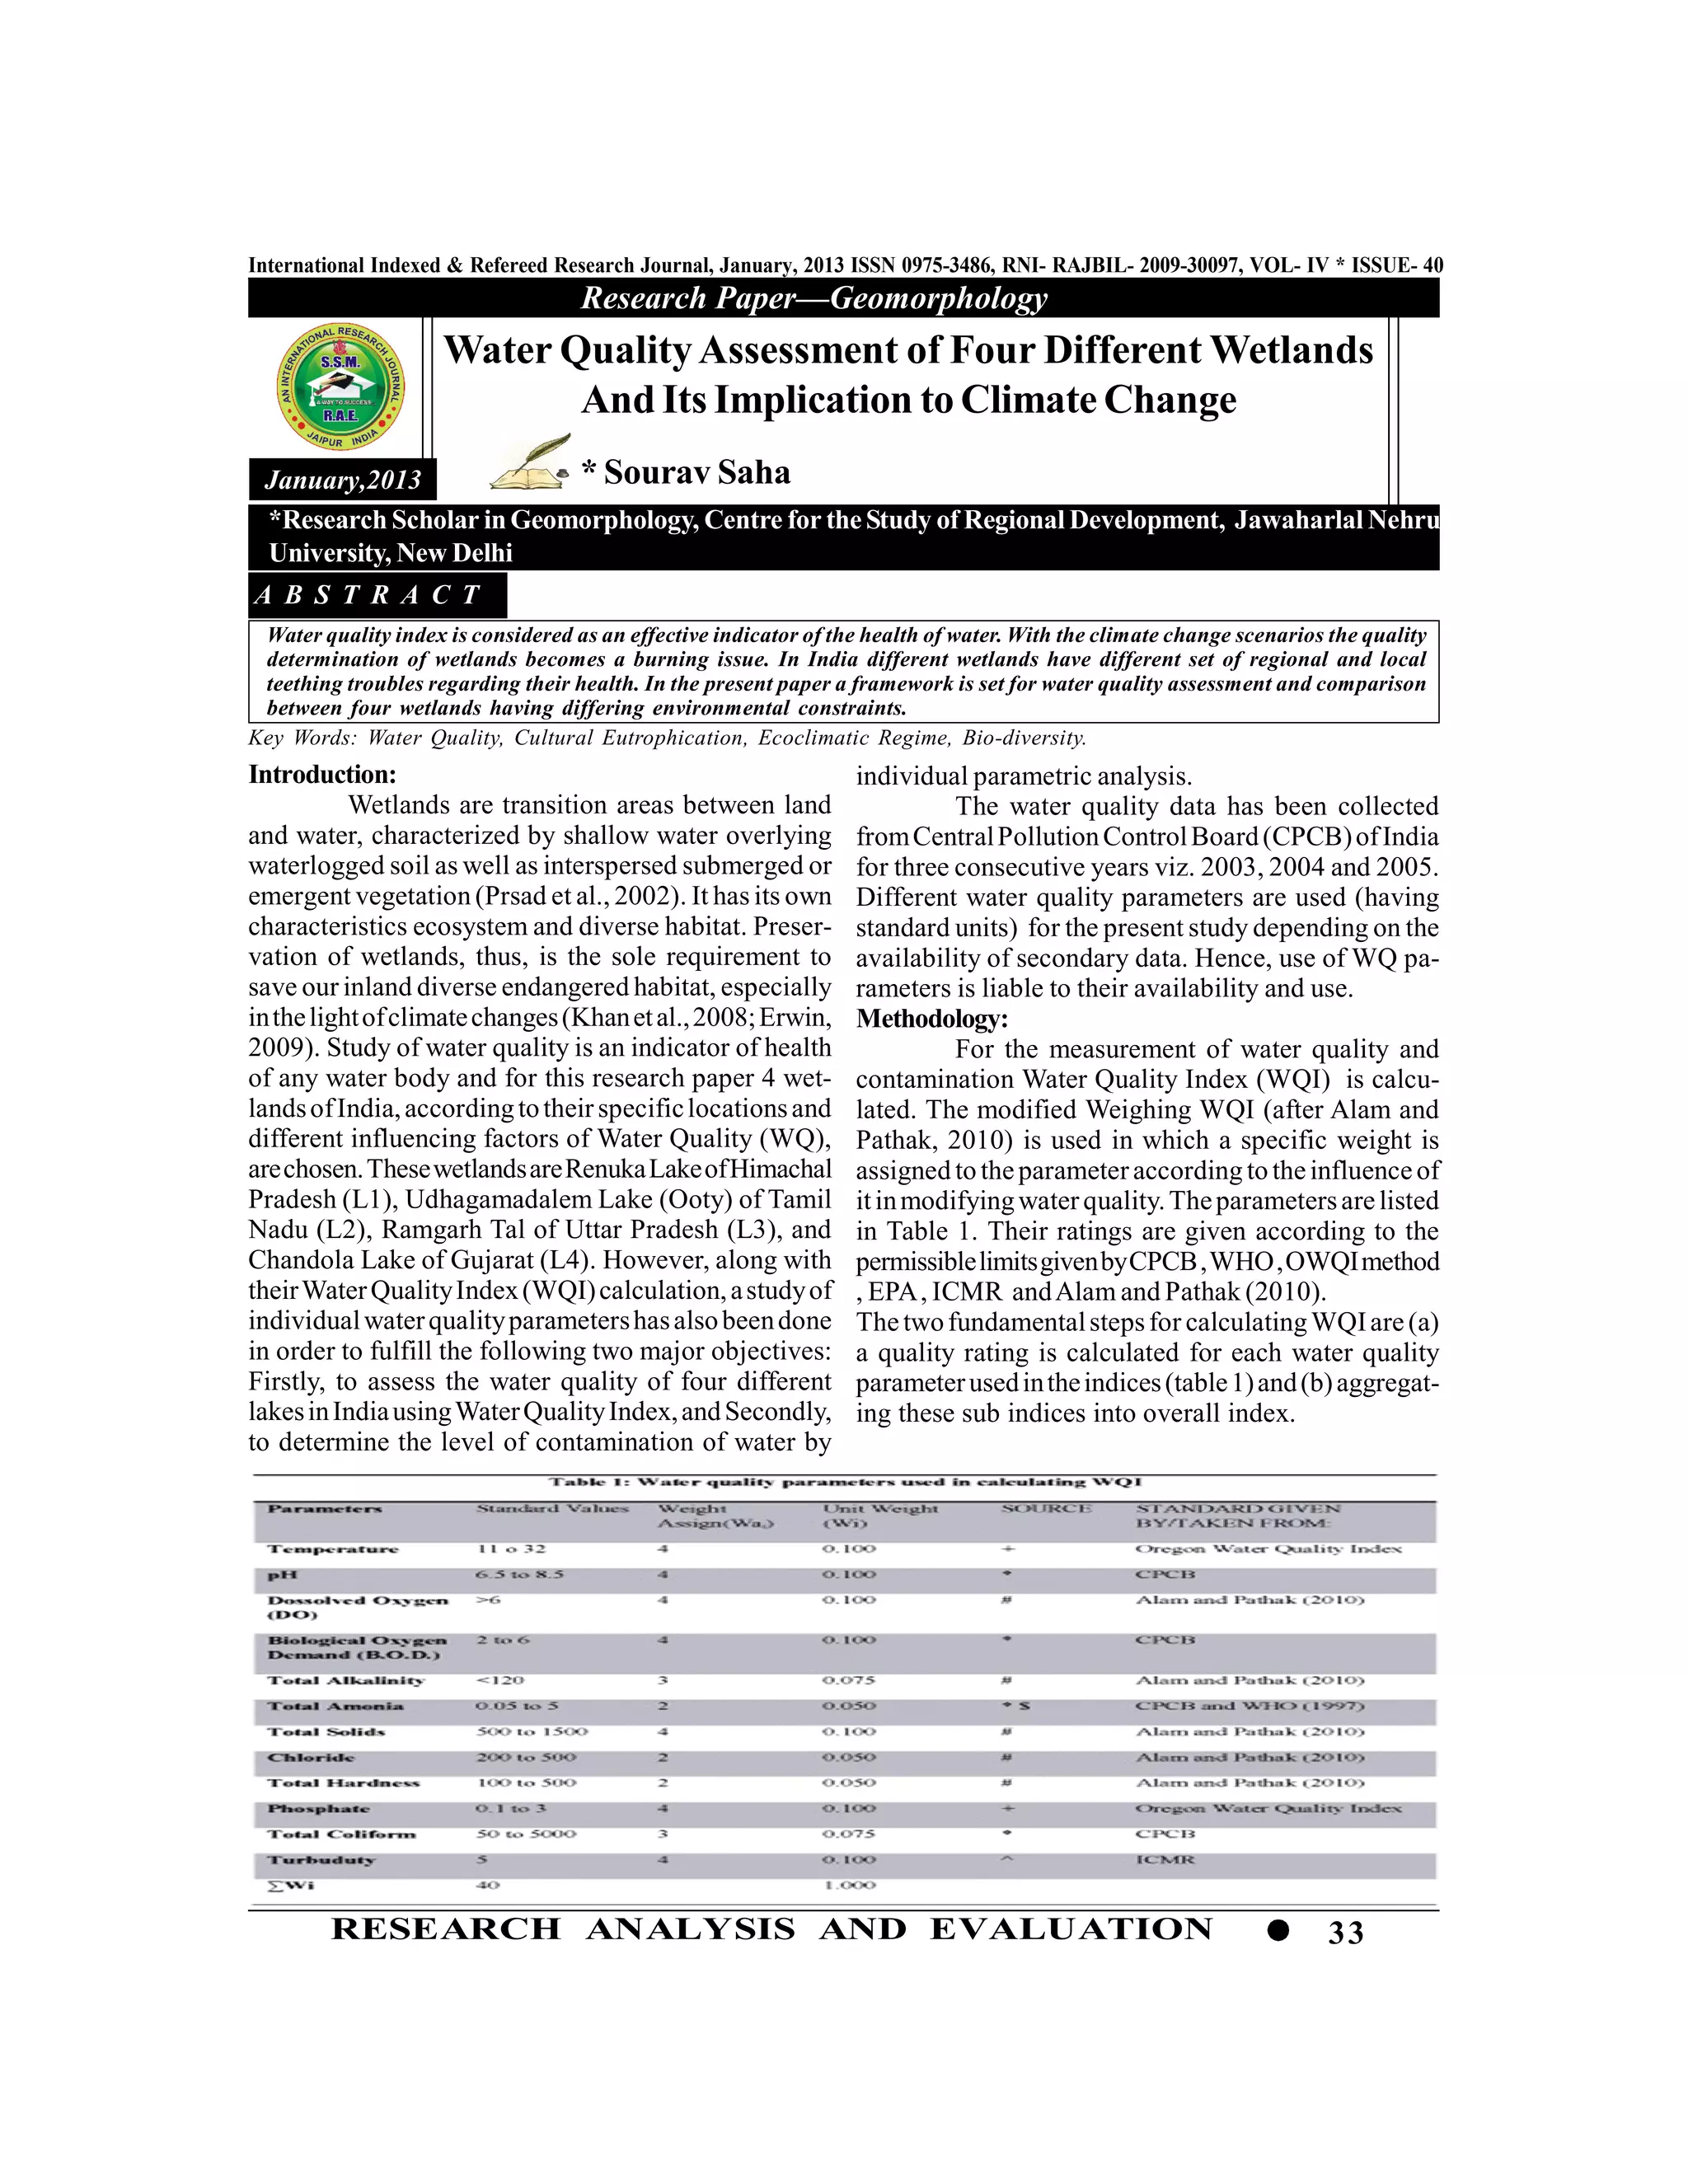
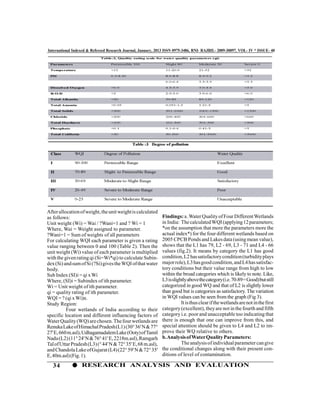
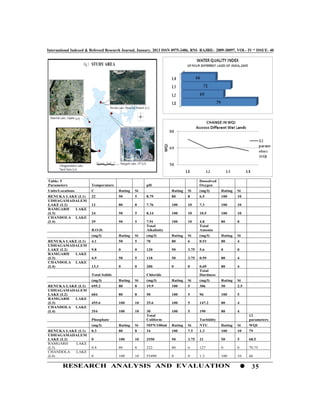
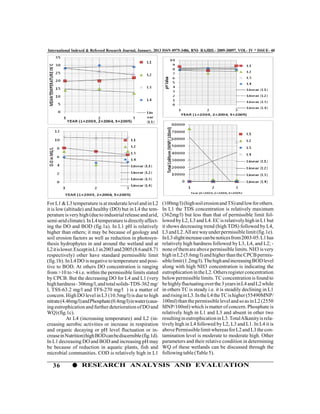
This document analyzes the water quality of four wetlands in India using water quality index calculations and analysis of individual water quality parameters. Water quality index values were calculated for each wetland based on data from 2003-2005. Renuka Lake had the highest water quality index of 79, indicating good quality, while Chandola Lake had the lowest at 66, indicating satisfactory quality. Analysis of parameters like dissolved oxygen, BOD, turbidity, and coliform levels showed variations between the wetlands and opportunities for improving water quality.