This document discusses Quintiles' third quarter 2014 earnings call. Some key points:
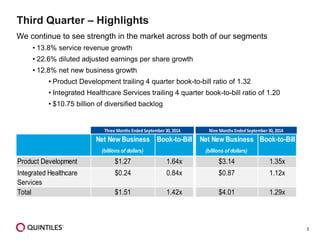
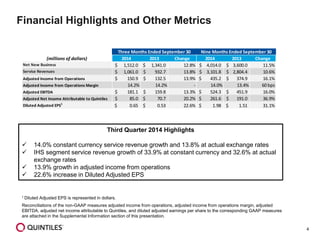
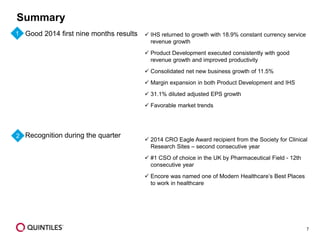
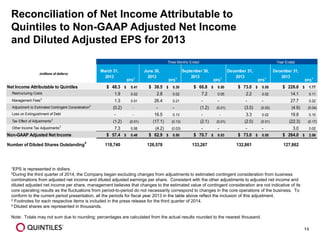
- Service revenue grew 13.8% and diluted adjusted earnings per share grew 22.6% compared to the third quarter of 2013.
- Net new business growth was 12.8% and the backlog was $10.75 billion.
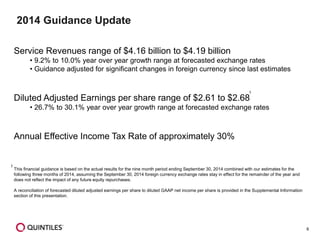
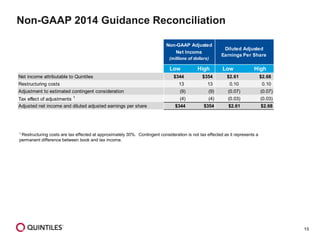
- Guidance for full year 2014 expects service revenue growth between 9.2-10% and diluted adjusted EPS growth between 26.7-30.1%.
The quarterly PowerPoint slide deck sent to investors for 1Q16, from CONE Midstream. CONE is a joint venture between CONSOL Energy and Noble Energy with pipelines exclusively in the Marcellus/Utica region.
Shutterfly Earnings for 1Q 2014 released after market close today. Released in tandem with their conference call - which starts in about 20 minutes: http://www.media-server.com/m/p/o42tycb9
Looks like they beat by $0.05 and gave updated guidance more or less in-line with consensus. Note that Goldman upgraded the stock 2 weeks ago...
Twitter Q1 2014 Investor Presentation - First Ever TWTR Public Quarterly Resultslonelybrand
This presentation and the accompanying press release and conference call contain “forward-looking” statements about Twitter (TWTR) that are based on our management’s beliefs and assumptions and on information currently available to management. Forward-looking statements include statements about expected financial metrics, such as revenue, non-GAAP adjusted EBITDA and EPS, as well as non-financial metrics, such as average monthly active users, mobile monthly active users and timeline views, for the second quarter of 2014, the full fiscal year and beyond. They also include statements about our possible or assumed business strategies, competitive position, industry environment, potential growth opportunities, potential market opportunities and the effects of competition.
Forward-looking statements include all statements that are not historical facts and can be identified by terms such as “anticipates,” “believes,” “could,” “seeks,” “estimates,” “intends,” “may,” “plans,” “potential,” “predicts,” “projects,” “should,” “will,” “would” or similar expressions and the negatives of those terms. Forward-looking statements involve known and unknown risks, uncertainties and other factors that may cause our actual results, performance or achievements to be materially different from any future results, performance or achievements expressed or implied by the forward-looking statements. For a discussion of these risks, you should read our filings with the Securities and Exchange Commission (SEC), including our Annual Report on Form 10-K that was filed with the SEC on March 6, 2014 and the 10-Q for the quarter ended March 31, 2014 that will be filed with the SEC. In addition, please note that the date of this presentation is April 29, 2014, and any forward-looking statements contained herein are based on assumptions that we believe to be reasonable as of this date. Except as required by law, we assume no obligation to update these forward-looking statements publicly, or to update the reasons actual results could differ materially from those anticipated in the forward-looking statements, even if new information becomes available in the future.
This presentation includes certain non-GAAP financial measures as defined by SEC rules. As required by Regulation G, we have provided a reconciliation of those measures to the most directly comparable GAAP measures, which is available in the Appendix.
Hot off the presses...Twitter's performance for the first quarter of 2014 in a handy powerpoint deck style format. Impressive quarter and the numbers look like they beat street estimates, but looks like they didn't blow it out like people thought they were...
The E-Way Bill revolutionizes logistics by digitizing the documentation of goods transport, ensuring transparency, tax compliance, and streamlined processes. This mandatory, electronic system reduces delays, enhances accountability, and combats tax evasion, benefiting businesses and authorities alike. Embrace the E-Way Bill for efficient, reliable transportation operations.
World economy charts case study presented by a Big 4
World economy charts case
World economy charts case study presented by a Big 4
World economy charts case study presented by a Big 4World economy charts case study presented by a Big 4
World economy charts case study presented by a Big 4
World economy charts case study presented by a Big 4World economy charts case study presented by a Big 4World economy charts case study presented by a Big 4World economy charts case study presented by a Big 4World economy charts case study presented by a Big 4World economy charts case study presented by a Big 4World economy charts case study presented by a Big 4World economy charts case study presented by a Big 4World economy charts case study presented by a Big 4World economy charts case study presented by a Big 4World economy charts case study presented by a Big 4World economy charts case study presented by a Big 4World economy charts case study presented by a Big 4World economy charts case study presented by a Big 4study presented by a Big 4
MUTUAL FUNDS (ICICI Prudential Mutual Fund) BY JAMES RODRIGUESWilliamRodrigues148
Mutual funds are investment vehicles that pool money from multiple investors to purchase a diversified portfolio of stocks, bonds, or other securities. They are managed by professional portfolio managers or investment companies who make investment decisions on behalf of the fund's investors.
2. 2
Forward Looking Statements and Use of Non-GAAP Financial Measures
This presentation contains forward-looking statements within the meaning of Section 27A of the Securities Act of 1933, as amended and Section 21E of the Securities Exchange Act of 1934, as amended. Such forward-looking statements reflect, among other things, the Company’s current expectations and anticipated results of operations, all of which are subject to known and unknown risks, uncertainties and other factors that may cause actual results, performance or achievements, market trends or industry results to differ materially from those expressed or implied by such forward-looking statements. Therefore, any statements contained herein that are not statements of historical fact may be forward-looking statements and should be evaluated as such. Without limiting the foregoing, the words “anticipates,” “believes,” “estimates,” “expects,” “intends,” “may,” “plans,” “projects,” “should,” “guidance,” “targets,” “will” and the negative thereof and similar words and expressions are intended to identify forward-looking statements. Actual results may differ materially from the Company’s expectations due to a number of factors, including that most of the Company’s contracts may be terminated on short notice, the Company may be unable to maintain large customer contracts or to enter into new contracts, the Company may under- price its contracts, overrun its cost estimates, or fail to receive approval for or experience delays in documenting change orders, the historical indications of the relationship of backlog to revenues may not be indicative of their future relationship, the Company is subject to the complex and changing regulatory and international environments in which the Company operates, the Company may be unable to successfully identify, acquire and integrate businesses, the Company’s substantial indebtedness, and other risks more fully set forth in the Company's filings with the SEC, including the Company’s annual report on Form 10-K for the fiscal year ended December 31, 2013, filed with the SEC on February 13, 2014, as such factors may be amended or updated from time to time in the Company’s periodic filings with the SEC, which are accessible on the SEC's website at www.sec.gov. The Company assumes no obligation to update any forward-looking statement after the date of this presentation, whether as a result of new information, future developments or otherwise.
This presentation includes financial measures not prepared in accordance with accounting principles generally accepted in the United States (“GAAP”).Management believes that these non-GAAP financial measures provide useful supplemental information to management and investors regarding the underlying performance of the Company’s business operations and are more indicative of core operating results as they exclude certain items whose fluctuations from period-to-period do not necessarily correspond to changes in the core operations of the Company’s business.Investors and potential investors are encouraged to review the reconciliations of the non-GAAP financial measures to their most directly comparable GAAP measures attached to this presentation.
3. 3
Third Quarter –Highlights
We continue to see strength in the market across both of our segments
•13.8% service revenue growth
•22.6% diluted adjusted earnings per share growth
•12.8% net new business growth
•Product Development trailing 4 quarter book-to-bill ratio of 1.32
•Integrated Healthcare Services trailing 4 quarter book-to-bill ratio of 1.20
•$10.75 billion of diversified backlog
Net New BusinessNet New Business(billions of dollars) (billions of dollars) Product Development $1.27 1.64x$3.14 1.35xIntegrated Healthcare Services $0.24 0.84x$0.87 1.12xTotal $1.51 1.42x$4.01 1.29xThree Months Ended September 30, 2014Book-to-Bill Nine Months Ended September 30, 2014Book-to-Bill
4. 4
Financial Highlights and Other Metrics
Third Quarter 2014 Highlights
14.0% constant currency service revenue growth and 13.8% at actual exchange rates
IHS segment service revenue growth of 33.9% at constant currency and 32.6% at actual exchange rates
13.9% growth in adjusted income from operations
22.6% increase in Diluted Adjusted EPS
1 Diluted Adjusted EPS is represented in dollars.
Reconciliations of the non-GAAP measures adjusted income from operations, adjusted income from operations margin, adjusted EBITDA, adjusted net income attributable to Quintiles, and diluted adjusted earnings per share to the corresponding GAAP measures are attached in the Supplemental Information section of this presentation.
(millions of dollars)20142013Change20142013ChangeNet New Business1,512.0$ 1,341.0$ 12.8%4,014.0$ 3,600.0$ 11.5% Service Revenues1,061.0$ 932.7$ 13.8%3,101.8$ 2,804.4$ 10.6% Adjusted Income from Operations150.9$ 132.5$ 13.9%435.2$ 374.9$ 16.1% Adjusted Income from Operations Margin14.2%14.2%-14.0%13.4%60 bpsAdjusted EBITDA181.1$ 159.8$ 13.3%524.3$ 451.9$ 16.0% Adjusted Net Income Attributable to Quintiles85.0$ 70.7$ 20.2%261.6$ 191.0$ 36.9% Diluted Adjusted EPS10.65$ 0.53$ 22.6%1.98$ 1.51$ 31.1% Three Months Ended September 30Nine Months Ended September 30
5. 5
Segment Performance
Service Revenues and Income from Operations
$ Millions
$ Millions
Product Development
0
200
400
600
800
1,000
$771.4
$714.2
$158.2
$140.6
0
200
400
600
800
1,000
$778.4
$659.7
$40.5
$30.4
$ Millions
0
100
200
300
$289.6
$218.5
$19.9
$11.7
$ Millions
Integrated Healthcare Services
Certain costs are not allocated to the Company’s segments and are reported as general corporate and unallocated expenses. These costs primarily consist of share-based compensation and expenses for corporate overhead functions such as finance, human resources, information technology, facilities and legal. The Company does not allocate restructuring or impairment charges to its segments.
0
500
1,000
1,500
2,000
2,500
3,000
$2,323.4
$2,144.7
$477.2
$409.4
ActualConstant1ActualConstant1
Revenue Growth8.0%7.9% Revenue Growth32.6%33.9%
Operating Income Growth12.5%10.6%Operating Income Growth70.5% 81.0%
1The constant currency calculation is provided in the Supplemental Information section of this presentation.
Three Months Ended
September 30
Nine Months Ended
September 30
Three Months Ended
September 30
Nine Months Ended
September 30
2014
2013
OperatingIncome Margin 20.5% 19.7%
Operating Income Margin 6.9% 5.3%
2014
2013
OperatingIncome Margin 20.5% 19.1%
Operating Income Margin 5.2% 4.6%
Revenues
Operating Income
ActualConstant1ActualConstant1
Revenue Growth8.3%7.7% Revenue Growth18.0%18.9%
Operating Income Growth16.6%11.6%Operating Income Growth33.3% 44.2%
6. 6
2014 Guidance Update
Service Revenues range of $4.16 billion to $4.19 billion
•9.2% to 10.0% year over year growth range at forecasted exchange rates
•Guidance adjusted for significant changes in foreign currency since last estimates
Diluted Adjusted Earnings per share range of $2.61 to $2.68
•26.7% to 30.1% year over year growth range at forecasted exchange rates
Annual Effective Income Tax Rate of approximately 30%
This financial guidance is based on the actual results for the nine month period ending September 30, 2014 combined with our estimates for the following three months of 2014, assuming the September 30, 2014 foreign currency exchange rates stay in effect for the remainderof the year and does not reflect the impact of any future equity repurchases.
A reconciliation of forecasted diluted adjusted earnings per share to diluted GAAP net income per share is provided in the Supplemental Information section of this presentation.
1
1
7. 7
Summary
Good 2014 first nine months results
Recognition during the quarter
IHS returned to growth with 18.9% constant currency service revenue growth
Product Development executed consistently with good revenue growth and improved productivity
Consolidated net new business growth of 11.5%
Margin expansion in both Product Development and IHS
31.1% diluted adjusted EPS growth
Favorable market trends
2014 CRO Eagle Award recipient from the Society for Clinical Research Sites –second consecutive year
#1 CSO of choice in the UK by Pharmaceutical Field -12th consecutive year
Encore was named one of Modern Healthcare’s Best Places to work in healthcare
1
2
8. 8
Supplemental Information
Constant Currency Reconciliation
Contractual Revenue Currency Mix and Foreign Exchange Analysis
Income Statement Non-GAAP Reconciliation
Adjusted EBITDA Reconciliation
Adjusted Net Income and EPS Reconciliation
Non-GAAP 2014 Guidance Reconciliation
9. 9
Constant Currency Reconciliation
Service Revenues and Income from Operations
The exchange rate impacts on service revenues equals the current period service revenues at actual rates less the current period service revenues for foreign currency denominated
contracts recalculated at the prior period exchange rates, while the exchange rate impacts on expenses equals the current period expenses at actual rates less the current period
expenses recalculated at the prior period exchange rates.
The segment detail presented above excludes general corporate and unallocated expenses and restructuring costs.
(millions of dollars)
Consolidated Actual
Exchange
Impact Constant Actual
Exchange
Impact Constant
Service Revenues $ 3,101.8 $ 7.7 $ 3,094.1 10.6% 0.3% 10.3%
Income from Operations $ 431.5 $ 17.2 $ 414.3 28.7% 5.1% 23.6%
Adjusted Income from Operations $ 435.2 $ 17.2 $ 418.0 16.1% 4.6% 11.5%
Adjusted Income from Operations Margin 14.0% 13.5%
Product Development
Service Revenues $ 2,323.4 $ 13.5 $ 2,309.9 8.3% 0.6% 7.7%
Income from Operations $ 477.2 $ 20.7 $ 456.5 16.6% 5.0% 11.6%
Income from Operations Margin 20.5% 19.8%
Integrated Healthcare Services
Service Revenues $ 778.4 $ (5.8) $ 784.2 18.0% (0.9%) 18.9%
Income from Operations $ 40.5 $ (3.3) $ 43.8 33.3% (10.9%) 44.2%
Income from Operations Margin 5.2% 5.6%
Nine Months Ended September 30 Year on Year Growth
(millions of dollars)
Consolidated Actual
Exchange
Impact Constant Actual
Exchange
Impact Constant
Service Revenues $ 1,061.0 $ (1.9) $ 1,062.9 13.8% (0.2%) 14.0%
Income from Operations $ 149.1 $ 1.2 $ 147.9 19.1% 1.0% 18.1%
Adjusted Income from Operations $ 150.9 $ 1.2 $ 149.7 13.9% 0.9% 13.0%
Adjusted Income from Operations Margin 14.2% 14.1%
Product Development
Service Revenues $ 771.4 $ 0.9 $ 770.5 8.0% 0.1% 7.9%
Income from Operations $ 158.2 $ 2.7 $ 155.5 12.5% 1.9% 10.6%
Income from Operations Margin 20.5% 20.2%
Integrated Healthcare Services
Service Revenues $ 289.6 $ (2.8) $ 292.4 32.6% (1.3%) 33.9%
Income from Operations $ 19.9 $ (1.2) $ 21.1 70.5% (10.5%) 81.0%
Income from Operations Margin 6.9% 7.2%
Three Months Ended September 30 Year on Year Growth
10. 10
1 Other includes a mix of more than 40 currencies.
Contractual Revenue Currency Mix
and Foreign Exchange Analysis
USD Sterling Euro Yen Other1 Total
YTD 2014 $1,907.8 $254.3 $527.0 $320.7 $92.0 $3,101.8
% of total 62% 8% 17% 10% 3% 100%
YTD 2013 $1,774.2 $213.4 $475.8 $274.3 $66.7 $2,804.4
% of total 63% 8% 17% 10% 2% 100%
YTD '14 Average Rate $1.67 $1.36 ¥102.95
YTD '13 Average Rate $1.55 $1.32 ¥96.64
% Increase (Decrease) 7.9% 2.9% (6.1%)
Consolidated Service Revenues (millions of dollars)
USD Sterling Euro Yen Other1 Total
3Q '14 $665.8 $78.6 $169.7 $110.5 $36.4 $1,061.0
% of total 64% 7% 16% 10% 3% 100%
3Q '13 $604.4 $72.1 $153.0 $82.2 $21.0 $932.7
% of total 65% 8% 16% 9% 2% 100%
3Q '14 Average Rate $1.67 $1.33 ¥103.98
3Q '13 Average Rate $1.55 $1.33 ¥98.86
% Increase (Decrease) 7.6% 0.0% (4.9%)
Consolidated Service Revenues (millions of dollars)
11. 11
1 Change in estimated fair value of contingent consideration on business combinations.
2Represents the Company’s change in its permanent reinvestment assertion during 2Q 2013 retroactively applied to1Q 2013 for the new estimated annual
effective income tax rate for 2013.
Note: Totals may not sum due to rounding; percentages are calculated from the actual results rounded to the nearest thousand.
Income Statement
GAAP – Non-GAAP Reconciliation
Nine Months Ended September 30
(millions of dollars)
Selling,
General and
Administrative
Income
from
Operations
Net Income
Attributable
to Quintiles
Selling,
General and
Administrative
Income
from
Operations
Net Income
Attributable
to Quintiles
As Reported $ 657.3 $ 431.5 $ 268.0 $ 627.7 $ 335.3 $ 153.6
Adjustments
Restructuring Costs - 3.7 3.7 - 11.9 11.9
Management Fees - - - (27.7) 27.7 27.7
Adjustment to Estimated Contingent Consideration1 - - (8.8) - - (1.5)
Loss on Extinguishment of Debt - - - - - 16.5
Tax Effect of Adjustments - - (1.3) - - (20.3)
Other Income Tax Adjusments2 - - - - - 3.1
Adjusted Non-GAAP Basis $657.3 $435.2 $261.6 $600.0 $374.9 $191.0
% of Service Revenues 21.2% 14.0% 8.4% 21.4% 13.4% 6.8%
2014 2013
Three Months Ended September 30
(millions of dollars)
Selling,
General and
Administrative
Income
from
Operations
Net Income
Attributable
to Quintiles
Selling,
General and
Administrative
Income
from
Operations
Net Income
Attributable
to Quintiles
As Reported $ 219.0 $ 149.1 $ 92.7 $ 199.6 $ 125.3 $ 66.8
Adjustments
Restructuring Costs - 1.8 1.8 - 7.2 7.2
Adjustment to Estimated Contingent Consideration1 - - (8.8) - - (1.2)
Tax Effect of Adjustments - - (0.7) - - (2.1)
Adjusted Non-GAAP Basis $219.0 $150.9 $85.0 $199.6 $132.5 $70.7
% of Service Revenues 20.6% 14.2% 8.0% 21.4% 14.2% 7.6%
2014 2013
12. 12
(millions of dollars) 2014 2013 2014 2013
Net Income Attributable to Quintiles $ 92.7 $ 66.8 $ 268.0 $ 153.6
Net Income (loss) from Noncontrolling Interests 0.1 (0.2) 0.1 (0.5)
Interest Expense, Net 24.4 27.6 71.7 94.3
Income Tax Expense 41.3 27.5 111.0 68.4
Depreciation and Amortization 30.2 27.3 89.1 77.0
Restructuring Costs 1.8 7.2 3.7 11.9
Management Fees - - - 27.7
Loss on Extinguishment of Debt - - - 16.5
Other Income (7.8) 3.2 (9.6) 1.4
(Earnings) Losses from Unconsolidated Affiliates (1.5) 0.4 (9.8) 1.6
Non-GAAP Adjusted EBITDA $ 181.1 $ 159.8 $ 524.3 $ 451.9
% of Service Revenues 17.1% 17.1% 16.9% 16.1%
Three Months Ended September 30 Nine Months Ended September 30
Reconciliation of Net Income Attributable to
Quintiles to Non-GAAP Adjusted EBITDA
1Includes $8.8 million of income for change in estimated fair value of contingent consideration on business combinations.
Note: Totals may not sum due to rounding; percentages are calculated from the actual results rounded to the nearest thousand.
1
13. 13
Reconciliation of Net Income Attributable to Quintiles to Non-GAAP Adjusted Net Income and Diluted Adjusted EPS
1 EPS is represented in dollars.
2The tax effect of adjustments was based on the income tax rate of the respective transactions, which was 38.5%, with the exception of i) restructuring costs which were tax effected at 39.3% and 27.5% during the three months ended September 30, 2014 and 2013, respectively, and 34.6% and 27.5% during the nine months ended September 30, 2014 and 2013, respectively and ii) contingent consideration which is not tax effected as it represents a permanent difference between book and tax income.
3 Represents the Company’s change in its permanent reinvestment assertion during 2Q 2013 retroactively applied to1Q 2013 for the new estimated annual effective income tax rate for 2013.
4 Diluted shares are represented in thousands.
Note: Totals may not sum due to rounding; percentages are calculated from the actual results rounded to the nearest thousand.
(millions of dollars)2014EPS12013EPS12014EPS12013EPS1Net Income Attributable to Quintiles$ 92.70.71$ $ 66.80.50$ $ 268.02.03$ $ 153.61.22$ Restructuring Costs1.8 0.017.2 0.05 3.7 0.0311.9 0.09 Management Fees- - - - - - 27.7 0.22 Adjustment to Estimated Contingent Consideration(8.8) (0.07)(1.2) (0.01) (8.8) (0.07)(1.5) (0.01) Loss on Extinguishment of Debt- - - - - - 16.5 0.13 Tax Effect of Adjustments2(0.7) (0.01) (2.1) (0.01) (1.3) (0.01)(20.3) (0.15) Other Income Tax Adjustments3- - - - - - 3.1 0.02 Non-GAAP Adjusted Net Income$ 85.00.65$ $ 70.70.53$ $ 261.61.98$ $ 191.01.51$ Number of Diluted Shares Outstanding4130,626 133,267 131,903 126,195 Three Months Ended September 30Nine Months Ended September 30
14. 14
Reconciliation of Net Income Attributable to Quintiles to Non-GAAP Adjusted Net Income and Diluted Adjusted EPS for 2013
1EPS is represented in dollars.
2During the third quarter of 2014, the Company began excluding changes from adjustments to estimated contingent consideration from business combinations from adjusted net income and diluted adjusted earnings per share. Consistent with the other adjustments to adjusted net income and diluted adjusted net income per share, management believes that changes to the estimated value of contingent consideration are not indicative of its core operating results as the fluctuations from period-to-period do not necessarily correspond to changes in the core operationsof the business. To conform to the current period presentation, all the periods for fiscal year 2013 in the table above reflect the inclusion of this adjustment.
3Footnotes for each respective items is included in the press release for the third quarter of 2014.
4 Diluted shares are represented in thousands.
Note: Totals may not sum due to rounding; percentages are calculated from the actual results rounded to the nearest thousand.
Year Ended(millions of dollars) March 31,2013EPS1June 30,2013EPS1September 30,2013EPS1December 31,2013EPS1December 31,2013EPS1Net Income Attributable to Quintiles$ 48.30.41$ $ 38.50.30$ $ 66.80.50$ $ 73.00.55$ $ 226.61.77$ Restructuring Costs1.9 0.022.8 0.027.2 0.052.2 0.0214.1 0.11Management Fees31.3 0.01 26.4 0.21 - - - - 27.7 0.22 Adjustment to Estimated Contingent Consideration2(0.2) - - - (1.2) (0.01)(3.5) (0.03)(4.9) (0.04) Loss on Extinguishment of Debt- - 16.5 0.13- - 3.3 0.0219.8 0.15Tax Effect of Adjustments3(1.2) (0.01)(17.1) (0.13)(2.1) (0.01)(2.0) (0.01)(22.3) (0.17) Other Income Tax Adjustments37.3 0.06 (4.2) (0.03) - - - - 3.0 0.02 Non-GAAP Adjusted Net Income$ 57.40.48$ $ 62.90.50$ $ 70.70.53$ $ 73.00.55$ $ 264.02.06$ Number of Diluted Shares Outstanding4118,740 126,578 133,267 132,861 127,862 Three Months Ended
15. 15
1 Restructuring costs are tax effected at approximately 30%. Contingent consideration is not tax effected as it represents a permanent difference between book and tax income.
Non-GAAP 2014 Guidance Reconciliation
LowHighLowHighNet income attributable to Quintiles$344$354$2.61$2.68Restructuring costs 13 13 0.10 0.10 Adjustment to estimated contingent consideration(9) (9) (0.07) (0.07) Tax effect of adjustments 1(4) (4) (0.03) (0.03) Adjusted net income and diluted adjusted earnings per share $344$354$2.61$2.68Non-GAAP Adjusted Net Income (millions of dollars) Diluted Adjusted Earnings Per Share