This document provides an earnings presentation by Masco Corporation for the third quarter of 2014. Some key points include:
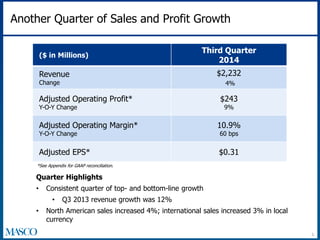
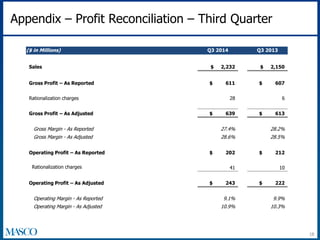
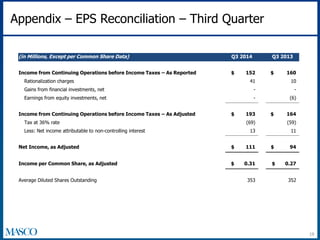
- Masco reported 4% revenue growth and a 9% increase in adjusted operating profit for Q3 2014 compared to Q3 2013.
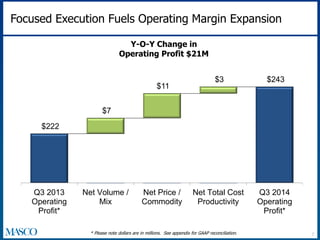
- Operating margin expanded by 60 basis points due to consistent execution and strong operating leverage.
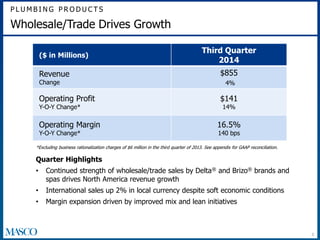
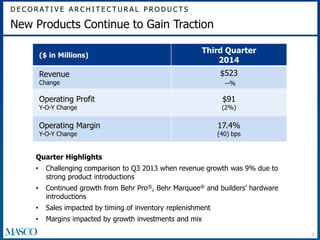
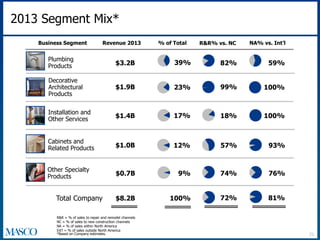
- Plumbing Products sales increased 4% driven by strength in wholesale/trade channels, while Decorative Architectural Products sales were flat in a challenging comparison to the prior year.
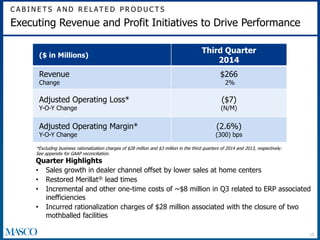
- Cabinets and Related Products incurred restructuring charges but grew sales 2% through initiatives in the dealer channel.