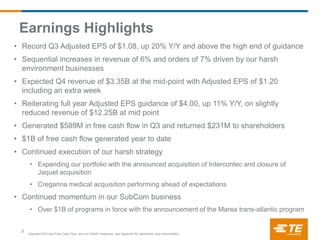
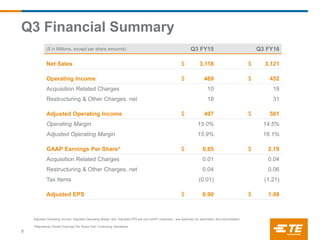
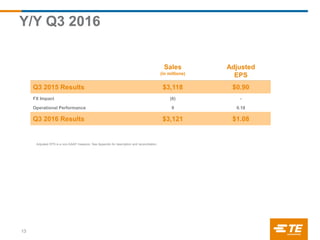
- TE Connectivity reported record Q3 adjusted EPS of $1.08, up 20% year-over-year and above guidance.
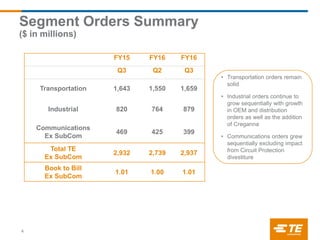
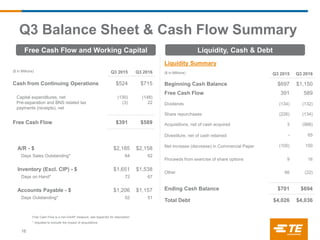
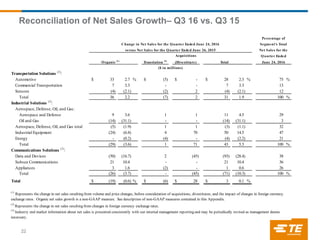
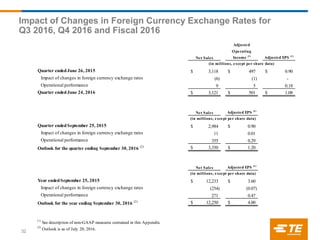
- Sequential increases in revenue of 6% and orders of 7% were driven by growth in harsh environment businesses.
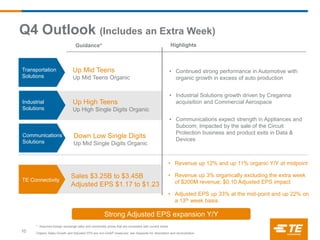
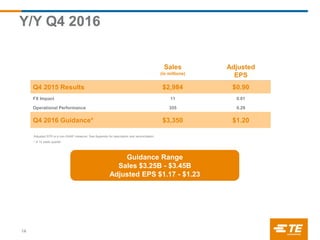
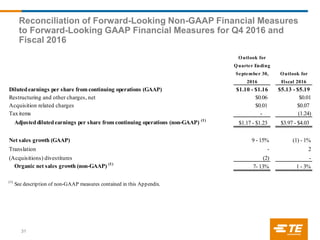
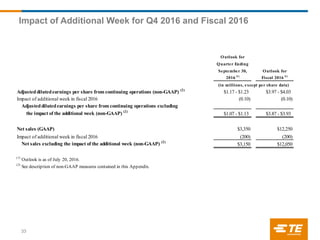
- For Q4, revenue is expected to be $3.35 billion at the mid-point with adjusted EPS of $1.20, including the impact of an extra week.
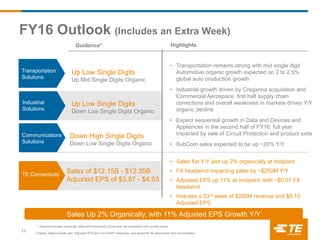
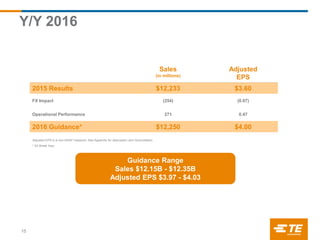
- Full year adjusted EPS guidance was reiterated at $4.00, up 11% year-over-year, on slightly reduced revenue of $12.25 billion at the mid-point.