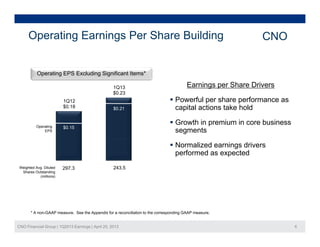
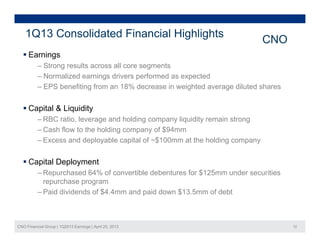
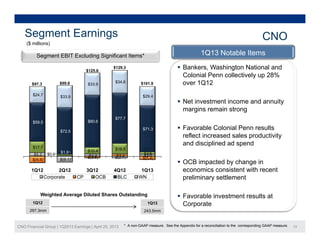
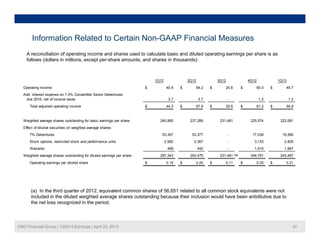
1. CNO Financial reported financial and operating results for 1Q13 with earnings growth across its core business segments and higher operating EPS compared to 1Q12.
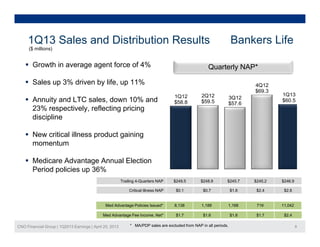
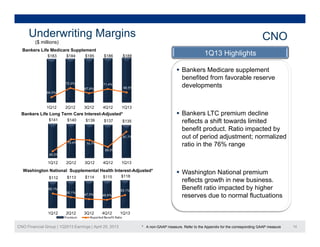
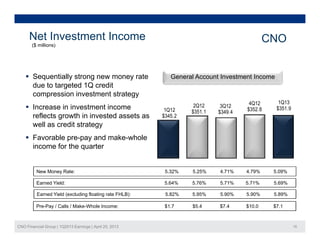
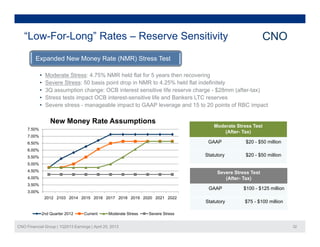
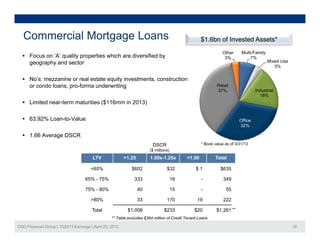
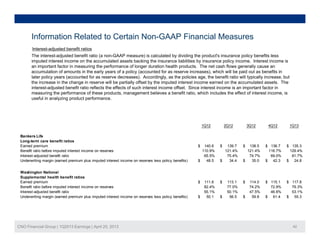
2. Investment income increased due to growth in invested assets and a targeted credit strategy, while underwriting margins remained strong.
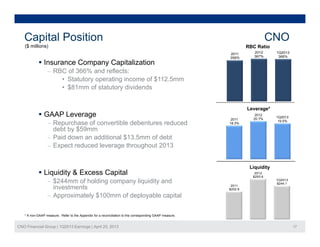
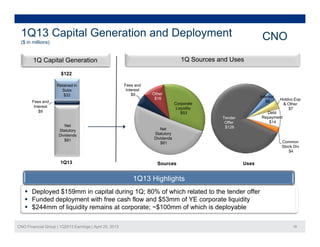
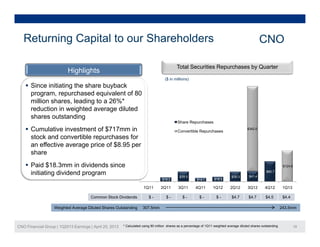
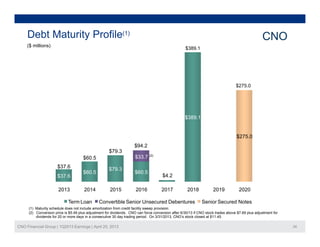
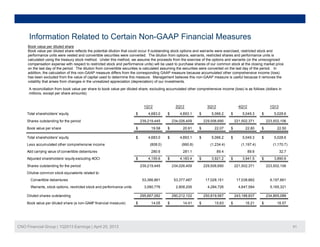
3. Capital levels remained high with an RBC ratio of 366% and leverage of 19.5%, and the company deployed capital by repurchasing convertible debt.