Downloaded 318 times
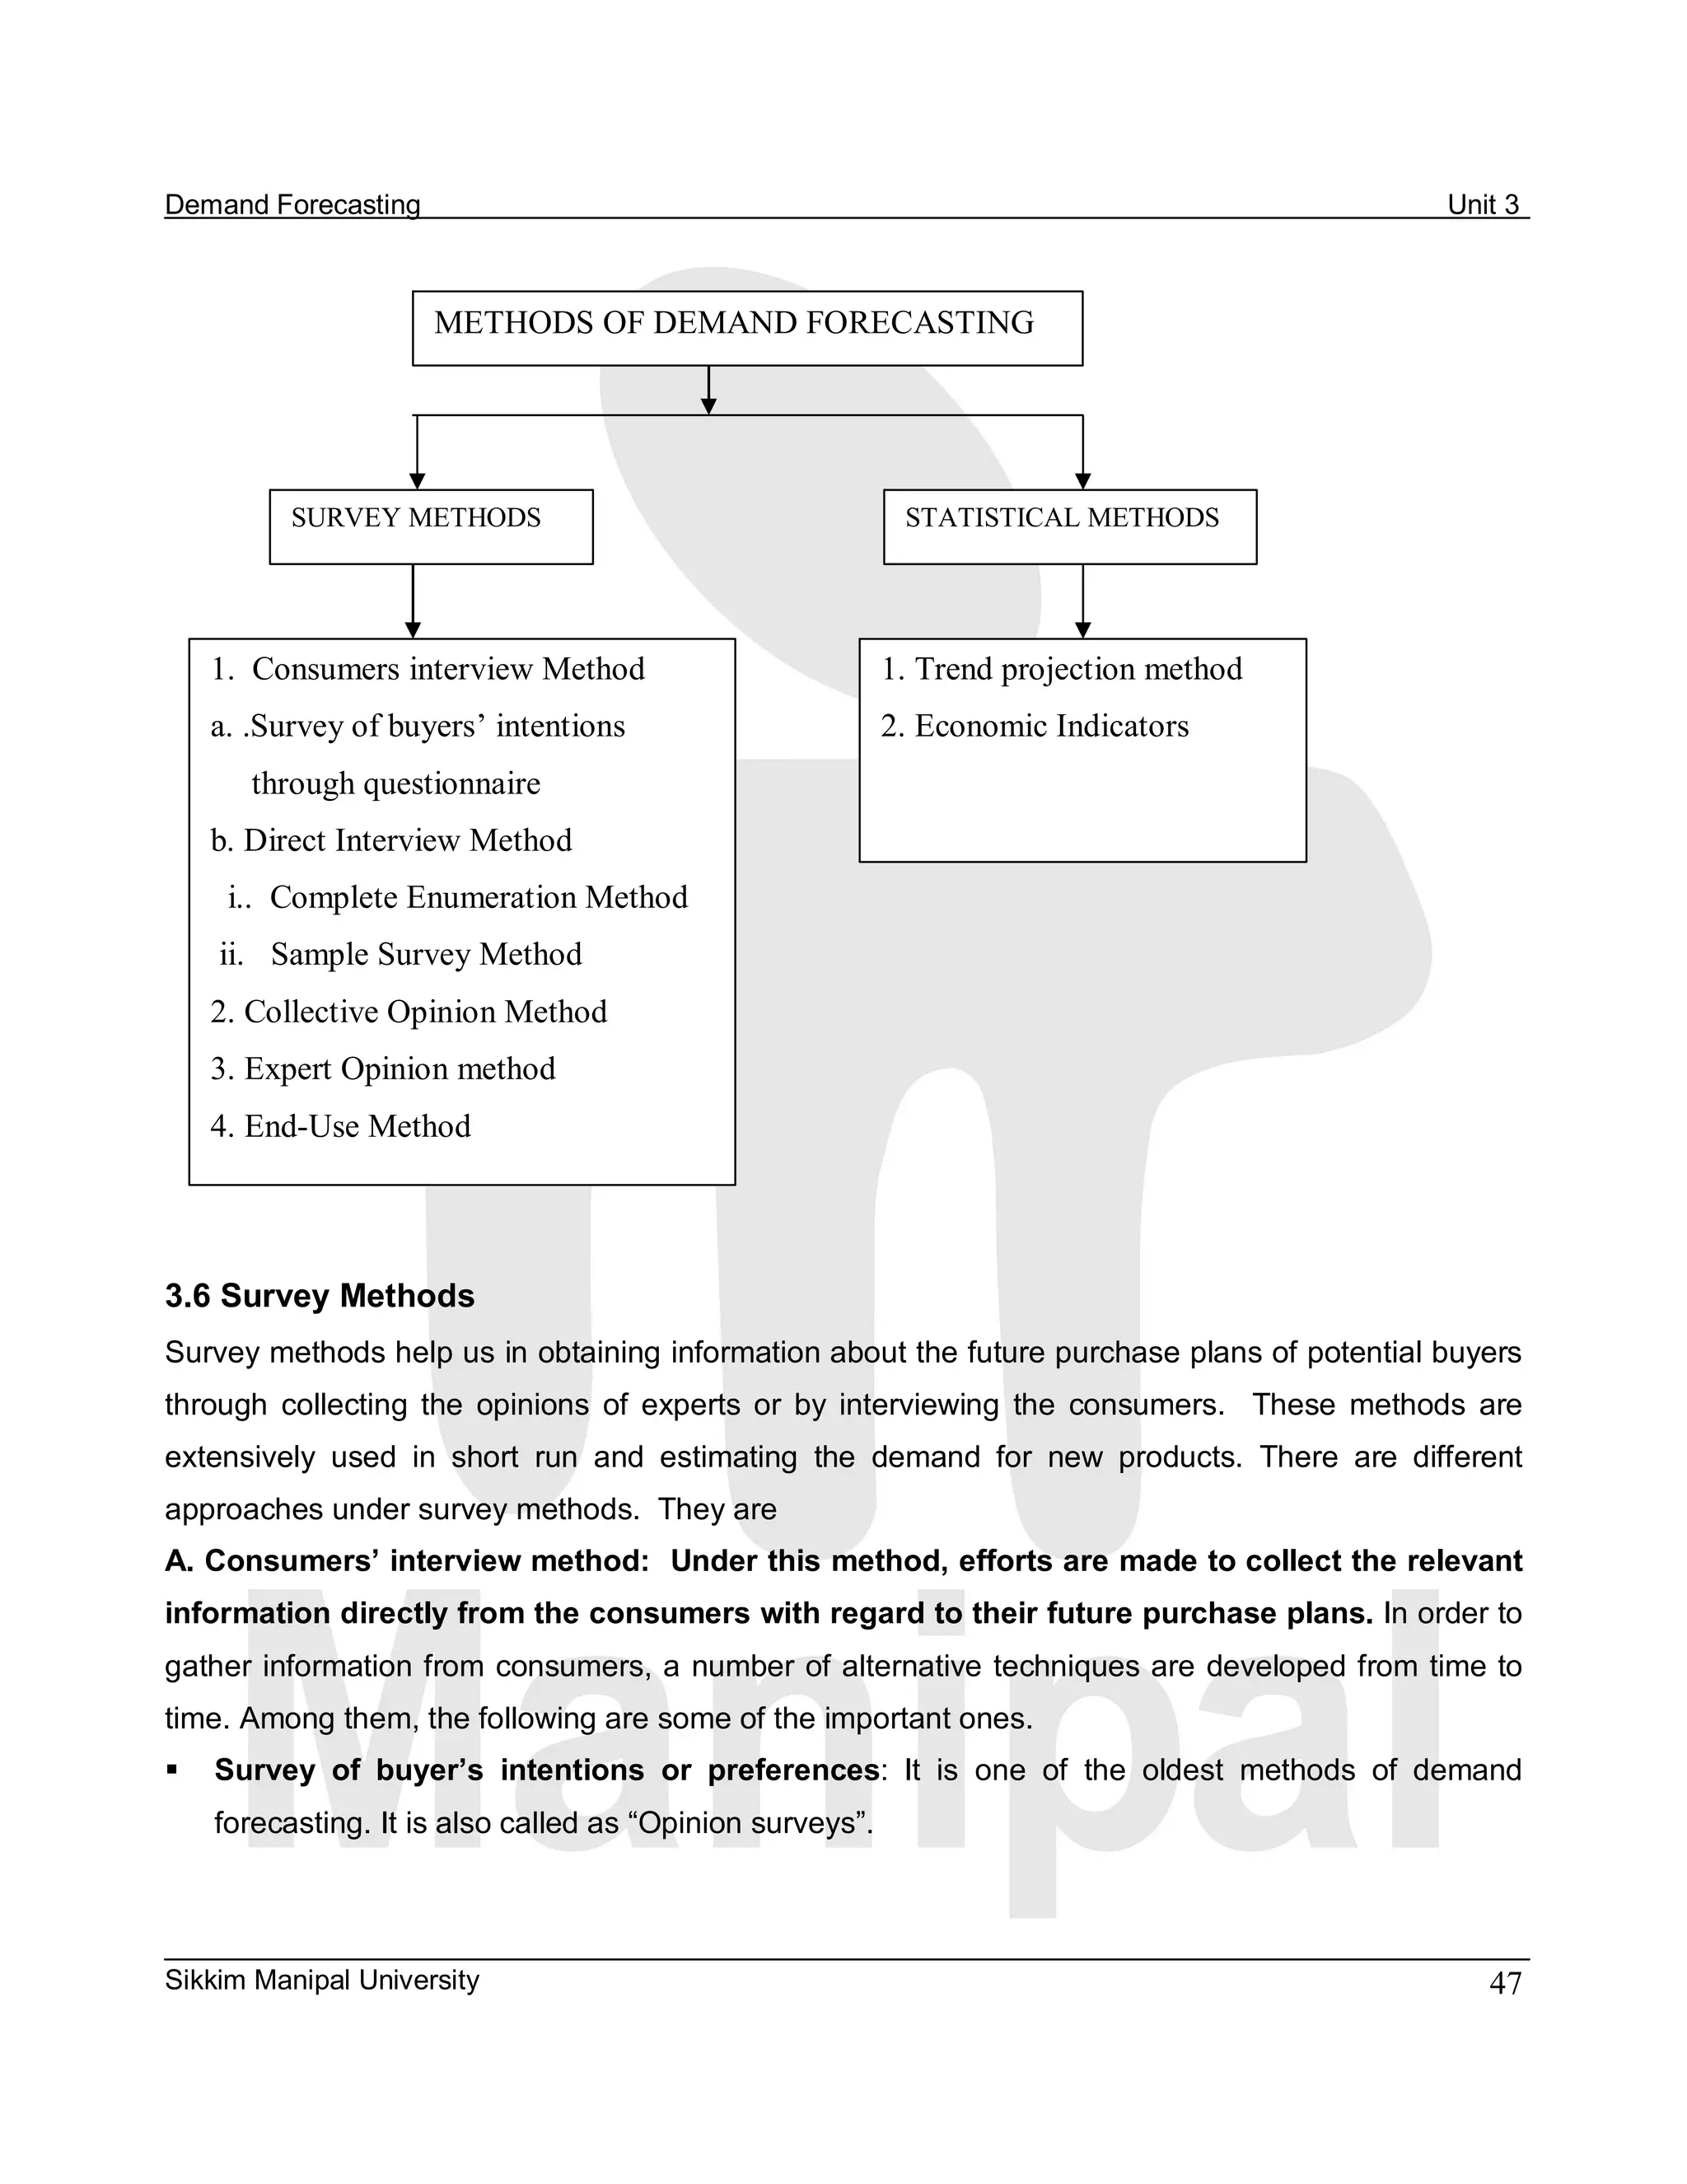

This document provides an overview of demand forecasting. It discusses the meaning and importance of demand forecasting, the different levels it can be conducted at (micro, industry, macro), criteria for good forecasting like accuracy and simplicity, and various methods like survey and statistical approaches. Demand forecasting is presented as an essential tool for business planning and decision making regarding production, sales, investment, and more. It allows companies to anticipate future demand and minimize risks.


