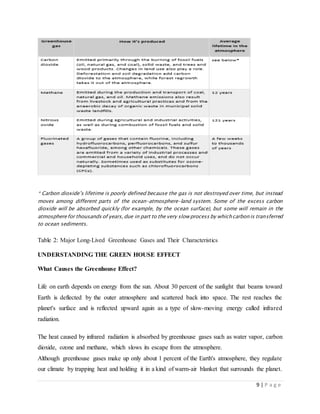
SlideShare a Scribd company logo
PAPER ON THE EFFECT OF GREEN HOUSE GASESON THE
ENVIRONMENT
BY ARIERE ARODOVWEMARVELOUS(1101/2012)
EARTH SCIENCE DEPARTMENT (GEOLOGY OPTION) JUNE, 2016
Abstract
The amount of solar energy absorbed or radiated by Earth is modulated by the
atmosphere and depends on its composition. Greenhouse gases - such as water
vapor, carbon dioxide, and methane - occur naturally in small amounts and absorb
and release heat energy more efficiently than abundant atmospheric gases like
nitrogen and oxygen. Small increases in carbon dioxide concentration have a large
effect on the climate system. The existence of a heavier layer of greenhouse effect
gases at the level of the entire planet triggers significant climate changes. This
paper intends to present the main environmental indicators elaborated by various
specialized international bodies, and the models used by different governmental or
non-governmental bodies for studying the impact/effects of greenhouse effect gas
emissions on the environment, climatic changes or economic development.
1 | P a g e
TABLE OF CONTENT
Executive Summary........................................................................................................................1
Introduction.....................................................................................................................................1
Understanding Green House Effect.................................................................................................1
Looking Forward.............................................................................................................................1
Table of Content ………………………………………………………………………………….1
ABSTRACT…………………………………………………………………………….
INTRODUCTION……………………………………………………………………...3
What are Greenhouse Gases……………………………………………………………..3
Sources of Greenhouse Gases…………………………………………………………...5
Types of Greenhouse Gases…...………………………………………………………...6
What is the Greenhouse Effect………………………………………………………….7
UNDERSTANDING THE GREEN HOUSE EFFECT……………………………....9
What causes the Greenhouse Effect………..………………………………………….....9
How do humans contribute to the Greenhouse Effect……..…………………………….10
Scientific issues surrounding the Greenhouse Effect……….………………………..….11
Consequences of enhanced Greenhouse effect…..……………………………….....…..16
LOOKING FORWARD (MITIGATION TO THE GREEN HOUSE EFFECT)…22
The Industrial Sector……………………………………………………………………23
The Transportation Sector………………………………………………………………23
Renewables…………………………………………………………………………….24
Forestry and Agriculture………………………………………………………………25
Information……………………………………………………………………………25
2 | P a g e
CONCLUSION…………………………………………………..……………………….27
REFERENCES……………………………………………………………………………28
3 | P a g e
INTRODUCTION
The Sun powers Earth’s climate, radiating energy at very short wavelengths, predominately in the
visible or near-visible (e.g., ultraviolet) part of the spectrum. Roughly one-third of the solar energy
that reaches the top of Earth’s atmosphere is reflected directly back to space. The remaining two-
thirds is absorbed by the surface and, to a lesser extent, by the atmosphere. To balance the absorbed
incoming energy, the Earth must, on average, radiate the same amount of energy back to space.
Because the Earth is much colder than the Sun, it radiates at much longer wavelengths, primarily
in the infrared part of the spectrum. Much of this thermal radiation emitted by the land and ocean
is absorbed by the atmosphere, including clouds, and reradiated back to Earth. This is called the
greenhouse effect. The glass walls in a greenhouse reduce airflow and increase the temperature of
the air inside. Analogously, but through a different physical process, the Earth’s greenhouse effect
warms the surface of the planet. Without the natural greenhouse effect, the average temperature at
Earth’s surface would be below the freezing point of water. Thus, Earth’s natural greenhouse effect
makes life as we know it possible. However, human activities, primarily the burning of fossil fuels
and clearing of forests, have greatly intensified the natural greenhouse effect, causing global
warming.
What are greenhouse gases?
Greenhouse gases include methane, chlorofluorocarbons and carbon dioxide. These gases act as a
shield that traps heat in the earth’s atmosphere. A greenhouse gas is any gaseous compound in the
atmosphere that is capable of absorbing infrared radiation, thereby trapping and holding heat in
the atmosphere. By increasing the heat in the atmosphere, greenhouse gases are responsible for the
greenhouse effect, which ultimately leads to global warming.
The two most abundant gases in the atmosphere, nitrogen (comprising 78% of the dry
atmosphere) and oxygen (comprising 21%), exert almost no greenhouse effect. Instead, the
greenhouse effect comes from molecules that are more complex and much less common. Water
vapour is the most important greenhouse gas, and carbon dioxide (CO2) is the second-most
important one. Methane, nitrous oxide, ozone and several other gases present in the atmosphere in
small amounts also contribute to the greenhouse effect. In the humid equatorial regions, where
there is so much water vapour in the air that the greenhouse effect is very large, adding a small
additional amount of CO2 or water vapour has only a small direct impact on downward infrared
4 | P a g e
radiation. However, in the cold, dry polar regions, the effect of a small increase in CO2 or water
vapour is much greater. The same is true for the cold, dry upper atmosphere where a small increase
in water vapour has a greater influence on the greenhouse effect than the same change in water
vapour would have near the surface.
Several components of the climate system, notably the oceans and living things, affect atmospheric
concentrations of greenhouse gases. A prime example of this is plants taking CO2 out of the
atmosphere and converting it (and water) into carbohydrates via photosynthesis. In the industrial
era, human activities have added greenhouse gases to the atmosphere, primarily through the
burning of fossil fuels and clearing of forests. Adding more of a greenhouse gas, such as CO2, to
the atmosphere intensifies the greenhouse effect, thus warming Earth’s climate. The amount of
warming depends on various feedback mechanisms. For example, as the atmosphere warms due
to rising levels of greenhouse gases, its concentration of water vapour increases, further
intensifying the greenhouse effect. This in turn causes more warming, which causes an additional
increase in water vapour, in a self-reinforcing cycle. This water vapour feedback may be strong
enough to approximately double the increase in the greenhouse effect due to the added CO2 alone.
Additional important feedback mechanisms involve clouds. Clouds are effective at absorbing
infrared radiation and therefore exert a large greenhouse effect, thus warming the Earth. Clouds
are also effective at reflecting away incoming solar radiation, thus cooling the Earth. A change in
almost any aspect of clouds, such as their type, location, water content, cloud altitude, particle size
and shape, or lifetimes, affects the degree to which clouds warm or cool the Earth. Some changes
amplify warming while others diminish it. Much research is in progress to better understand how
clouds change in response to climate warming, and how these changes affect climate through
various feedback mechanisms.
5 | P a g e
Sources of greenhouse gases
Some greenhouse gases, like methane, are produced through agricultural practices including
livestock manure management. Others, like CO2, largely result from natural processes like
respiration and from the burning of fossil fuels like coal, oil and gas. The production of electricity
is the source of 70 percent of the United States' sulfur dioxide emissions, 13 percent of nitrogen
oxide emissions, and 40 percent of carbon dioxide emissions, according to the EPA.
The second cause of CO2 release is deforestation, according to research published by Duke
University. When trees are killed to produce goods or heat, they release the carbon that is normally
stored for photosynthesis. This process releases nearly a billion tons of carbon into the atmosphere
per year, according to the 2010 Global Forest Resources Assessment.
It's worth noting that forestry and other land-use practices offset some of these greenhouse gas
emissions, according to the EPA. "Replanting helps to reduce the buildup of carbon dioxide in the
atmosphere as growing trees sequester carbon dioxide through photosynthesis. Atmospheric
carbon dioxide is converted and stored in the vegetation and soils of the forest. However, forests
cannot sequester all of the carbon dioxide we are emitting to the atmosphere through the burning
of fossil fuels and a reduction in fossil fuel emissions is still necessary to avoid build up in the
atmosphere," said Daley.
Worldwide, the output of greenhouse gases is a source of grave concern: From the time the
Industrial Revolution began to the year 2009, atmospheric CO2 levels have increased almost 38
percent and methane levels have increased a whopping 148 percent, according to NASA, and most
of that increase has been in the past 50 years. Because of global warming, 2014 was the warmest
year on record and 10 of the hottest years have all come after 1998.
"The warming we observe affects atmospheric circulation, which impacts rainfall patterns
globally. This will lead to big environmental changes, and challenges, for people all across the
globe," Josef Werne, an associate professor in the department of geology and planetary science at
the University of Pittsburgh, told Live Science.
6 | P a g e
If these trends continue, scientists, government officials and a growing number of citizens fear that
the worst effects of global warming — extreme weather, rising sea levels, plant and animal
extinctions, ocean acidification, major shifts in climate and unprecedented social upheaval — will
be inevitable. In answer to the problems caused by global warming by greenhouse gasses, the
government created a climate action plan in 2013.
Types of Greenhouse gases
Greenhouse gases comprise less than 1% of the atmosphere. Their levels are determined by a
balance between “sources” and “sinks”. Sources and sinks are processes that generate and destroy
greenhouse gases respectively. Human affect greenhouse gas levels by introducing new sources or
by interfering with natural sinks. The major greenhouse gases in the atmosphere are carbon dioxide
(CO2), methane, (CH4), nitrous oxide (N2O), chlorofluorocarbons (CFCs) and ozone (O3).
Atmospheric water vapour (H2O) also makes a large contribution to the natural greenhouse effect
but it is thought that its presence is not directly affected by human activity. Characteristics of some
of the greenhouse gases are shown in Table 1 below
Plate 1: Major Green House Gases and Their Percentages
Source: Encarta Encyclopedia
7 | P a g e
Table 1: Characteristics of some major greenhouse gases
What is the Greenhouse Effect?
The “Greenhouse Effect” is a term that refers to a physical property of the Earth's atmosphere. If
the Earth had no atmosphere, its average surface temperature would be very low of about 18℃
rather than the comfortable 15℃ found today. The difference in temperature is due to a suite of
gases called greenhouse gases which affect the overall energy balance of the Earth's system by
absorbing infrared radiation. In its existing state, the Earth atmosphere system balances absorption
of solar radiation by emission of infrared radiation to space. Due to greenhouse gases, the
atmosphere absorbs more infrared energy than it reradiates to space, resulting in a net warming of
the Earth atmosphere system and of surface temperature. This is the “Natural Greenhouse Effect”.
With more greenhouse gases released to the atmosphere due to human activity, more infrared
8 | P a g e
radiation will be trapped in the Earth's surface which contributes to the “Enhanced Greenhouse
Effect”.
The greenhouse effect increases the temperature of the Earth by trapping heat in our atmosphere.
This keeps the temperature of the Earth higher than it would be if direct heating by the Sun was
the only source of warming. When sunlight reaches the surface of the Earth, some of it is absorbed
which warms the ground and some bounces back to space as heat. Greenhouse gases that are in
the atmosphere absorb and then redirect some of this heat back towards the Earth.
The greenhouse effect is a major factor in keeping the Earth warm because it keeps some of the
planet's heat that would otherwise escape from the atmosphere out to space. In fact, without the
greenhouse effect the Earth's average global temperature would be much colder and life on Earth
as we know it would not be possible. The difference between the Earth's actual average temperature
14° C (57.2° F) and the expected effective temperature just with the Sun's radiation -19° C (-2.2°
F) gives us the strength of the greenhouse effect, which is 33° C
The greenhouse effect is a natural process that is millions of years old. It plays a critical role in
regulating the overall temperature of the Earth. The greenhouse effect was first discovered by
Joseph Fourier in 1827, experimentally verified by John Tyndall in 1861, and quantified by Svante
Arrhenius in 1896.
Plate 2 A simplified diagram illustrating the global long term radiative balance of the atmosphere.
Source: Encarta Encyclopedia
9 | P a g e
* Carbon dioxide’s lifetime is poorly defined because the gas is not destroyed over time, but instead
moves among different parts of the ocean–atmosphere–land system. Some of the excess carbon
dioxide will be absorbed quickly (for example, by the ocean surface), but some will remain in the
atmospherefor thousands of years,due in part to the very slowprocess by whichcarbonis transferred
to ocean sediments.
Table 2: Major Long-Lived Greenhouse Gases and Their Characteristics
UNDERSTANDING THE GREEN HOUSE EFFECT
What Causes the Greenhouse Effect?
Life on earth depends on energy from the sun. About 30 percent of the sunlight that beams toward
Earth is deflected by the outer atmosphere and scattered back into space. The rest reaches the
planet's surface and is reflected upward again as a type of slow-moving energy called infrared
radiation.
The heat caused by infrared radiation is absorbed by greenhouse gases such as water vapor, carbon
dioxide, ozone and methane, which slows its escape from the atmosphere.
Although greenhouse gases make up only about 1 percent of the Earth's atmosphere, they regulate
our climate by trapping heat and holding it in a kind of warm-air blanket that surrounds the planet.
10 | P a g e
This phenomenon is what scientists call the greenhouse effect. Without it, scientists estimate that
the average temperature on Earth would be colder by approximately 30 degrees Celsius (54 degrees
Fahrenheit), far too cold to sustain most of our current ecosystems.
How Do Humans Contribute to the Greenhouse Effect?
While the greenhouse effect is an essential environmental prerequisite for life on Earth, there really
can be too much of a good thing.
The problems begin when human activities distort and accelerate the natural process by
creating more greenhouse gases in the atmosphere than are necessary to warm the planet to an
ideal temperature.
 Burning natural gas, coal and oil, including gasoline for automobile engines, raises the level of
carbon dioxide in the atmosphere.
 Some farming practices and other land uses increase the levels of methane and nitrous oxide.
 Many factories produce long-lasting industrial gases that do not occur naturally, yet contribute
significantly to the enhanced greenhouse effect and global warming that is currently under way.
 Deforestation also contributes to global warming. Trees use carbon dioxide and give off oxygen
in its place, which helps to create the optimal balance of gases in the atmosphere. As more forests
are logged for timber or cut down to make way for farming, however, there are fewer trees to
perform this critical function. At least some of the damage can be offset when young forests
aggressively regrow, capturing tons of carbon.
 Population growth is another factor in global warming, because as more people use fossil fuels for
heat, transportation and manufacturing the level of greenhouse gases continues to increase. As
more farming occurs to feed millions of new people, more greenhouse gases enter the atmosphere.
Ultimately, more greenhouse gases means more infrared radiation trapped and held, which
gradually increases the temperature of the Earth's surface, the air in the lower atmosphere,and
ocean waters.
11 | P a g e
Scientific Issues Surrounding the Greenhouse Effect
It is helpful to break down the set of issues known as the greenhouse effect into a series of stages,
each feeding into another, and then to consider how policy questions might be addressed in the
context of these more technical stages.
Projecting emissions. Behavioral assumptions must be made in order to project future use of fossil
fuels (or deforestation, because this too can impact the amount of CO2 in the atmosphere--it
accounts for about 20% of the recent total CO2 injection of about 5.5 x 10 9 metric tons). The
essence of this aspect then is social science. Projections must be made of human population, the
per capita consumption of fossil fuel, deforestation rates, reforestation activities, and perhaps even
countermeasures to deal with the extra CO2 in the air. These projections depend on issues such as
the likelihood that alternative energy systems or conservation measures will be available, their
price, and their social acceptability. Furthermore, trade in fuel carbon (for example, a large-scale
transfer from coal-rich to coal-poor nations) will depend not only on the energy requirements and
the available alternatives but also on the economic health of the potential importing nations. This
trade in turn will depend upon whether those nations have adequate capital resources to spend on
energy rather than other precious strategic commodities--such as food or fertilizer as well as some
other strategic materials such as weaponry. Total CO2 emissions from energy systems, for
example, can be expressed by a formula termed "the population multiplier" by Ehrlich and Holdren
The first term represents engineering effects, the second standard of living, and the third
demography in this version, which is expanded from the original.
In order to quantify future changes, we can make scenarios that show alternative CO2 futures based
on assumed rates of growth in the use of fossil fuels. Most typical projections are in the 0.5 to 2%
annual growth range for fossil fuel use and imply that CO2 concentrations will double (to 600 ppm)
in the 21st century. There is virtually no dispute among scientists that the CO2 concentration in the
atmosphere has already increased by @25% since @1850. The record at Mauna Loa observatory
shows that concentrations have increased from about 310 to more than 350 ppm since 1958.
Superimposed on this trend is a large annual cycle in which CO2 reaches a maximum in the spring
12 | P a g e
of each year in the Northern Hemisphere and a minimum in the fall. The fall minimum is generally
thought to result from growth of the seasonal biosphere in the Northern Hemisphere summer
whereby photosynthesis increases faster than respiration and atmospheric CO2 levels are reduced.
After September, the reverse occurs and respiration proceeds at a faster rate than photosynthesis
and CO2 levels increase. Analyses of trapped air in several ice cores suggest that during the past
several thousand years of the present interglacial, CO2 levels have been reasonably close to the
pre-industrial value of 280 ppm. However, since about 1850, CO2 has risen @25%. At the
maximum of the last Ice Age 18,000 years ago, CO2 levels were roughly 25% lower than pre
industrial values. The data also reveal a close correspondence between the inferred temperature at
Antarctica and the measured CO2 concentration from gas bubbles trapped in ancient ice. However,
whether the CO2 level was a response to or caused the temperature changes is debated: CO2 may
have simply served as an amplifier or positive feedback mechanism for climate change--that is,
less CO2, colder temperatures. This uncertainty arises because the specific bio geophysical
mechanisms that cause CO2 to change in step with the climate are not yet elucidated. Methane
concentrations in bubbles in ice cores also show a similar close relation with climate during the
past 150,000 years.
Other greenhouse gases like chlorofluorocarbons (CFCs), CH4, nitrogen oxides, tropospheric
ozone, and others could, together, be as important as CO2 in augmenting the greenhouse effect,
but some of these depend on human behavior and have complicated biogeochemical interactions.
These complications account for the large error bars. Space does not permit a proper treatment of
individual aspects of each non-CO2 trace greenhouse gas; therefore, I reluctantly will consider all
greenhouse gases taken together as "equivalent CO2. However, this assumption implies that
projections for "CO2" alone will be an underestimate of the total greenhouse gas buildup by
roughly a factor of 2. Furthermore, this assumption forces us to ignore possible relations between
CH4 and water vapor in the stratosphere, for example, which might affect polar stratospheric
clouds, which are believed to enhance photochemical destruction of ozone by chlorine atoms.
Projecting greenhouse gas concentrations. Once a plausible set of scenarios for how much CO2
will be injected into the atmosphere is obtained the interacting biogeochemical processes that
control the global distribution and stocks of the carbon need to be determined. Such processes
13 | P a g e
involve the uptake of CO2 by green plants (because CO2 is the basis of photosynthesis, more CO2
in the air means faster rates of photosynthesis), changes in the amount of forested area and
vegetation type, and how CO2 fertilization or climate change affects natural ecosystems on land
and in the oceans. The transition from ice age to interglacial climates provides a concrete example
of how large natural climatic change affected natural ecosystems in North America. This transition
represented some 5deg.C global warming, with as much as 10deg. to 20deg.C warming locally
near ice sheets. The boreal species now in Canada were hugging the rim of the great Lauren tide
glacier in the U.S. Northeast some 10,000 years ago, while now abundant hardwood species were
restricted to small refuges largely in the South. The natural rate of forest movement that can be
inferred is, to order of magnitude, some @1 km per year, in response to temperature changes
averaging @1deg. to 2deg.C per thousand years. If climate were to change much more rapidly than
this, then the forests would likely not be in equilibrium with the climate; that is, they could not
keep up with the fast change and would go through a period of transient adjustment in which many
hard-to-predict changes in species distribution, productivity, and CO2 absorptive capacity would
likely occur.
Furthermore, because the slow removal of CO2 from the atmosphere is largely accomplished
through biological and chemical processes in the oceans and decades to centuries are needed for
equilibration after a large perturbation, the rates at which climate change modifies mixing
processes in the ocean (and thus the CO2 residence time) also needs to be taken into account. There
is considerable uncertainty about how much newly injected CO2 will remain in the air during the
next century, but typical estimates put this so-called "airborne fraction" at about 50%. Reducing
CO2 emissions could initially provide a bonus by allowing the reduction of the airborne fraction,
whereas increasing CO2 emissions could increase the airborne fraction and exacerbate the
greenhouse effect. However, this bonus might last only a decade or so, which is the time it takes
for the upper mixed layer of the oceans to mix with deep ocean water. Biological feedbacks can
also influence the amount of CO2 in the air. For example, enhanced photosynthesis could reduce
the buildup rate of CO2 relative to that projected with carbon cycle models that do not include such
an effect. On the other hand, although there is about as much carbon stored in the forests as there
is in the atmosphere, there is about twice as much carbon stored in the soils in the form of dead
organic matter. This carbon is slowly decomposed by soil microbes back to CO2 and other gases.
14 | P a g e
Because the rate of this decomposition depends on temperature, global warming from increased
greenhouse gases could cause enhanced rates of microbial decomposition of neuromas (dead
organic matter), thereby causing a positive feedback that would enhance CO2 buildup.
Furthermore, considerable methane is trapped below frozen sediments as clathrates in tundra and
off continental shelves. These clathrates could release vast quantities of methane into the
atmosphere if substantial Arctic warming were to take place. Already the ice core data have shown
that not only has CO2 tracked temperature closely for the past 150,000 years, but so has methane,
and methane is a significant trace greenhouse gas which is some 20 to 30 times more effective per
molecule at absorbing infrared radiation than CO2.Despite these uncertainties, many workers have
projected that CO2 concentrations will reach 600 ppm sometime between 2030 and 2080 and that
some of the other trace greenhouse gases will continue to rise at even faster rates.
Estimating global climatic response. Once we have projected how much CO2 (and other trace
greenhouse gases) may be in the air during the next century or so, we have to estimate its climatic
effect. Complications arise because of interactive processes; that is, feedback mechanisms. For
example, if added CO2 were to cause a temperature increase on earth, the warming would likely
decrease the regions of Earth covered by snow and ice and decrease the global albedo. The initial
warming would thus create a darker planet that would absorb more energy, thereby creating a
larger final warming. This scenario is only one of a number of possible feedback mechanisms.
Clouds can change in amount, height, or brightness, for example, substantially altering the climatic
response to CO2.And because feedback processes interact in the climatic system, estimating global
temperature increases accurately is difficult; projections of the global equilibrium temperature
response to an increase of CO2 from 300 to 600 ppm have ranged from @1.5deg. to 5.5deg.C. (In
the next section the much larger uncertainties surrounding regional responses will be discussed.)
Despite these uncertainties, there is virtually no debate that continued increases of CO2 will cause
global warming.
We cannot directly verify our quantitative predictions of greenhouse warming on the basis of
purely historical events; therefore, we must base our estimates on natural analogs of large climatic
changes and numerical climatic models because the complexity of the real world cannot be
reproduced in laboratory models. In the mathematical models, the known basic physical laws are
15 | P a g e
applied to the atmosphere, oceans, and ice sheets, and the equations that represent these laws are
solved with the best computers available. Then, we simply change in the computer program the
effective amount of greenhouse gases, repeat our calculation, and compare it to the "control"
calculation for the present Earth. Many such global climatic models (GCMs) have been built
during the past few decades, and the results are in rough agreement that if CO2 were to double
from 300 to 600 ppm, then Earth's surface temperature would eventually warm up somewhere
between 1deg. and 5deg.C; the most recent GCM estimates are from 3.5deg. to 5. 0deg.C. For
comparison, the global average surface temperature (land and ocean) during the Ice Age extreme
18,000 years ago was only about 5deg.C colder than that today. Thus, a global temperature changes
of 1deg. to 2deg.C can have considerable effects. A sustained global increase of more than 2deg.C
above present would be unprecedented in the era of human civilization.
The largest uncertainty in estimating the sensitivity of Earth's surface temperature to a given
increase in radiative forcing arises from the problem of parameterization. Because the equations
that are believed to represent the flows of mass, momentum, and energy in the atmosphere, oceans,
ice fields, and biosphere cannot be solved analytically with any known techniques, approximation
techniques are used in which the equations are discretized with a finite grid that divides the region
of interest into cells that are several hundred kilometers or more on a side. Clearly, critically
important variables, such as clouds, which control the radiation budget of Earth, do not occur on
scales as large as the grid of a general circulation model. Therefore, we seek to find a parametric
representation or parameterization that relates implicitly the effects of important processes that
operate at sub grid-scale but still have effects at the resolution of a typical general circulation
model. For example, a parameter or proportionality coefficient might be used that describes the
average cloudiness in grid cell in terms of the mean relative humidity in that cell and some other
measures of atmospheric stability. Then, the important task becomes validating these semi
empirical parameterizations because at some scale, all models, no matter how high resolution, must
treat sub grid-scale processes through parameterization.
Projecting regional climatic response. In order to make useful estimates of the effects of climatic
changes, we need to determine the regional distribution of climatic change. Will it be drier in Iowa
in 2010, too hot in India, wetter in Africa, or more humid in New York; will California be prone
16 | P a g e
to more forest fires or will Venice flood? Unfortunately, reliable prediction of the time sequence
of local and regional responses of variables such as temperature and rainfall requires climatic
models of greater complexity and expense than are currently available. Even though the models
have been used to estimate the responses of these variables, the regional predictions from state-of-
the-art models are not yet reliable.
Although there is considerable experience in examining regional changes, considerable uncertainty
remains over the probability that these predicted regional features will occur. The principal reasons
for the uncertainty are twofold: the crude treatment in climatic models of biological and
hydrological processes and the usual neglect of the effects of the deep oceans. The deep oceans
would respond slowly--on time scales of many decades to centuries--to climatic warming at the
surface, and also act differentially (that is, non-uniformly in space and through time). Therefore,
the oceans, like the forests, would be out of equilibrium with the atmosphere if greenhouse gases
increase as rapidly as typically is projected and if climatic warming were to occur as fast as 2deg.
to 6deg.C during the next century. This typical projection, recall, is 10 to 60 times as fast as the
natural average rate of temperature change that occurred from the end of the last Ice Age to the
present warm period (that is, 2deg. to 6deg.C warming in a century from human activities
compared to an average natural warming of 1deg. to 2deg.C per millennium from the waning of
the Ice Age to the establishment of the present interglacial epoch). If the oceans are out of
equilibrium with the atmosphere, then specific regional forecasts will not have much credibility
until fully coupled atmosphere-ocean models are tested and applied. The development of such
models is a formidable scientific and computational task and is still not very advanced.
Consequences of Enhanced Greenhouse Effect
i) Global Warming
Increase of greenhouse gases concentration causes a reduction in outgoing infrared radiation, thus
the Earth's climate must change somehow to restore the balance between incoming and outgoing
radiation. This “climatic change” will include a “global warming” of the Earth's surface and the
lower atmosphere as warming up is the simplest way for the climate to get rid of the extra energy.
However, a small rise in temperature will induce many other changes, for example, cloud cover
and wind patterns. Some of these changes may act to enhance the warming (positive feedbacks),
17 | P a g e
others to counteract it (negative feedbacks). Using complex climate models, the
"Intergovernmental Panel on Climate Change" in their third assessment report has forecast that
global mean surface temperature will rise by 1.4℃ to 5.8℃ by the end of 2100. This projection
takes into account the effects of aerosols which tend to cool the climate as well as the delaying
effects of the oceans which have a large thermal capacity. However, there are many uncertainties
associated with this projection such as future emission rates of greenhouse gases, climate
feedbacks, and the size of the ocean delay etc.
ii) Sea Level Rise
If global warming takes place, sea level will rise due to two different processes. Firstly, warmer
temperature cause sea level to rise due to the thermal expansion of seawater. Secondly, water from
melting glaciers and the ice sheets of Greenland and the Antarctica would also add water to the
ocean. It is predicted that the Earth's average sea level will rise by 0.09 to 0.88 m between 1990
and 2100.
Potential Impact on the Environment / human life
a) Economic Impact
Over half of the human population lives within 100 kilometers of the sea. Most of this population
lives in urban areas that serve as seaports. Rising temperatures would raise sea levels as well,
reducing supplies of fresh water as flooding occurs along coastlines worldwide and salt water
reaches inland. A measurable rise in sea level will have a severe economic impact on low lying
coastal areas and islands, for examples, increasing the beach erosion rates along coastlines, rising
sea level displacing fresh groundwater for a substantial distance inland.
b) Agricultural Impact
An increase in atmospheric CO2 enhances the agricultural productivity of land resources because
of its direct beneficial effects on crop growth. Over the long run, however, increasing
concentrations of greenhouse gases warm Earth’s climate and thereby modify the potential extent
and productivity of agriculture. The direct effects of CO2 on plant growth and the indirect effects
of climate change also will modify the potential extent and productivity of Earth’s ecosystems.
Human responses to changing agricultural opportunities will interact with ecosystems, as well.
18 | P a g e
Experiments have shown that with higher concentrations of CO2,plants can grow bigger and faster.
However, the effect of global warming may affect the atmospheric general circulation and thus
altering the global precipitation pattern as well as changing the soil moisture contents over various
continents. Millions of people also would be affected, especially poor people who live in
precarious locations or depend on the land for a subsistence living. Food production, processing,
and distribution can be affected, as well as national security.
c) Effects on Aquatic systems
The loss of coastal wetlands could certainly reduce fish populations, especially shellfish. Increased
salinity in estuaries could reduce the abundance of freshwater species but could increase the
presence of marine species. However, the full impact on marine species is not known.
d) Effects on Hydrological Cycle
Global precipitation is likely to increase. However, it is not known how regional rainfall patterns
will change. Some regions may have more rainfall, while others may have less. Furthermore,
higher temperatures would probably increase evaporation. These changes would probably create
new stresses for many water management systems.
e) More mobile species
Many of the world’s endangered species would become extinct as rising temperatures changed
their habitat, and affected the timing of seasonal events. Species are straying from their native
habitats at an unprecedented rate: 11 miles (17.6 km) toward the poles per decade. Areas where
temperature is increasing the most show the most straying by native organisms. The Cetti's
warbler, for example, has moved north over the last two decades by more than 90 miles (150 km).
Plate 3: Credit: Kenneth Lohmann, University of North Carolina at Chapel Hill Plate 4: A Cetti’s warbler
Source: Stephanie Pappas, Live Science Contributor, September 07, 2012
19 | P a g e
f) Hurting polar bears
Polar bear cubs are struggling to swim increasingly long distances in search of stable sea ice,
according to a 2011 study. The rapid loss of sea ice in the Arctic is forcing bears to sometimes
swim up to more than 12 days at a time, the research found. Cubs of adult bears that had to swim
more than 30 miles (48 kilometers) had a 45 percent mortality rate, compared with 18 percent for
cubs that had to swim shorter distances.
Plate 5: Credit: USFWS
Source: Stephanie Pappas, Live Science Contributor, September 07, 2012
g) Changing genetics
Even fruit flies are feeling the heat. According to a 2006 study, fruit fly genetic patterns normally
seen at hot latitudes are showing up more frequently at higher latitudes. According to the research,
the gene patterns of Drosophila subobscura, a common fruit fly, are changing so that populations
look about one degree closer in latitude to the equator than they actually are. In other words,
genotypes are shifting so that a fly in the Northern Hemisphere has a genome that looks more like
a fly 75 to 100 miles (120 to 161 kilometers) south.
Plate 6: Credit: Giovanni Cancemi | Shutterstock Plate 7: Fruit flies
Source: Stephanie Pappas, Live Science Contributor, September 07, 2012
20 | P a g e
h) Changed high seasonat national parks
When's the busiest time to see the Grand Canyon? The answer has changed over the decades as
spring has started earlier. Peak national park attendance has shifted forward more than four days,
on average, since 1979. Today, the highest number of visitors now swarm the Grand Canyon on
June 24, compared with July 4 in 1979.
Plate 8: Credit: Andrea El-Wailly
Source: Stephanie Pappas, Live Science Contributor, September 07, 2012
i) Altered Thoreau's stomping grounds
The writer Henry David Thoreau once lovingly documented nature in and around Concord, Mass.
Reading those diaries today has shown researchers just how much spring has changed in the last
century or so. Compared to the late 1800s, the first flowering dates for 43 of the most common
plant species in the area have moved forward an average of 10 days. Other plants have simply
disappeared, including 15 species of orchids.
Plate 9: Credit: © Houghton Library, President and Fellows of Harvard College
Source: Stephanie Pappas, Live Science Contributor, September 07, 2012
21 | P a g e
j) High-country changes
Decreased winter snowfall on mountaintops is allowing elk in northern Arizona to forage at higher
elevations all winter, contributing to a decline in seasonal plants. Elk have ravaged trees such as
maples and aspens, which in turn has led to a decline in songbirds that rely on these trees for
habitat.
Plate 10: Credit: Don Becker, USGS
Source: Stephanie Pappas, Live Science Contributor, September 07, 2012
k) Altering breeding seasons
As temperatures shift, penguins are shifting their breeding seasons, too. A March 2012 study found
that Gentoo penguins are adapting more quickly to warmer weather, because they aren't as
dependent on sea ice for breeding as other species. It's not just penguins that seem to be responding
to climate change. Animal shelters in the U.S. have reported increasing numbers of stray cats and
kittens attributed to a longer breeding season for the felines.
Plate 11: Credit: Wally Walker, National Science Foundation
Source: Stephanie Pappas, Live Science Contributor, September 07, 2012
22 | P a g e
l) Moving the military northward
As the Arctic ice opens up, the world turns its attention to the resources below. According to the
U.S. Geological Survey, 30 percent of the world's undiscovered natural gas and 13 percent of its
undiscovered oil are under this region. As a result, military action in the Arctic is heating up, with
the United States, Russia, Denmark, Finland, Norway, Iceland, Sweden and Canada holding talks
about regional security and border issues. Several nations, including the U.S., are also drilling
troops in the far north, preparing for increased border patrol and disaster response efforts in a
busier Arctic.
Plate 12: Credit: Romain Schläppy, Paris, distributed by the EGU under a Creative Commons License.
Source: Stephanie Pappas, Live Science Contributor, September 07, 2012
m) Effects on Diseases
Certain vector-borne diseases carried by animals or insects, such as malaria and Lyme disease,
would become more widespread as warmer conditions expanded their range
n) Effect on Rocks: Carbon dioxide is mostly bounded chemically in rocks made from compounds
that chemists call carbonates. High temperature as result of the Greenhouse effect triggers a
chemical reaction which drives carbon dioxide from rock into the atmosphere, this in turn bakes
the rock, decays any organic matter within the rock and leaves it vulnerable to weathering
23 | P a g e
LOOKING FORWARD (MITIGATION OF GREEN HOUSE EFFECT)
This involves intervention or policies to reduce the emissions or enhance the sink of greenhouse
gases. the following policy options suggested below are a combination mitigation models gotten
from various countries like Australia, Philippines, Japan and organizations like the United Nations
Framework Convention on Climate Change(UNFCCC) through its current International legal
mechanism for countries to reduce their emissions:
1. The industrial sector: The first policy area should focus on the industrial sector which
is the main energy and carbon dioxide generator. The reduction of industrial carbon dioxide
can be achieved through these options:
 Structural changes affecting material utilization and recycling.
 Efficiency improvements
 Industrial process change
 Fuel-mix changes
 Implementation of energy efficiency measures
 Promotion of energy conservation
 Use of alternative non-CO2 emitting industrial processes
2. The transportation sector: The second policy should focus on the transportation sector.
Reduction in carbon monoxide emission in the transportation sector can be achieved
through the following option
 Energy efficiency
 Good road network
24 | P a g e
 Behavioral modification.
 Use/promotion of non-motorized transport modes which promotes healthy living
habit e.g. cycling and walking
 Development and use of efficient mass transport systems which help to reduce the
number of vehicles on the road and also reduce carbon monoxide emission too
 Emission control schemes focusing on improved fuel and vehicle efficiency
 Traffic volume reduction measure such as the Unified Vehicular Volume Reduction
Program (UVVRP)
 Fuel and vehicle tax policy
3. Renewable source of Energy: The third policy is on renewable. Renewables sources of
energy is extremely important in the mitigation of greenhouse gases. The following policy
options:
 Implementation of policies stimulating increased utilization of renewable.
 Invitation of international organization to support this policy in developing
countries.
 Eliminating fossil fuels, which currently provide 85% of all energy supplies
 Research and technology cost trends of renewables (solar, wind, biomass, hydro)
 Supply-side efficiency improvements; power plants efficiency improvement;
transmissions loss reduction; replacement of coal plants with natural gas combined
cycle plants
 Demand-side efficiency improvements; energy conservation, use of energy
efficient technologies
25 | P a g e
 Energy-efficient designs for new buildings
4. Forestry and agriculture: The fourth policy is on forestry and agriculture, since they
function as sinks for carbon dioxide emission. The necessary policy options to be taken
are:
 Implementation of policies to reverse deforestation
 Implementation of policies to cover sustainable forest management of existing
forest resources
 Implementation of soil conservation.
 Use of tubular polyethylene bio-digesters and urea-molasses mineral block as
nutrient supplement in animal production
 Use of sulfate fertilizers to reduce methane emissions
 Use of rice straw, water management and low-emitting cultivars
 Upgrading of food storage and distribution systems
 Promotion and implementation of judicious land –use planning
5. Information: Another policy area is on information. There is a desperate need for
simplified guides, easily accessible information to the public on Greenhouse effect. The
necessary policy option are:
 Involvement of environment non-governmental organization to give mass
campaign
 Implementation of Agenda 21 (the Rio Declaration on environment and
development, and the statement of principles for sustainable Management of
26 | P a g e
forests adopted by more than 178 governmentsRio de Janerio, Brazil, 3 to 14 June
1992) in collaboration with relevant organization. Agenda 21 is a comprehensive
plan of action to be taken globally, nationally and locally by organizations of the
united Nations system, Governments and major groups in every area in which
human impact on the environment.
27 | P a g e
Conclusion
Despite the series of evidences above some persons still believe and can prove that the Greenhouse
effect is the least our problems. They believe that in our efforts to conserve the beautiful planet
that is our home, we should not fixate on CO2. We should instead focus on issues like damage to
local landscapes and waterways by strip mining, inadequate cleanup, hazards to underground
miners, the excessive release of real pollutants such as mercury, other heavy metals, organic
carcinogens, etc.
No matter which side of the debate we stand, we should realize that reducing greenhouse gases
and moving to a low carbon economy will be associated with substantial health benefits. These
health benefits have a substantial economic impact everywhere, including developing countries.
It only takes a little change in lifestyle and behavior to make some big changes in greenhouse gas
reductions. For other types of actions, the changes are more significant. When that action is
multiplied by the approximately 160 million people in Nigeria or the 6 billion people worldwide,
the savings are significant.
“Individuals Can Make a Difference" identifies actions that many households and individuals can
take that reduce greenhouse gas emissions in addition to other benefits, including saving your
money and improving our health. The actions range from changes in the house, in the yard, in the
car, and in the store. Everyone's contribution counts so why don't you do your share?
28 | P a g e
REFERENCES
Brian S. Fisher, Stephen Brow, The economic impacts of uniform emission abatement,
‘Countdown to Kyoto’: The Consequences of the Mandatory Global Carbon Dioxide Emissions
Reductions, Australian APEC Study Centre, Canberra, 19–21 August 1997;
Cain Polidano, The impact of climate change policies on employment in the coalmining industry,
SAP 2.64/WP.115;
Church, J. A. and N.J. White (2006), A 20th century acceleration in global sea level rise,
Geophysical Research Letters, 33, L01602, doi:10.1029/2005GL024826.page 2
Clive Hamilton, John Quiggin, Economic Analysis of Greenhouse Policy, Discussion Paper
Number 15, December 1997, ISSN 1322-5421;
Department of Energy. The Philippine Energy Plan 2000-2009. The Philippines’ Initial National
Communication, December 1999, 91 pages.
Encarta Encyclopedia: Major Green House Gases and Their Percentages
Encarta Encyclopedia: A simplified diagram illustrating the global long term radiative balance of
the atmosphere.
Environmental Key Performance Indicators, Reporting Guidelines for UK Business, Department
for Environment, Food and Rural Affairs, www.defra.gov.uk, 2006;
Hom Pant, Global Trade and Environment Model (GTEM): A computable general equilibrium
model of the global economy and environment, Australian Bureau of Agricultural and Resource
Economics Canberra, 2002;
IPCC, 2007: Climate Change 2007: The Physical Science Basis. Contribution of Working Group
I to the Fourth Assessment Report of the Intergovernmental Panel on Climate Change [Solomon,
29 | P a g e
S., D. Qin, M. Manning, Z. Chen, M. Marquis, K.B. Averyt, M.Tignor and H.L. Miller (eds.)].
Cambridge University Press, Cambridge, United Kingdom and New York, NY, USA.
John M. Reilly, Sergey Paltsev, An Analysis of the European Emission Trading Scheme, MIT Joint
Program on the Science and Policy of Global Change, Report No. 127, October 2005;
Joseph Fiksel, Key Performance Indicators, World Business Council for Sustainable
Development, March 2002;
Lisa Segnestam, Environmental Performance Indicators, A Second Edition Note, Environmental
Economics Series, Paper No. 71, October 1999;
Niki Leahy, Integrating Environmental KPIs with Financial KPIs, CSR Report 2006;
R.C. Hyman, J.M. Reilly, M.H. Babiker, A. De Masin and H.D. Jacob, Modeling Non-CO2
Greenhouse Gas Abatement, MIT Joint Program on the Science and Policy of Global Change,
Report No. 94, December 2002;
Schlesinger, M.E., Andronova, N., Ghanem, A., Malyshev, S., Reichler, T., Rozanov, E., Wang,
W., and Yang, F. 1997. Geographical Scenarios of Greenhouse-Gas and Anthropogenic-Sulfate-
Aerosol Induced Climate Changes. University of Illinois at Urbana-Champaign, Department of
Atmospheric Science, Climate Research Group, Urbana-Champaign, IL.
Schlesinger, M. E.,S. Malyshev, E. V. Rozanov, F. Yang, N. G. Andronova, B. de Vries, A.
Grubler, K. Jiang, T. Masui, T. Morita, J. Penner, W. Pepper, A. Sankovski, and Y. Zhang. 2000.
“Geographical Distributions of Temperature Change for Scenarios of Greenhouse Gas and Sulfur
Dioxide Emissions.” Technological Forecasting and Social Change 65:167-193.
Schlesinger, M.E., and Zhao, Z.-C. 1989. “Seasonal climate changes induced by doubled CO2 as
simulated by the OSU atmospheric GCM/mixed-layer ocean model.” Journal of Climate 2:459-
495.
30 | P a g e
Sellers, P.J., L. Bounoua, G.J. Collatz, D.A. Randall, D.A. Dazlich, S.O. Los, J.A. Berry, I. Fung,
C.J. Tucker, C.B. Field, and T.G. Jensen. 1996. “Comparison of Radiative and Physiological
Effects of Doubled Atmospheric CO2 on Climate.” Science 271:1402- 1406.
Singh, B., and M. El Maayar. 1998. “Potential impacts of greenhouse gas climate change scenarios
on sugar cane yields in Trinidad.”
Tropical Agriculture 75( ):348-353.
Sonja Peterson, CGE Models and Their Application for Climate Policy Analysis, Kiel Institute for
World Economics, Germany, Octombrie 2003;
Stephanie Pappas, Live Science Contributor, September 07, 2012, Credit: Kenneth Lohmann,
University of North Carolina at Chapel Hill
Stephanie Pappas, Live Science Contributor, September 07, 2012, Credit: USFWS
Stephanie Pappas, Live Science Contributor, September 07, 2012, Credit: Giovanni
Cancemi | Shutterstock
Stephanie Pappas, Live Science Contributor, September 07, 2012, Credit: Andrea El-Wailly
Stephanie Pappas, Live Science Contributor, September 07, 2012, Credit: © Houghton Library,
President and Fellows of Harvard College
Stephanie Pappas, Live Science Contributor, September 07, 2012, Credit: Don Becker, USGS
Stephanie Pappas, Live Science Contributor, September 07, 2012, Credit: Wally Walker,
National Science Foundation
Stephanie Pappas, Live Science Contributor, September 07, 2012, Credit: Romain Schläppy,
Paris, distributed by the EGU under a Creative Commons License.
Yohe, G., J.E. Neumann, and P. Marshall. 1999. “The economic damage induced by sea level rise
in the United States,” Chapter 7 in The Impact of Climate Change on the United States Economy,
R. Mendelsohn and J. Neumann, eds., Cambridge University Press, Cambridge, England, pp. 178-
208.

More Related Content

What's hot

A reaction paper in science(global warming)
A reaction paper in science(global warming)A reaction paper in science(global warming)
A reaction paper in science(global warming)
Andrei Pagsolingan
 
Research Proposal: Global warming, human cause or natural cycle?
Research Proposal: Global warming, human cause or natural cycle?Research Proposal: Global warming, human cause or natural cycle?
Research Proposal: Global warming, human cause or natural cycle?AENovak
 
Lesson 1 Introduction
Lesson 1 IntroductionLesson 1 Introduction
Lesson 1 Introduction
Dr. P.B.Dharmasena
 
Global warming
Global warmingGlobal warming
Global warmingVikas Soni
 
Global Climatic Change.
Global Climatic Change.Global Climatic Change.
Global Climatic Change.Sailesh K C
 
A review climate change and carbon capture
A review climate change and carbon captureA review climate change and carbon capture
A review climate change and carbon capture
Prodeep Mookerjee
 
Global warming by khadar
Global warming by khadarGlobal warming by khadar
Global warming by khadar
khadar hussain
 
CLIMATE CHANGE AND its IMPACT ON INDIA
CLIMATE CHANGE AND its IMPACT ON INDIACLIMATE CHANGE AND its IMPACT ON INDIA
CLIMATE CHANGE AND its IMPACT ON INDIA
paperpublications3
 
Global warming and greenhouse effect
Global warming and greenhouse effectGlobal warming and greenhouse effect
Global warming and greenhouse effect
Sohel Rana
 
Greenhouse effect and global warming
Greenhouse effect and global warmingGreenhouse effect and global warming
Greenhouse effect and global warming
Md Fahimuzzaman
 
Ten clear indicators our climate is changing
Ten clear indicators our climate is changingTen clear indicators our climate is changing
Ten clear indicators our climate is changing
Liwayway Memije-Cruz
 
Climate presentation
Climate presentationClimate presentation
Climate presentationYCIS Beijing
 
Global warming 12345 my project file
Global warming 12345  my project fileGlobal warming 12345  my project file
Global warming 12345 my project file
shaista_khurshid
 
Climate change
Climate changeClimate change
Climate change
Vivek Kumar
 
Global Warming by: Jay Tusi - Assignment 3
Global Warming by: Jay Tusi - Assignment 3Global Warming by: Jay Tusi - Assignment 3
Global Warming by: Jay Tusi - Assignment 3zareena0110
 
Green chemistry webquest
Green chemistry webquestGreen chemistry webquest
Green chemistry webquestSuzuki95
 
Climatechange2010
Climatechange2010Climatechange2010
Climatechange2010
cenafrica
 
Global warming & Various Aspects
Global warming & Various AspectsGlobal warming & Various Aspects
Global warming & Various Aspects
Abhishek Mahajan
 

What's hot (20)

A reaction paper in science(global warming)
A reaction paper in science(global warming)A reaction paper in science(global warming)
A reaction paper in science(global warming)
 
Research Proposal: Global warming, human cause or natural cycle?
Research Proposal: Global warming, human cause or natural cycle?Research Proposal: Global warming, human cause or natural cycle?
Research Proposal: Global warming, human cause or natural cycle?
 
Global warming assignment
Global warming assignmentGlobal warming assignment
Global warming assignment
 
Lesson 1 Introduction
Lesson 1 IntroductionLesson 1 Introduction
Lesson 1 Introduction
 
Global warming
Global warmingGlobal warming
Global warming
 
Global Climatic Change.
Global Climatic Change.Global Climatic Change.
Global Climatic Change.
 
A review climate change and carbon capture
A review climate change and carbon captureA review climate change and carbon capture
A review climate change and carbon capture
 
Global warming by khadar
Global warming by khadarGlobal warming by khadar
Global warming by khadar
 
CLIMATE CHANGE AND its IMPACT ON INDIA
CLIMATE CHANGE AND its IMPACT ON INDIACLIMATE CHANGE AND its IMPACT ON INDIA
CLIMATE CHANGE AND its IMPACT ON INDIA
 
Global warming and greenhouse effect
Global warming and greenhouse effectGlobal warming and greenhouse effect
Global warming and greenhouse effect
 
Greenhouse effect and global warming
Greenhouse effect and global warmingGreenhouse effect and global warming
Greenhouse effect and global warming
 
Ten clear indicators our climate is changing
Ten clear indicators our climate is changingTen clear indicators our climate is changing
Ten clear indicators our climate is changing
 
Climate presentation
Climate presentationClimate presentation
Climate presentation
 
Gw Final
Gw FinalGw Final
Gw Final
 
Global warming 12345 my project file
Global warming 12345  my project fileGlobal warming 12345  my project file
Global warming 12345 my project file
 
Climate change
Climate changeClimate change
Climate change
 
Global Warming by: Jay Tusi - Assignment 3
Global Warming by: Jay Tusi - Assignment 3Global Warming by: Jay Tusi - Assignment 3
Global Warming by: Jay Tusi - Assignment 3
 
Green chemistry webquest
Green chemistry webquestGreen chemistry webquest
Green chemistry webquest
 
Climatechange2010
Climatechange2010Climatechange2010
Climatechange2010
 
Global warming & Various Aspects
Global warming & Various AspectsGlobal warming & Various Aspects
Global warming & Various Aspects
 

Viewers also liked

Solar roads seminar
Solar roads seminarSolar roads seminar
Solar roads seminar
Daanish Zama
 
Solar Roadways PPT
Solar Roadways PPTSolar Roadways PPT
Solar Roadways PPT
Seminar Links
 
Solar roadways presented by RK
Solar roadways presented by RKSolar roadways presented by RK
Solar roadways presented by RK
Raam Krishna Prakash Jagali
 
SOLAR ROADWAYS ~ Ch. Sai Krishna
SOLAR ROADWAYS ~ Ch. Sai Krishna SOLAR ROADWAYS ~ Ch. Sai Krishna
SOLAR ROADWAYS ~ Ch. Sai Krishna
Sai Krishna
 
solar roadways
solar roadwayssolar roadways
solar roadways
Jaya Chandran
 
Smart Highways
Smart HighwaysSmart Highways
Smart Highways
Tink Newman
 
automated highways system
automated highways systemautomated highways system
automated highways systemHarish Naicker
 
Solar Roadways
Solar RoadwaysSolar Roadways
Solar Roadways
Puru Agrawal
 
Solar Roadways - The future transport system ( Seminar report by Swapnil Patw...
Solar Roadways - The future transport system ( Seminar report by Swapnil Patw...Solar Roadways - The future transport system ( Seminar report by Swapnil Patw...
Solar Roadways - The future transport system ( Seminar report by Swapnil Patw...
Swapneil Patwari
 
Future challenges in computer science
Future challenges in computer scienceFuture challenges in computer science
Future challenges in computer science
Seminar Links
 
RBI CASTINGS AND PRECISION MACHINE PARTS
RBI CASTINGS AND PRECISION MACHINE PARTSRBI CASTINGS AND PRECISION MACHINE PARTS
RBI CASTINGS AND PRECISION MACHINE PARTS
Joseph M. Oldroyd
 
De las herramientas a la información accionable
De las herramientas a la información accionableDe las herramientas a la información accionable
De las herramientas a la información accionable
Tomas Sawada
 
economic-and-resiliency-impact-of-pv-and-storage
economic-and-resiliency-impact-of-pv-and-storageeconomic-and-resiliency-impact-of-pv-and-storage
economic-and-resiliency-impact-of-pv-and-storageTravis Simpkins
 

Viewers also liked (15)

Solar roads seminar
Solar roads seminarSolar roads seminar
Solar roads seminar
 
Solar Roadways PPT
Solar Roadways PPTSolar Roadways PPT
Solar Roadways PPT
 
Solar roadways presented by RK
Solar roadways presented by RKSolar roadways presented by RK
Solar roadways presented by RK
 
SOLAR ROADWAYS ~ Ch. Sai Krishna
SOLAR ROADWAYS ~ Ch. Sai Krishna SOLAR ROADWAYS ~ Ch. Sai Krishna
SOLAR ROADWAYS ~ Ch. Sai Krishna
 
solar roadways
solar roadwayssolar roadways
solar roadways
 
Smart Highways
Smart HighwaysSmart Highways
Smart Highways
 
automated highways system
automated highways systemautomated highways system
automated highways system
 
Solar Roadways
Solar RoadwaysSolar Roadways
Solar Roadways
 
Solar Roadways - The future transport system ( Seminar report by Swapnil Patw...
Solar Roadways - The future transport system ( Seminar report by Swapnil Patw...Solar Roadways - The future transport system ( Seminar report by Swapnil Patw...
Solar Roadways - The future transport system ( Seminar report by Swapnil Patw...
 
Future challenges in computer science
Future challenges in computer scienceFuture challenges in computer science
Future challenges in computer science
 
RBI CASTINGS AND PRECISION MACHINE PARTS
RBI CASTINGS AND PRECISION MACHINE PARTSRBI CASTINGS AND PRECISION MACHINE PARTS
RBI CASTINGS AND PRECISION MACHINE PARTS
 
Revised-Ram Babu chaurasiya
Revised-Ram Babu chaurasiyaRevised-Ram Babu chaurasiya
Revised-Ram Babu chaurasiya
 
De las herramientas a la información accionable
De las herramientas a la información accionableDe las herramientas a la información accionable
De las herramientas a la información accionable
 
economic-and-resiliency-impact-of-pv-and-storage
economic-and-resiliency-impact-of-pv-and-storageeconomic-and-resiliency-impact-of-pv-and-storage
economic-and-resiliency-impact-of-pv-and-storage
 
Por unha tarifa eléctrica galega [completo]
Por unha tarifa eléctrica galega [completo]Por unha tarifa eléctrica galega [completo]
Por unha tarifa eléctrica galega [completo]
 

Similar to 2AM SEMINAR WORK

Climate Change Anthropogenic or Beyond
Climate Change Anthropogenic or BeyondClimate Change Anthropogenic or Beyond
Climate Change Anthropogenic or Beyond
Arifur Rahman
 
Global warming and greenhouse effect
Global warming and greenhouse effectGlobal warming and greenhouse effect
Global warming and greenhouse effectVinayak Verma
 
Global warming
Global warmingGlobal warming
Global warming
Denisa Gabriela
 
EVS PRESENTATION [GROUP J].pptx
EVS PRESENTATION [GROUP J].pptxEVS PRESENTATION [GROUP J].pptx
EVS PRESENTATION [GROUP J].pptx
AmanMalakar2
 
GLOBAL_WARMING_PRESENTATION.pptx
GLOBAL_WARMING_PRESENTATION.pptxGLOBAL_WARMING_PRESENTATION.pptx
GLOBAL_WARMING_PRESENTATION.pptx
ssuser923798
 
Clamate change introduction class 1.pptx
Clamate change introduction class 1.pptxClamate change introduction class 1.pptx
Clamate change introduction class 1.pptx
Lavanya943804
 
Global Warming And The Greenhouse Effect Essay
Global Warming And The Greenhouse Effect EssayGlobal Warming And The Greenhouse Effect Essay
Global Warming And The Greenhouse Effect Essay
Buy A College Paper
 
Greenhouse effect
Greenhouse effectGreenhouse effect
Greenhouse effect
Omprakash Patel
 
The Impact of Global Warming on the Global Climate
The Impact of Global Warming on the Global ClimateThe Impact of Global Warming on the Global Climate
The Impact of Global Warming on the Global Climate
IJERA Editor
 
Air Pollution (1).ppt
Air Pollution (1).pptAir Pollution (1).ppt
Air Pollution (1).ppt
RohitPaul71
 
Greenhouse Effect Essay
Greenhouse Effect EssayGreenhouse Effect Essay
Greenhouse Effect Essay
Best Online Paper Writing Service
 
Global_warming_presentation.pptx
Global_warming_presentation.pptxGlobal_warming_presentation.pptx
Global_warming_presentation.pptx
viveksingh20861
 
Essays About Global Warming
Essays About Global WarmingEssays About Global Warming
Essays About Global Warming
Best Online Paper Writing Service
 
11 What causes weather changes and how we can stop damaging the earth for goo...
11 What causes weather changes and how we can stop damaging the earth for goo...11 What causes weather changes and how we can stop damaging the earth for goo...
11 What causes weather changes and how we can stop damaging the earth for goo...
FrankieMcfarlane
 
Green building notes
Green building notesGreen building notes
Green building notes
Aaqib Iqbal
 
Presentation The Effect of Greenhouse Gases on Earth’s Temperature .pptx
Presentation The Effect of Greenhouse Gases on Earth’s Temperature .pptxPresentation The Effect of Greenhouse Gases on Earth’s Temperature .pptx
Presentation The Effect of Greenhouse Gases on Earth’s Temperature .pptx
BigBoss647822
 
GLoBal WaRmiNg..
GLoBal WaRmiNg..GLoBal WaRmiNg..
GLoBal WaRmiNg..
Anish Raj Goyal
 
Global Warming magazine article
Global Warming magazine articleGlobal Warming magazine article
Global Warming magazine articlealshapatel
 
Global Warming. Grupa 8220. Munteanu Ana- Cristina
Global Warming. Grupa 8220. Munteanu Ana- CristinaGlobal Warming. Grupa 8220. Munteanu Ana- Cristina
Global Warming. Grupa 8220. Munteanu Ana- CristinaTina Munteanu
 
GLOBAL WARMING AND GREEN HOUSE EFFECT
GLOBAL WARMING AND GREEN HOUSE EFFECTGLOBAL WARMING AND GREEN HOUSE EFFECT
GLOBAL WARMING AND GREEN HOUSE EFFECTGopa Goutami
 

Similar to 2AM SEMINAR WORK (20)

Climate Change Anthropogenic or Beyond
Climate Change Anthropogenic or BeyondClimate Change Anthropogenic or Beyond
Climate Change Anthropogenic or Beyond
 
Global warming and greenhouse effect
Global warming and greenhouse effectGlobal warming and greenhouse effect
Global warming and greenhouse effect
 
Global warming
Global warmingGlobal warming
Global warming
 
EVS PRESENTATION [GROUP J].pptx
EVS PRESENTATION [GROUP J].pptxEVS PRESENTATION [GROUP J].pptx
EVS PRESENTATION [GROUP J].pptx
 
GLOBAL_WARMING_PRESENTATION.pptx
GLOBAL_WARMING_PRESENTATION.pptxGLOBAL_WARMING_PRESENTATION.pptx
GLOBAL_WARMING_PRESENTATION.pptx
 
Clamate change introduction class 1.pptx
Clamate change introduction class 1.pptxClamate change introduction class 1.pptx
Clamate change introduction class 1.pptx
 
Global Warming And The Greenhouse Effect Essay
Global Warming And The Greenhouse Effect EssayGlobal Warming And The Greenhouse Effect Essay
Global Warming And The Greenhouse Effect Essay
 
Greenhouse effect
Greenhouse effectGreenhouse effect
Greenhouse effect
 
The Impact of Global Warming on the Global Climate
The Impact of Global Warming on the Global ClimateThe Impact of Global Warming on the Global Climate
The Impact of Global Warming on the Global Climate
 
Air Pollution (1).ppt
Air Pollution (1).pptAir Pollution (1).ppt
Air Pollution (1).ppt
 
Greenhouse Effect Essay
Greenhouse Effect EssayGreenhouse Effect Essay
Greenhouse Effect Essay
 
Global_warming_presentation.pptx
Global_warming_presentation.pptxGlobal_warming_presentation.pptx
Global_warming_presentation.pptx
 
Essays About Global Warming
Essays About Global WarmingEssays About Global Warming
Essays About Global Warming
 
11 What causes weather changes and how we can stop damaging the earth for goo...
11 What causes weather changes and how we can stop damaging the earth for goo...11 What causes weather changes and how we can stop damaging the earth for goo...
11 What causes weather changes and how we can stop damaging the earth for goo...
 
Green building notes
Green building notesGreen building notes
Green building notes
 
Presentation The Effect of Greenhouse Gases on Earth’s Temperature .pptx
Presentation The Effect of Greenhouse Gases on Earth’s Temperature .pptxPresentation The Effect of Greenhouse Gases on Earth’s Temperature .pptx
Presentation The Effect of Greenhouse Gases on Earth’s Temperature .pptx
 
GLoBal WaRmiNg..
GLoBal WaRmiNg..GLoBal WaRmiNg..
GLoBal WaRmiNg..
 
Global Warming magazine article
Global Warming magazine articleGlobal Warming magazine article
Global Warming magazine article
 
Global Warming. Grupa 8220. Munteanu Ana- Cristina
Global Warming. Grupa 8220. Munteanu Ana- CristinaGlobal Warming. Grupa 8220. Munteanu Ana- Cristina
Global Warming. Grupa 8220. Munteanu Ana- Cristina
 
GLOBAL WARMING AND GREEN HOUSE EFFECT
GLOBAL WARMING AND GREEN HOUSE EFFECTGLOBAL WARMING AND GREEN HOUSE EFFECT
GLOBAL WARMING AND GREEN HOUSE EFFECT
 

2AM SEMINAR WORK

  • 1. PAPER ON THE EFFECT OF GREEN HOUSE GASESON THE ENVIRONMENT BY ARIERE ARODOVWEMARVELOUS(1101/2012) EARTH SCIENCE DEPARTMENT (GEOLOGY OPTION) JUNE, 2016 Abstract The amount of solar energy absorbed or radiated by Earth is modulated by the atmosphere and depends on its composition. Greenhouse gases - such as water vapor, carbon dioxide, and methane - occur naturally in small amounts and absorb and release heat energy more efficiently than abundant atmospheric gases like nitrogen and oxygen. Small increases in carbon dioxide concentration have a large effect on the climate system. The existence of a heavier layer of greenhouse effect gases at the level of the entire planet triggers significant climate changes. This paper intends to present the main environmental indicators elaborated by various specialized international bodies, and the models used by different governmental or non-governmental bodies for studying the impact/effects of greenhouse effect gas emissions on the environment, climatic changes or economic development.
  • 2. 1 | P a g e TABLE OF CONTENT Executive Summary........................................................................................................................1 Introduction.....................................................................................................................................1 Understanding Green House Effect.................................................................................................1 Looking Forward.............................................................................................................................1 Table of Content ………………………………………………………………………………….1 ABSTRACT……………………………………………………………………………. INTRODUCTION……………………………………………………………………...3 What are Greenhouse Gases……………………………………………………………..3 Sources of Greenhouse Gases…………………………………………………………...5 Types of Greenhouse Gases…...………………………………………………………...6 What is the Greenhouse Effect………………………………………………………….7 UNDERSTANDING THE GREEN HOUSE EFFECT……………………………....9 What causes the Greenhouse Effect………..………………………………………….....9 How do humans contribute to the Greenhouse Effect……..…………………………….10 Scientific issues surrounding the Greenhouse Effect……….………………………..….11 Consequences of enhanced Greenhouse effect…..……………………………….....…..16 LOOKING FORWARD (MITIGATION TO THE GREEN HOUSE EFFECT)…22 The Industrial Sector……………………………………………………………………23 The Transportation Sector………………………………………………………………23 Renewables…………………………………………………………………………….24 Forestry and Agriculture………………………………………………………………25 Information……………………………………………………………………………25
  • 3. 2 | P a g e CONCLUSION…………………………………………………..……………………….27 REFERENCES……………………………………………………………………………28
  • 4. 3 | P a g e INTRODUCTION The Sun powers Earth’s climate, radiating energy at very short wavelengths, predominately in the visible or near-visible (e.g., ultraviolet) part of the spectrum. Roughly one-third of the solar energy that reaches the top of Earth’s atmosphere is reflected directly back to space. The remaining two- thirds is absorbed by the surface and, to a lesser extent, by the atmosphere. To balance the absorbed incoming energy, the Earth must, on average, radiate the same amount of energy back to space. Because the Earth is much colder than the Sun, it radiates at much longer wavelengths, primarily in the infrared part of the spectrum. Much of this thermal radiation emitted by the land and ocean is absorbed by the atmosphere, including clouds, and reradiated back to Earth. This is called the greenhouse effect. The glass walls in a greenhouse reduce airflow and increase the temperature of the air inside. Analogously, but through a different physical process, the Earth’s greenhouse effect warms the surface of the planet. Without the natural greenhouse effect, the average temperature at Earth’s surface would be below the freezing point of water. Thus, Earth’s natural greenhouse effect makes life as we know it possible. However, human activities, primarily the burning of fossil fuels and clearing of forests, have greatly intensified the natural greenhouse effect, causing global warming. What are greenhouse gases? Greenhouse gases include methane, chlorofluorocarbons and carbon dioxide. These gases act as a shield that traps heat in the earth’s atmosphere. A greenhouse gas is any gaseous compound in the atmosphere that is capable of absorbing infrared radiation, thereby trapping and holding heat in the atmosphere. By increasing the heat in the atmosphere, greenhouse gases are responsible for the greenhouse effect, which ultimately leads to global warming. The two most abundant gases in the atmosphere, nitrogen (comprising 78% of the dry atmosphere) and oxygen (comprising 21%), exert almost no greenhouse effect. Instead, the greenhouse effect comes from molecules that are more complex and much less common. Water vapour is the most important greenhouse gas, and carbon dioxide (CO2) is the second-most important one. Methane, nitrous oxide, ozone and several other gases present in the atmosphere in small amounts also contribute to the greenhouse effect. In the humid equatorial regions, where there is so much water vapour in the air that the greenhouse effect is very large, adding a small additional amount of CO2 or water vapour has only a small direct impact on downward infrared
  • 5. 4 | P a g e radiation. However, in the cold, dry polar regions, the effect of a small increase in CO2 or water vapour is much greater. The same is true for the cold, dry upper atmosphere where a small increase in water vapour has a greater influence on the greenhouse effect than the same change in water vapour would have near the surface. Several components of the climate system, notably the oceans and living things, affect atmospheric concentrations of greenhouse gases. A prime example of this is plants taking CO2 out of the atmosphere and converting it (and water) into carbohydrates via photosynthesis. In the industrial era, human activities have added greenhouse gases to the atmosphere, primarily through the burning of fossil fuels and clearing of forests. Adding more of a greenhouse gas, such as CO2, to the atmosphere intensifies the greenhouse effect, thus warming Earth’s climate. The amount of warming depends on various feedback mechanisms. For example, as the atmosphere warms due to rising levels of greenhouse gases, its concentration of water vapour increases, further intensifying the greenhouse effect. This in turn causes more warming, which causes an additional increase in water vapour, in a self-reinforcing cycle. This water vapour feedback may be strong enough to approximately double the increase in the greenhouse effect due to the added CO2 alone. Additional important feedback mechanisms involve clouds. Clouds are effective at absorbing infrared radiation and therefore exert a large greenhouse effect, thus warming the Earth. Clouds are also effective at reflecting away incoming solar radiation, thus cooling the Earth. A change in almost any aspect of clouds, such as their type, location, water content, cloud altitude, particle size and shape, or lifetimes, affects the degree to which clouds warm or cool the Earth. Some changes amplify warming while others diminish it. Much research is in progress to better understand how clouds change in response to climate warming, and how these changes affect climate through various feedback mechanisms.
  • 6. 5 | P a g e Sources of greenhouse gases Some greenhouse gases, like methane, are produced through agricultural practices including livestock manure management. Others, like CO2, largely result from natural processes like respiration and from the burning of fossil fuels like coal, oil and gas. The production of electricity is the source of 70 percent of the United States' sulfur dioxide emissions, 13 percent of nitrogen oxide emissions, and 40 percent of carbon dioxide emissions, according to the EPA. The second cause of CO2 release is deforestation, according to research published by Duke University. When trees are killed to produce goods or heat, they release the carbon that is normally stored for photosynthesis. This process releases nearly a billion tons of carbon into the atmosphere per year, according to the 2010 Global Forest Resources Assessment. It's worth noting that forestry and other land-use practices offset some of these greenhouse gas emissions, according to the EPA. "Replanting helps to reduce the buildup of carbon dioxide in the atmosphere as growing trees sequester carbon dioxide through photosynthesis. Atmospheric carbon dioxide is converted and stored in the vegetation and soils of the forest. However, forests cannot sequester all of the carbon dioxide we are emitting to the atmosphere through the burning of fossil fuels and a reduction in fossil fuel emissions is still necessary to avoid build up in the atmosphere," said Daley. Worldwide, the output of greenhouse gases is a source of grave concern: From the time the Industrial Revolution began to the year 2009, atmospheric CO2 levels have increased almost 38 percent and methane levels have increased a whopping 148 percent, according to NASA, and most of that increase has been in the past 50 years. Because of global warming, 2014 was the warmest year on record and 10 of the hottest years have all come after 1998. "The warming we observe affects atmospheric circulation, which impacts rainfall patterns globally. This will lead to big environmental changes, and challenges, for people all across the globe," Josef Werne, an associate professor in the department of geology and planetary science at the University of Pittsburgh, told Live Science.
  • 7. 6 | P a g e If these trends continue, scientists, government officials and a growing number of citizens fear that the worst effects of global warming — extreme weather, rising sea levels, plant and animal extinctions, ocean acidification, major shifts in climate and unprecedented social upheaval — will be inevitable. In answer to the problems caused by global warming by greenhouse gasses, the government created a climate action plan in 2013. Types of Greenhouse gases Greenhouse gases comprise less than 1% of the atmosphere. Their levels are determined by a balance between “sources” and “sinks”. Sources and sinks are processes that generate and destroy greenhouse gases respectively. Human affect greenhouse gas levels by introducing new sources or by interfering with natural sinks. The major greenhouse gases in the atmosphere are carbon dioxide (CO2), methane, (CH4), nitrous oxide (N2O), chlorofluorocarbons (CFCs) and ozone (O3). Atmospheric water vapour (H2O) also makes a large contribution to the natural greenhouse effect but it is thought that its presence is not directly affected by human activity. Characteristics of some of the greenhouse gases are shown in Table 1 below Plate 1: Major Green House Gases and Their Percentages Source: Encarta Encyclopedia
  • 8. 7 | P a g e Table 1: Characteristics of some major greenhouse gases What is the Greenhouse Effect? The “Greenhouse Effect” is a term that refers to a physical property of the Earth's atmosphere. If the Earth had no atmosphere, its average surface temperature would be very low of about 18℃ rather than the comfortable 15℃ found today. The difference in temperature is due to a suite of gases called greenhouse gases which affect the overall energy balance of the Earth's system by absorbing infrared radiation. In its existing state, the Earth atmosphere system balances absorption of solar radiation by emission of infrared radiation to space. Due to greenhouse gases, the atmosphere absorbs more infrared energy than it reradiates to space, resulting in a net warming of the Earth atmosphere system and of surface temperature. This is the “Natural Greenhouse Effect”. With more greenhouse gases released to the atmosphere due to human activity, more infrared
  • 9. 8 | P a g e radiation will be trapped in the Earth's surface which contributes to the “Enhanced Greenhouse Effect”. The greenhouse effect increases the temperature of the Earth by trapping heat in our atmosphere. This keeps the temperature of the Earth higher than it would be if direct heating by the Sun was the only source of warming. When sunlight reaches the surface of the Earth, some of it is absorbed which warms the ground and some bounces back to space as heat. Greenhouse gases that are in the atmosphere absorb and then redirect some of this heat back towards the Earth. The greenhouse effect is a major factor in keeping the Earth warm because it keeps some of the planet's heat that would otherwise escape from the atmosphere out to space. In fact, without the greenhouse effect the Earth's average global temperature would be much colder and life on Earth as we know it would not be possible. The difference between the Earth's actual average temperature 14° C (57.2° F) and the expected effective temperature just with the Sun's radiation -19° C (-2.2° F) gives us the strength of the greenhouse effect, which is 33° C The greenhouse effect is a natural process that is millions of years old. It plays a critical role in regulating the overall temperature of the Earth. The greenhouse effect was first discovered by Joseph Fourier in 1827, experimentally verified by John Tyndall in 1861, and quantified by Svante Arrhenius in 1896. Plate 2 A simplified diagram illustrating the global long term radiative balance of the atmosphere. Source: Encarta Encyclopedia
  • 10. 9 | P a g e * Carbon dioxide’s lifetime is poorly defined because the gas is not destroyed over time, but instead moves among different parts of the ocean–atmosphere–land system. Some of the excess carbon dioxide will be absorbed quickly (for example, by the ocean surface), but some will remain in the atmospherefor thousands of years,due in part to the very slowprocess by whichcarbonis transferred to ocean sediments. Table 2: Major Long-Lived Greenhouse Gases and Their Characteristics UNDERSTANDING THE GREEN HOUSE EFFECT What Causes the Greenhouse Effect? Life on earth depends on energy from the sun. About 30 percent of the sunlight that beams toward Earth is deflected by the outer atmosphere and scattered back into space. The rest reaches the planet's surface and is reflected upward again as a type of slow-moving energy called infrared radiation. The heat caused by infrared radiation is absorbed by greenhouse gases such as water vapor, carbon dioxide, ozone and methane, which slows its escape from the atmosphere. Although greenhouse gases make up only about 1 percent of the Earth's atmosphere, they regulate our climate by trapping heat and holding it in a kind of warm-air blanket that surrounds the planet.
  • 11. 10 | P a g e This phenomenon is what scientists call the greenhouse effect. Without it, scientists estimate that the average temperature on Earth would be colder by approximately 30 degrees Celsius (54 degrees Fahrenheit), far too cold to sustain most of our current ecosystems. How Do Humans Contribute to the Greenhouse Effect? While the greenhouse effect is an essential environmental prerequisite for life on Earth, there really can be too much of a good thing. The problems begin when human activities distort and accelerate the natural process by creating more greenhouse gases in the atmosphere than are necessary to warm the planet to an ideal temperature.  Burning natural gas, coal and oil, including gasoline for automobile engines, raises the level of carbon dioxide in the atmosphere.  Some farming practices and other land uses increase the levels of methane and nitrous oxide.  Many factories produce long-lasting industrial gases that do not occur naturally, yet contribute significantly to the enhanced greenhouse effect and global warming that is currently under way.  Deforestation also contributes to global warming. Trees use carbon dioxide and give off oxygen in its place, which helps to create the optimal balance of gases in the atmosphere. As more forests are logged for timber or cut down to make way for farming, however, there are fewer trees to perform this critical function. At least some of the damage can be offset when young forests aggressively regrow, capturing tons of carbon.  Population growth is another factor in global warming, because as more people use fossil fuels for heat, transportation and manufacturing the level of greenhouse gases continues to increase. As more farming occurs to feed millions of new people, more greenhouse gases enter the atmosphere. Ultimately, more greenhouse gases means more infrared radiation trapped and held, which gradually increases the temperature of the Earth's surface, the air in the lower atmosphere,and ocean waters.
  • 12. 11 | P a g e Scientific Issues Surrounding the Greenhouse Effect It is helpful to break down the set of issues known as the greenhouse effect into a series of stages, each feeding into another, and then to consider how policy questions might be addressed in the context of these more technical stages. Projecting emissions. Behavioral assumptions must be made in order to project future use of fossil fuels (or deforestation, because this too can impact the amount of CO2 in the atmosphere--it accounts for about 20% of the recent total CO2 injection of about 5.5 x 10 9 metric tons). The essence of this aspect then is social science. Projections must be made of human population, the per capita consumption of fossil fuel, deforestation rates, reforestation activities, and perhaps even countermeasures to deal with the extra CO2 in the air. These projections depend on issues such as the likelihood that alternative energy systems or conservation measures will be available, their price, and their social acceptability. Furthermore, trade in fuel carbon (for example, a large-scale transfer from coal-rich to coal-poor nations) will depend not only on the energy requirements and the available alternatives but also on the economic health of the potential importing nations. This trade in turn will depend upon whether those nations have adequate capital resources to spend on energy rather than other precious strategic commodities--such as food or fertilizer as well as some other strategic materials such as weaponry. Total CO2 emissions from energy systems, for example, can be expressed by a formula termed "the population multiplier" by Ehrlich and Holdren The first term represents engineering effects, the second standard of living, and the third demography in this version, which is expanded from the original. In order to quantify future changes, we can make scenarios that show alternative CO2 futures based on assumed rates of growth in the use of fossil fuels. Most typical projections are in the 0.5 to 2% annual growth range for fossil fuel use and imply that CO2 concentrations will double (to 600 ppm) in the 21st century. There is virtually no dispute among scientists that the CO2 concentration in the atmosphere has already increased by @25% since @1850. The record at Mauna Loa observatory shows that concentrations have increased from about 310 to more than 350 ppm since 1958. Superimposed on this trend is a large annual cycle in which CO2 reaches a maximum in the spring
  • 13. 12 | P a g e of each year in the Northern Hemisphere and a minimum in the fall. The fall minimum is generally thought to result from growth of the seasonal biosphere in the Northern Hemisphere summer whereby photosynthesis increases faster than respiration and atmospheric CO2 levels are reduced. After September, the reverse occurs and respiration proceeds at a faster rate than photosynthesis and CO2 levels increase. Analyses of trapped air in several ice cores suggest that during the past several thousand years of the present interglacial, CO2 levels have been reasonably close to the pre-industrial value of 280 ppm. However, since about 1850, CO2 has risen @25%. At the maximum of the last Ice Age 18,000 years ago, CO2 levels were roughly 25% lower than pre industrial values. The data also reveal a close correspondence between the inferred temperature at Antarctica and the measured CO2 concentration from gas bubbles trapped in ancient ice. However, whether the CO2 level was a response to or caused the temperature changes is debated: CO2 may have simply served as an amplifier or positive feedback mechanism for climate change--that is, less CO2, colder temperatures. This uncertainty arises because the specific bio geophysical mechanisms that cause CO2 to change in step with the climate are not yet elucidated. Methane concentrations in bubbles in ice cores also show a similar close relation with climate during the past 150,000 years. Other greenhouse gases like chlorofluorocarbons (CFCs), CH4, nitrogen oxides, tropospheric ozone, and others could, together, be as important as CO2 in augmenting the greenhouse effect, but some of these depend on human behavior and have complicated biogeochemical interactions. These complications account for the large error bars. Space does not permit a proper treatment of individual aspects of each non-CO2 trace greenhouse gas; therefore, I reluctantly will consider all greenhouse gases taken together as "equivalent CO2. However, this assumption implies that projections for "CO2" alone will be an underestimate of the total greenhouse gas buildup by roughly a factor of 2. Furthermore, this assumption forces us to ignore possible relations between CH4 and water vapor in the stratosphere, for example, which might affect polar stratospheric clouds, which are believed to enhance photochemical destruction of ozone by chlorine atoms. Projecting greenhouse gas concentrations. Once a plausible set of scenarios for how much CO2 will be injected into the atmosphere is obtained the interacting biogeochemical processes that control the global distribution and stocks of the carbon need to be determined. Such processes
  • 14. 13 | P a g e involve the uptake of CO2 by green plants (because CO2 is the basis of photosynthesis, more CO2 in the air means faster rates of photosynthesis), changes in the amount of forested area and vegetation type, and how CO2 fertilization or climate change affects natural ecosystems on land and in the oceans. The transition from ice age to interglacial climates provides a concrete example of how large natural climatic change affected natural ecosystems in North America. This transition represented some 5deg.C global warming, with as much as 10deg. to 20deg.C warming locally near ice sheets. The boreal species now in Canada were hugging the rim of the great Lauren tide glacier in the U.S. Northeast some 10,000 years ago, while now abundant hardwood species were restricted to small refuges largely in the South. The natural rate of forest movement that can be inferred is, to order of magnitude, some @1 km per year, in response to temperature changes averaging @1deg. to 2deg.C per thousand years. If climate were to change much more rapidly than this, then the forests would likely not be in equilibrium with the climate; that is, they could not keep up with the fast change and would go through a period of transient adjustment in which many hard-to-predict changes in species distribution, productivity, and CO2 absorptive capacity would likely occur. Furthermore, because the slow removal of CO2 from the atmosphere is largely accomplished through biological and chemical processes in the oceans and decades to centuries are needed for equilibration after a large perturbation, the rates at which climate change modifies mixing processes in the ocean (and thus the CO2 residence time) also needs to be taken into account. There is considerable uncertainty about how much newly injected CO2 will remain in the air during the next century, but typical estimates put this so-called "airborne fraction" at about 50%. Reducing CO2 emissions could initially provide a bonus by allowing the reduction of the airborne fraction, whereas increasing CO2 emissions could increase the airborne fraction and exacerbate the greenhouse effect. However, this bonus might last only a decade or so, which is the time it takes for the upper mixed layer of the oceans to mix with deep ocean water. Biological feedbacks can also influence the amount of CO2 in the air. For example, enhanced photosynthesis could reduce the buildup rate of CO2 relative to that projected with carbon cycle models that do not include such an effect. On the other hand, although there is about as much carbon stored in the forests as there is in the atmosphere, there is about twice as much carbon stored in the soils in the form of dead organic matter. This carbon is slowly decomposed by soil microbes back to CO2 and other gases.
  • 15. 14 | P a g e Because the rate of this decomposition depends on temperature, global warming from increased greenhouse gases could cause enhanced rates of microbial decomposition of neuromas (dead organic matter), thereby causing a positive feedback that would enhance CO2 buildup. Furthermore, considerable methane is trapped below frozen sediments as clathrates in tundra and off continental shelves. These clathrates could release vast quantities of methane into the atmosphere if substantial Arctic warming were to take place. Already the ice core data have shown that not only has CO2 tracked temperature closely for the past 150,000 years, but so has methane, and methane is a significant trace greenhouse gas which is some 20 to 30 times more effective per molecule at absorbing infrared radiation than CO2.Despite these uncertainties, many workers have projected that CO2 concentrations will reach 600 ppm sometime between 2030 and 2080 and that some of the other trace greenhouse gases will continue to rise at even faster rates. Estimating global climatic response. Once we have projected how much CO2 (and other trace greenhouse gases) may be in the air during the next century or so, we have to estimate its climatic effect. Complications arise because of interactive processes; that is, feedback mechanisms. For example, if added CO2 were to cause a temperature increase on earth, the warming would likely decrease the regions of Earth covered by snow and ice and decrease the global albedo. The initial warming would thus create a darker planet that would absorb more energy, thereby creating a larger final warming. This scenario is only one of a number of possible feedback mechanisms. Clouds can change in amount, height, or brightness, for example, substantially altering the climatic response to CO2.And because feedback processes interact in the climatic system, estimating global temperature increases accurately is difficult; projections of the global equilibrium temperature response to an increase of CO2 from 300 to 600 ppm have ranged from @1.5deg. to 5.5deg.C. (In the next section the much larger uncertainties surrounding regional responses will be discussed.) Despite these uncertainties, there is virtually no debate that continued increases of CO2 will cause global warming. We cannot directly verify our quantitative predictions of greenhouse warming on the basis of purely historical events; therefore, we must base our estimates on natural analogs of large climatic changes and numerical climatic models because the complexity of the real world cannot be reproduced in laboratory models. In the mathematical models, the known basic physical laws are
  • 16. 15 | P a g e applied to the atmosphere, oceans, and ice sheets, and the equations that represent these laws are solved with the best computers available. Then, we simply change in the computer program the effective amount of greenhouse gases, repeat our calculation, and compare it to the "control" calculation for the present Earth. Many such global climatic models (GCMs) have been built during the past few decades, and the results are in rough agreement that if CO2 were to double from 300 to 600 ppm, then Earth's surface temperature would eventually warm up somewhere between 1deg. and 5deg.C; the most recent GCM estimates are from 3.5deg. to 5. 0deg.C. For comparison, the global average surface temperature (land and ocean) during the Ice Age extreme 18,000 years ago was only about 5deg.C colder than that today. Thus, a global temperature changes of 1deg. to 2deg.C can have considerable effects. A sustained global increase of more than 2deg.C above present would be unprecedented in the era of human civilization. The largest uncertainty in estimating the sensitivity of Earth's surface temperature to a given increase in radiative forcing arises from the problem of parameterization. Because the equations that are believed to represent the flows of mass, momentum, and energy in the atmosphere, oceans, ice fields, and biosphere cannot be solved analytically with any known techniques, approximation techniques are used in which the equations are discretized with a finite grid that divides the region of interest into cells that are several hundred kilometers or more on a side. Clearly, critically important variables, such as clouds, which control the radiation budget of Earth, do not occur on scales as large as the grid of a general circulation model. Therefore, we seek to find a parametric representation or parameterization that relates implicitly the effects of important processes that operate at sub grid-scale but still have effects at the resolution of a typical general circulation model. For example, a parameter or proportionality coefficient might be used that describes the average cloudiness in grid cell in terms of the mean relative humidity in that cell and some other measures of atmospheric stability. Then, the important task becomes validating these semi empirical parameterizations because at some scale, all models, no matter how high resolution, must treat sub grid-scale processes through parameterization. Projecting regional climatic response. In order to make useful estimates of the effects of climatic changes, we need to determine the regional distribution of climatic change. Will it be drier in Iowa in 2010, too hot in India, wetter in Africa, or more humid in New York; will California be prone
  • 17. 16 | P a g e to more forest fires or will Venice flood? Unfortunately, reliable prediction of the time sequence of local and regional responses of variables such as temperature and rainfall requires climatic models of greater complexity and expense than are currently available. Even though the models have been used to estimate the responses of these variables, the regional predictions from state-of- the-art models are not yet reliable. Although there is considerable experience in examining regional changes, considerable uncertainty remains over the probability that these predicted regional features will occur. The principal reasons for the uncertainty are twofold: the crude treatment in climatic models of biological and hydrological processes and the usual neglect of the effects of the deep oceans. The deep oceans would respond slowly--on time scales of many decades to centuries--to climatic warming at the surface, and also act differentially (that is, non-uniformly in space and through time). Therefore, the oceans, like the forests, would be out of equilibrium with the atmosphere if greenhouse gases increase as rapidly as typically is projected and if climatic warming were to occur as fast as 2deg. to 6deg.C during the next century. This typical projection, recall, is 10 to 60 times as fast as the natural average rate of temperature change that occurred from the end of the last Ice Age to the present warm period (that is, 2deg. to 6deg.C warming in a century from human activities compared to an average natural warming of 1deg. to 2deg.C per millennium from the waning of the Ice Age to the establishment of the present interglacial epoch). If the oceans are out of equilibrium with the atmosphere, then specific regional forecasts will not have much credibility until fully coupled atmosphere-ocean models are tested and applied. The development of such models is a formidable scientific and computational task and is still not very advanced. Consequences of Enhanced Greenhouse Effect i) Global Warming Increase of greenhouse gases concentration causes a reduction in outgoing infrared radiation, thus the Earth's climate must change somehow to restore the balance between incoming and outgoing radiation. This “climatic change” will include a “global warming” of the Earth's surface and the lower atmosphere as warming up is the simplest way for the climate to get rid of the extra energy. However, a small rise in temperature will induce many other changes, for example, cloud cover and wind patterns. Some of these changes may act to enhance the warming (positive feedbacks),
  • 18. 17 | P a g e others to counteract it (negative feedbacks). Using complex climate models, the "Intergovernmental Panel on Climate Change" in their third assessment report has forecast that global mean surface temperature will rise by 1.4℃ to 5.8℃ by the end of 2100. This projection takes into account the effects of aerosols which tend to cool the climate as well as the delaying effects of the oceans which have a large thermal capacity. However, there are many uncertainties associated with this projection such as future emission rates of greenhouse gases, climate feedbacks, and the size of the ocean delay etc. ii) Sea Level Rise If global warming takes place, sea level will rise due to two different processes. Firstly, warmer temperature cause sea level to rise due to the thermal expansion of seawater. Secondly, water from melting glaciers and the ice sheets of Greenland and the Antarctica would also add water to the ocean. It is predicted that the Earth's average sea level will rise by 0.09 to 0.88 m between 1990 and 2100. Potential Impact on the Environment / human life a) Economic Impact Over half of the human population lives within 100 kilometers of the sea. Most of this population lives in urban areas that serve as seaports. Rising temperatures would raise sea levels as well, reducing supplies of fresh water as flooding occurs along coastlines worldwide and salt water reaches inland. A measurable rise in sea level will have a severe economic impact on low lying coastal areas and islands, for examples, increasing the beach erosion rates along coastlines, rising sea level displacing fresh groundwater for a substantial distance inland. b) Agricultural Impact An increase in atmospheric CO2 enhances the agricultural productivity of land resources because of its direct beneficial effects on crop growth. Over the long run, however, increasing concentrations of greenhouse gases warm Earth’s climate and thereby modify the potential extent and productivity of agriculture. The direct effects of CO2 on plant growth and the indirect effects of climate change also will modify the potential extent and productivity of Earth’s ecosystems. Human responses to changing agricultural opportunities will interact with ecosystems, as well.
  • 19. 18 | P a g e Experiments have shown that with higher concentrations of CO2,plants can grow bigger and faster. However, the effect of global warming may affect the atmospheric general circulation and thus altering the global precipitation pattern as well as changing the soil moisture contents over various continents. Millions of people also would be affected, especially poor people who live in precarious locations or depend on the land for a subsistence living. Food production, processing, and distribution can be affected, as well as national security. c) Effects on Aquatic systems The loss of coastal wetlands could certainly reduce fish populations, especially shellfish. Increased salinity in estuaries could reduce the abundance of freshwater species but could increase the presence of marine species. However, the full impact on marine species is not known. d) Effects on Hydrological Cycle Global precipitation is likely to increase. However, it is not known how regional rainfall patterns will change. Some regions may have more rainfall, while others may have less. Furthermore, higher temperatures would probably increase evaporation. These changes would probably create new stresses for many water management systems. e) More mobile species Many of the world’s endangered species would become extinct as rising temperatures changed their habitat, and affected the timing of seasonal events. Species are straying from their native habitats at an unprecedented rate: 11 miles (17.6 km) toward the poles per decade. Areas where temperature is increasing the most show the most straying by native organisms. The Cetti's warbler, for example, has moved north over the last two decades by more than 90 miles (150 km). Plate 3: Credit: Kenneth Lohmann, University of North Carolina at Chapel Hill Plate 4: A Cetti’s warbler Source: Stephanie Pappas, Live Science Contributor, September 07, 2012
  • 20. 19 | P a g e f) Hurting polar bears Polar bear cubs are struggling to swim increasingly long distances in search of stable sea ice, according to a 2011 study. The rapid loss of sea ice in the Arctic is forcing bears to sometimes swim up to more than 12 days at a time, the research found. Cubs of adult bears that had to swim more than 30 miles (48 kilometers) had a 45 percent mortality rate, compared with 18 percent for cubs that had to swim shorter distances. Plate 5: Credit: USFWS Source: Stephanie Pappas, Live Science Contributor, September 07, 2012 g) Changing genetics Even fruit flies are feeling the heat. According to a 2006 study, fruit fly genetic patterns normally seen at hot latitudes are showing up more frequently at higher latitudes. According to the research, the gene patterns of Drosophila subobscura, a common fruit fly, are changing so that populations look about one degree closer in latitude to the equator than they actually are. In other words, genotypes are shifting so that a fly in the Northern Hemisphere has a genome that looks more like a fly 75 to 100 miles (120 to 161 kilometers) south. Plate 6: Credit: Giovanni Cancemi | Shutterstock Plate 7: Fruit flies Source: Stephanie Pappas, Live Science Contributor, September 07, 2012
  • 21. 20 | P a g e h) Changed high seasonat national parks When's the busiest time to see the Grand Canyon? The answer has changed over the decades as spring has started earlier. Peak national park attendance has shifted forward more than four days, on average, since 1979. Today, the highest number of visitors now swarm the Grand Canyon on June 24, compared with July 4 in 1979. Plate 8: Credit: Andrea El-Wailly Source: Stephanie Pappas, Live Science Contributor, September 07, 2012 i) Altered Thoreau's stomping grounds The writer Henry David Thoreau once lovingly documented nature in and around Concord, Mass. Reading those diaries today has shown researchers just how much spring has changed in the last century or so. Compared to the late 1800s, the first flowering dates for 43 of the most common plant species in the area have moved forward an average of 10 days. Other plants have simply disappeared, including 15 species of orchids. Plate 9: Credit: © Houghton Library, President and Fellows of Harvard College Source: Stephanie Pappas, Live Science Contributor, September 07, 2012
  • 22. 21 | P a g e j) High-country changes Decreased winter snowfall on mountaintops is allowing elk in northern Arizona to forage at higher elevations all winter, contributing to a decline in seasonal plants. Elk have ravaged trees such as maples and aspens, which in turn has led to a decline in songbirds that rely on these trees for habitat. Plate 10: Credit: Don Becker, USGS Source: Stephanie Pappas, Live Science Contributor, September 07, 2012 k) Altering breeding seasons As temperatures shift, penguins are shifting their breeding seasons, too. A March 2012 study found that Gentoo penguins are adapting more quickly to warmer weather, because they aren't as dependent on sea ice for breeding as other species. It's not just penguins that seem to be responding to climate change. Animal shelters in the U.S. have reported increasing numbers of stray cats and kittens attributed to a longer breeding season for the felines. Plate 11: Credit: Wally Walker, National Science Foundation Source: Stephanie Pappas, Live Science Contributor, September 07, 2012
  • 23. 22 | P a g e l) Moving the military northward As the Arctic ice opens up, the world turns its attention to the resources below. According to the U.S. Geological Survey, 30 percent of the world's undiscovered natural gas and 13 percent of its undiscovered oil are under this region. As a result, military action in the Arctic is heating up, with the United States, Russia, Denmark, Finland, Norway, Iceland, Sweden and Canada holding talks about regional security and border issues. Several nations, including the U.S., are also drilling troops in the far north, preparing for increased border patrol and disaster response efforts in a busier Arctic. Plate 12: Credit: Romain Schläppy, Paris, distributed by the EGU under a Creative Commons License. Source: Stephanie Pappas, Live Science Contributor, September 07, 2012 m) Effects on Diseases Certain vector-borne diseases carried by animals or insects, such as malaria and Lyme disease, would become more widespread as warmer conditions expanded their range n) Effect on Rocks: Carbon dioxide is mostly bounded chemically in rocks made from compounds that chemists call carbonates. High temperature as result of the Greenhouse effect triggers a chemical reaction which drives carbon dioxide from rock into the atmosphere, this in turn bakes the rock, decays any organic matter within the rock and leaves it vulnerable to weathering
  • 24. 23 | P a g e LOOKING FORWARD (MITIGATION OF GREEN HOUSE EFFECT) This involves intervention or policies to reduce the emissions or enhance the sink of greenhouse gases. the following policy options suggested below are a combination mitigation models gotten from various countries like Australia, Philippines, Japan and organizations like the United Nations Framework Convention on Climate Change(UNFCCC) through its current International legal mechanism for countries to reduce their emissions: 1. The industrial sector: The first policy area should focus on the industrial sector which is the main energy and carbon dioxide generator. The reduction of industrial carbon dioxide can be achieved through these options:  Structural changes affecting material utilization and recycling.  Efficiency improvements  Industrial process change  Fuel-mix changes  Implementation of energy efficiency measures  Promotion of energy conservation  Use of alternative non-CO2 emitting industrial processes 2. The transportation sector: The second policy should focus on the transportation sector. Reduction in carbon monoxide emission in the transportation sector can be achieved through the following option  Energy efficiency  Good road network
  • 25. 24 | P a g e  Behavioral modification.  Use/promotion of non-motorized transport modes which promotes healthy living habit e.g. cycling and walking  Development and use of efficient mass transport systems which help to reduce the number of vehicles on the road and also reduce carbon monoxide emission too  Emission control schemes focusing on improved fuel and vehicle efficiency  Traffic volume reduction measure such as the Unified Vehicular Volume Reduction Program (UVVRP)  Fuel and vehicle tax policy 3. Renewable source of Energy: The third policy is on renewable. Renewables sources of energy is extremely important in the mitigation of greenhouse gases. The following policy options:  Implementation of policies stimulating increased utilization of renewable.  Invitation of international organization to support this policy in developing countries.  Eliminating fossil fuels, which currently provide 85% of all energy supplies  Research and technology cost trends of renewables (solar, wind, biomass, hydro)  Supply-side efficiency improvements; power plants efficiency improvement; transmissions loss reduction; replacement of coal plants with natural gas combined cycle plants  Demand-side efficiency improvements; energy conservation, use of energy efficient technologies
  • 26. 25 | P a g e  Energy-efficient designs for new buildings 4. Forestry and agriculture: The fourth policy is on forestry and agriculture, since they function as sinks for carbon dioxide emission. The necessary policy options to be taken are:  Implementation of policies to reverse deforestation  Implementation of policies to cover sustainable forest management of existing forest resources  Implementation of soil conservation.  Use of tubular polyethylene bio-digesters and urea-molasses mineral block as nutrient supplement in animal production  Use of sulfate fertilizers to reduce methane emissions  Use of rice straw, water management and low-emitting cultivars  Upgrading of food storage and distribution systems  Promotion and implementation of judicious land –use planning 5. Information: Another policy area is on information. There is a desperate need for simplified guides, easily accessible information to the public on Greenhouse effect. The necessary policy option are:  Involvement of environment non-governmental organization to give mass campaign  Implementation of Agenda 21 (the Rio Declaration on environment and development, and the statement of principles for sustainable Management of
  • 27. 26 | P a g e forests adopted by more than 178 governmentsRio de Janerio, Brazil, 3 to 14 June 1992) in collaboration with relevant organization. Agenda 21 is a comprehensive plan of action to be taken globally, nationally and locally by organizations of the united Nations system, Governments and major groups in every area in which human impact on the environment.
  • 28. 27 | P a g e Conclusion Despite the series of evidences above some persons still believe and can prove that the Greenhouse effect is the least our problems. They believe that in our efforts to conserve the beautiful planet that is our home, we should not fixate on CO2. We should instead focus on issues like damage to local landscapes and waterways by strip mining, inadequate cleanup, hazards to underground miners, the excessive release of real pollutants such as mercury, other heavy metals, organic carcinogens, etc. No matter which side of the debate we stand, we should realize that reducing greenhouse gases and moving to a low carbon economy will be associated with substantial health benefits. These health benefits have a substantial economic impact everywhere, including developing countries. It only takes a little change in lifestyle and behavior to make some big changes in greenhouse gas reductions. For other types of actions, the changes are more significant. When that action is multiplied by the approximately 160 million people in Nigeria or the 6 billion people worldwide, the savings are significant. “Individuals Can Make a Difference" identifies actions that many households and individuals can take that reduce greenhouse gas emissions in addition to other benefits, including saving your money and improving our health. The actions range from changes in the house, in the yard, in the car, and in the store. Everyone's contribution counts so why don't you do your share?
  • 29. 28 | P a g e REFERENCES Brian S. Fisher, Stephen Brow, The economic impacts of uniform emission abatement, ‘Countdown to Kyoto’: The Consequences of the Mandatory Global Carbon Dioxide Emissions Reductions, Australian APEC Study Centre, Canberra, 19–21 August 1997; Cain Polidano, The impact of climate change policies on employment in the coalmining industry, SAP 2.64/WP.115; Church, J. A. and N.J. White (2006), A 20th century acceleration in global sea level rise, Geophysical Research Letters, 33, L01602, doi:10.1029/2005GL024826.page 2 Clive Hamilton, John Quiggin, Economic Analysis of Greenhouse Policy, Discussion Paper Number 15, December 1997, ISSN 1322-5421; Department of Energy. The Philippine Energy Plan 2000-2009. The Philippines’ Initial National Communication, December 1999, 91 pages. Encarta Encyclopedia: Major Green House Gases and Their Percentages Encarta Encyclopedia: A simplified diagram illustrating the global long term radiative balance of the atmosphere. Environmental Key Performance Indicators, Reporting Guidelines for UK Business, Department for Environment, Food and Rural Affairs, www.defra.gov.uk, 2006; Hom Pant, Global Trade and Environment Model (GTEM): A computable general equilibrium model of the global economy and environment, Australian Bureau of Agricultural and Resource Economics Canberra, 2002; IPCC, 2007: Climate Change 2007: The Physical Science Basis. Contribution of Working Group I to the Fourth Assessment Report of the Intergovernmental Panel on Climate Change [Solomon,
  • 30. 29 | P a g e S., D. Qin, M. Manning, Z. Chen, M. Marquis, K.B. Averyt, M.Tignor and H.L. Miller (eds.)]. Cambridge University Press, Cambridge, United Kingdom and New York, NY, USA. John M. Reilly, Sergey Paltsev, An Analysis of the European Emission Trading Scheme, MIT Joint Program on the Science and Policy of Global Change, Report No. 127, October 2005; Joseph Fiksel, Key Performance Indicators, World Business Council for Sustainable Development, March 2002; Lisa Segnestam, Environmental Performance Indicators, A Second Edition Note, Environmental Economics Series, Paper No. 71, October 1999; Niki Leahy, Integrating Environmental KPIs with Financial KPIs, CSR Report 2006; R.C. Hyman, J.M. Reilly, M.H. Babiker, A. De Masin and H.D. Jacob, Modeling Non-CO2 Greenhouse Gas Abatement, MIT Joint Program on the Science and Policy of Global Change, Report No. 94, December 2002; Schlesinger, M.E., Andronova, N., Ghanem, A., Malyshev, S., Reichler, T., Rozanov, E., Wang, W., and Yang, F. 1997. Geographical Scenarios of Greenhouse-Gas and Anthropogenic-Sulfate- Aerosol Induced Climate Changes. University of Illinois at Urbana-Champaign, Department of Atmospheric Science, Climate Research Group, Urbana-Champaign, IL. Schlesinger, M. E.,S. Malyshev, E. V. Rozanov, F. Yang, N. G. Andronova, B. de Vries, A. Grubler, K. Jiang, T. Masui, T. Morita, J. Penner, W. Pepper, A. Sankovski, and Y. Zhang. 2000. “Geographical Distributions of Temperature Change for Scenarios of Greenhouse Gas and Sulfur Dioxide Emissions.” Technological Forecasting and Social Change 65:167-193. Schlesinger, M.E., and Zhao, Z.-C. 1989. “Seasonal climate changes induced by doubled CO2 as simulated by the OSU atmospheric GCM/mixed-layer ocean model.” Journal of Climate 2:459- 495.
  • 31. 30 | P a g e Sellers, P.J., L. Bounoua, G.J. Collatz, D.A. Randall, D.A. Dazlich, S.O. Los, J.A. Berry, I. Fung, C.J. Tucker, C.B. Field, and T.G. Jensen. 1996. “Comparison of Radiative and Physiological Effects of Doubled Atmospheric CO2 on Climate.” Science 271:1402- 1406. Singh, B., and M. El Maayar. 1998. “Potential impacts of greenhouse gas climate change scenarios on sugar cane yields in Trinidad.” Tropical Agriculture 75( ):348-353. Sonja Peterson, CGE Models and Their Application for Climate Policy Analysis, Kiel Institute for World Economics, Germany, Octombrie 2003; Stephanie Pappas, Live Science Contributor, September 07, 2012, Credit: Kenneth Lohmann, University of North Carolina at Chapel Hill Stephanie Pappas, Live Science Contributor, September 07, 2012, Credit: USFWS Stephanie Pappas, Live Science Contributor, September 07, 2012, Credit: Giovanni Cancemi | Shutterstock Stephanie Pappas, Live Science Contributor, September 07, 2012, Credit: Andrea El-Wailly Stephanie Pappas, Live Science Contributor, September 07, 2012, Credit: © Houghton Library, President and Fellows of Harvard College Stephanie Pappas, Live Science Contributor, September 07, 2012, Credit: Don Becker, USGS Stephanie Pappas, Live Science Contributor, September 07, 2012, Credit: Wally Walker, National Science Foundation Stephanie Pappas, Live Science Contributor, September 07, 2012, Credit: Romain Schläppy, Paris, distributed by the EGU under a Creative Commons License. Yohe, G., J.E. Neumann, and P. Marshall. 1999. “The economic damage induced by sea level rise in the United States,” Chapter 7 in The Impact of Climate Change on the United States Economy, R. Mendelsohn and J. Neumann, eds., Cambridge University Press, Cambridge, England, pp. 178- 208.