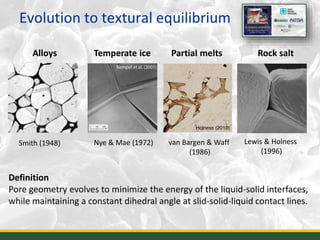
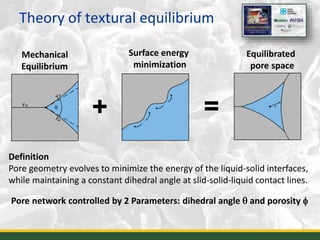
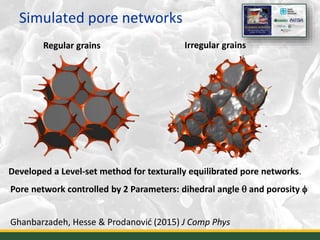
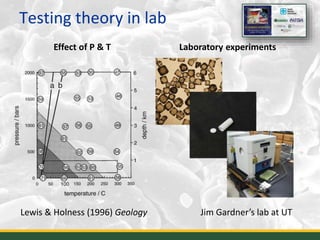
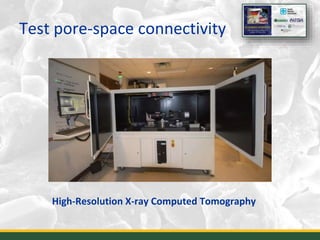
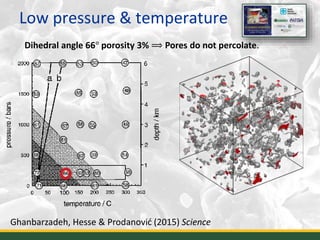
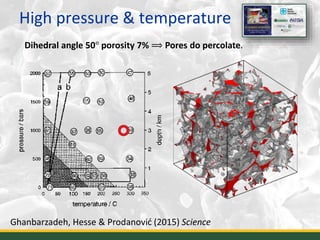
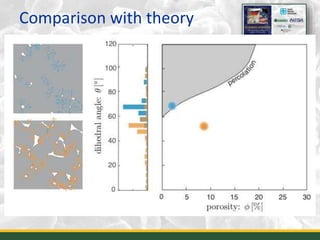
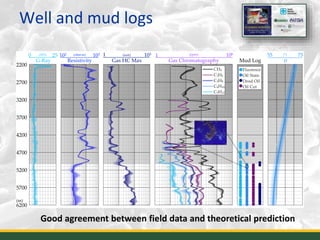
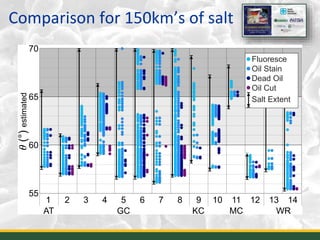
Sandia National Laboratories is a federally funded research facility operated by Sandia Corporation for the Department of Energy. The presentation discusses research on fluid flow through rock salt. It summarizes the theory of how pore networks evolve in ductile rocks under pressure and temperature. Laboratory experiments on rock salt samples show that pore connectivity and fluid percolation depend on porosity and dihedral angle as predicted by the theory. Comparison to field data from hydrocarbon wells in salt formations shows generally good agreement between observations and the theoretical model.
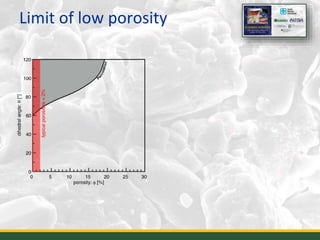
![Percolation threshold
Ghanbarzadeh, Hesse & Prodanović (2016) in review for Nat Geosci
q=10°q=7𝟎°q=9𝟎°
f = 2% f = 5% f = 10%
0 155 2010 3025
porosity: f [%]
120
80
60
20
40
100
0
dihedralangle:q[°]
Percolation threshold (real grains
)](https://image.slidesharecdn.com/22hessecapillarycontrols-160923161246/85/22-hesse-capillary-controls-7-320.jpg)
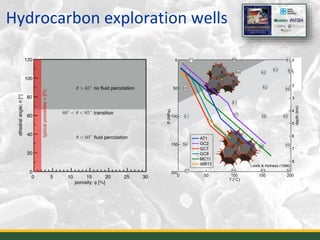
![Percolation threshold
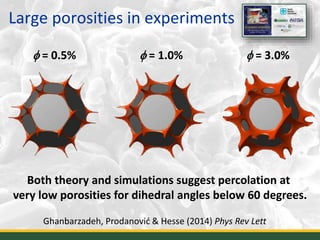
Ghanbarzadeh, Prodanović & Hesse (2014) Phys Rev Lett
Ghanbarzadeh, Hesse & Prodanović (2016) in review for Nat Geosci
0 155 2010 3025
porosity: f [%]
120
80
60
20
40
100
0
dihedralangle:q[°]
Percolation threshold (real grains
)
Ideal grains Real grains
Percol
ation
th
reshold(idealgrains)](https://image.slidesharecdn.com/22hessecapillarycontrols-160923161246/85/22-hesse-capillary-controls-8-320.jpg)
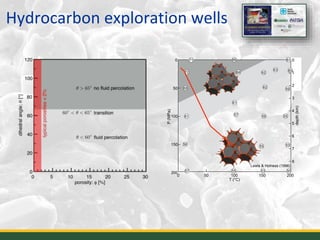
![Limit of low porosity
15
57
50 150 200
50
100
150
200
P[MPa]
T [°C]
0
1000
55 53 50-2
0
0 200
5355
56
56 55
59
57
61
61
61
62
6266
6063
6671
68
72
Depth[km]
7
4
3
2
1
0
8
6
5
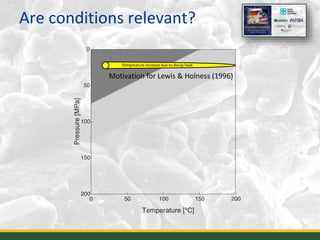
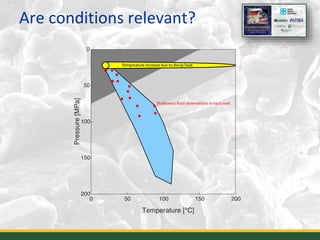
Lewis & Holness (1996)](https://image.slidesharecdn.com/22hessecapillarycontrols-160923161246/85/22-hesse-capillary-controls-15-320.jpg)


![Getting Started with Apache Spark: Big Data Made Simple [Free Meetup]](https://cdn.slidesharecdn.com/ss_thumbnails/apachesparkgettingstarted-260203175547-8361bcc3-thumbnail.jpg?width=640&height=640&fit=bounds)


