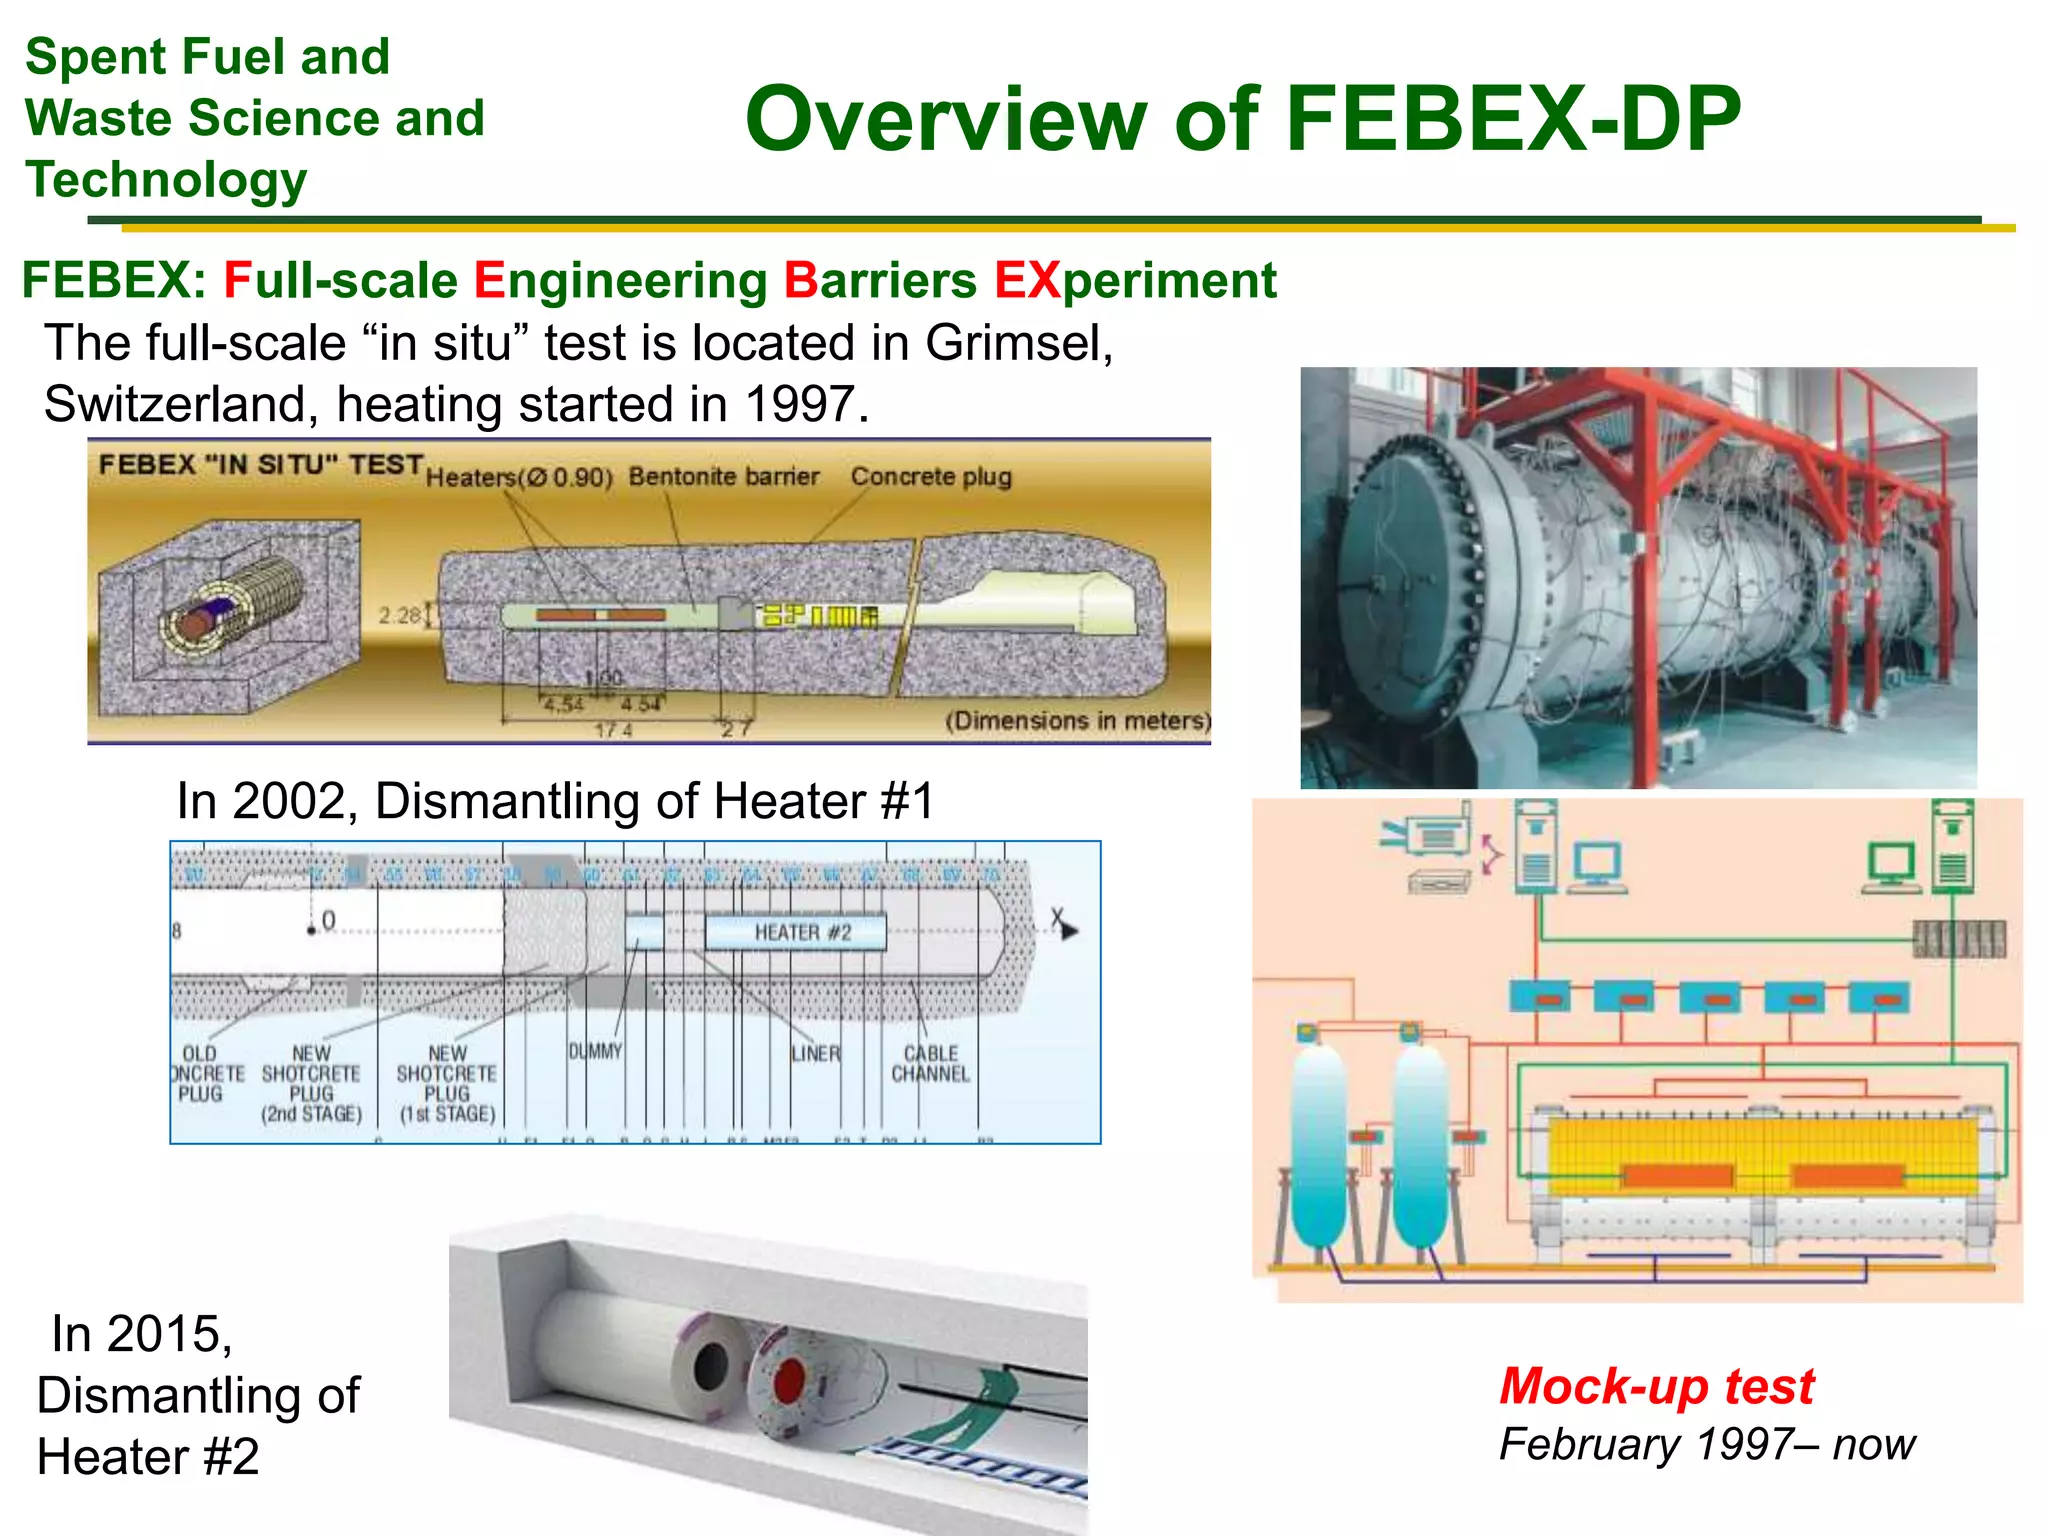
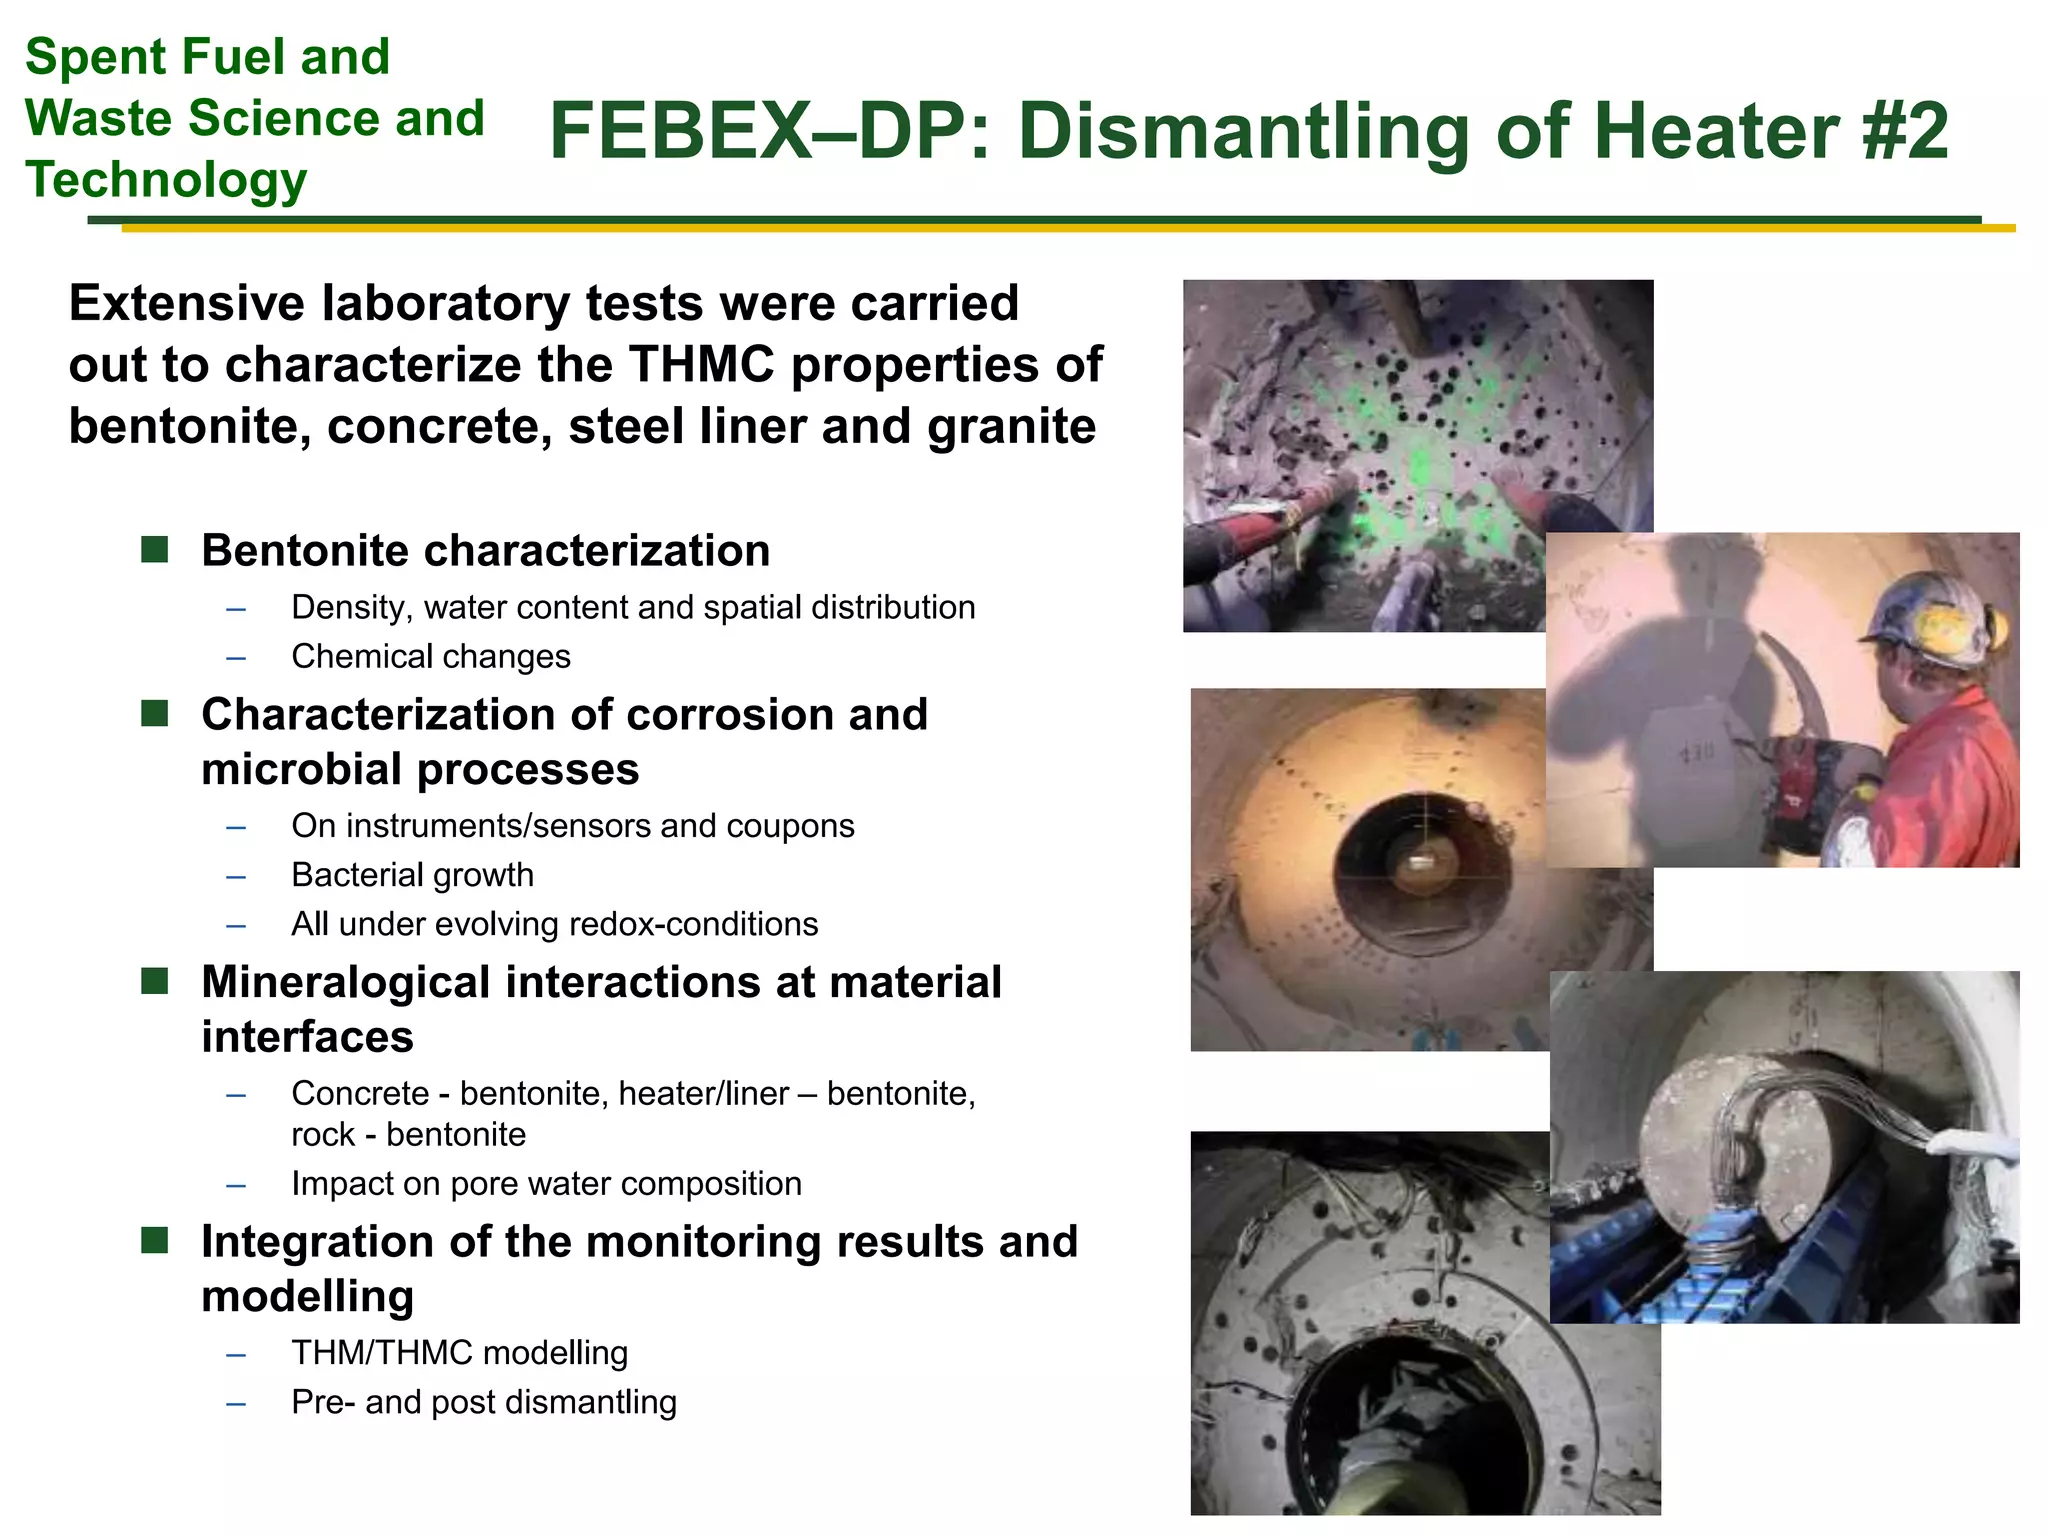
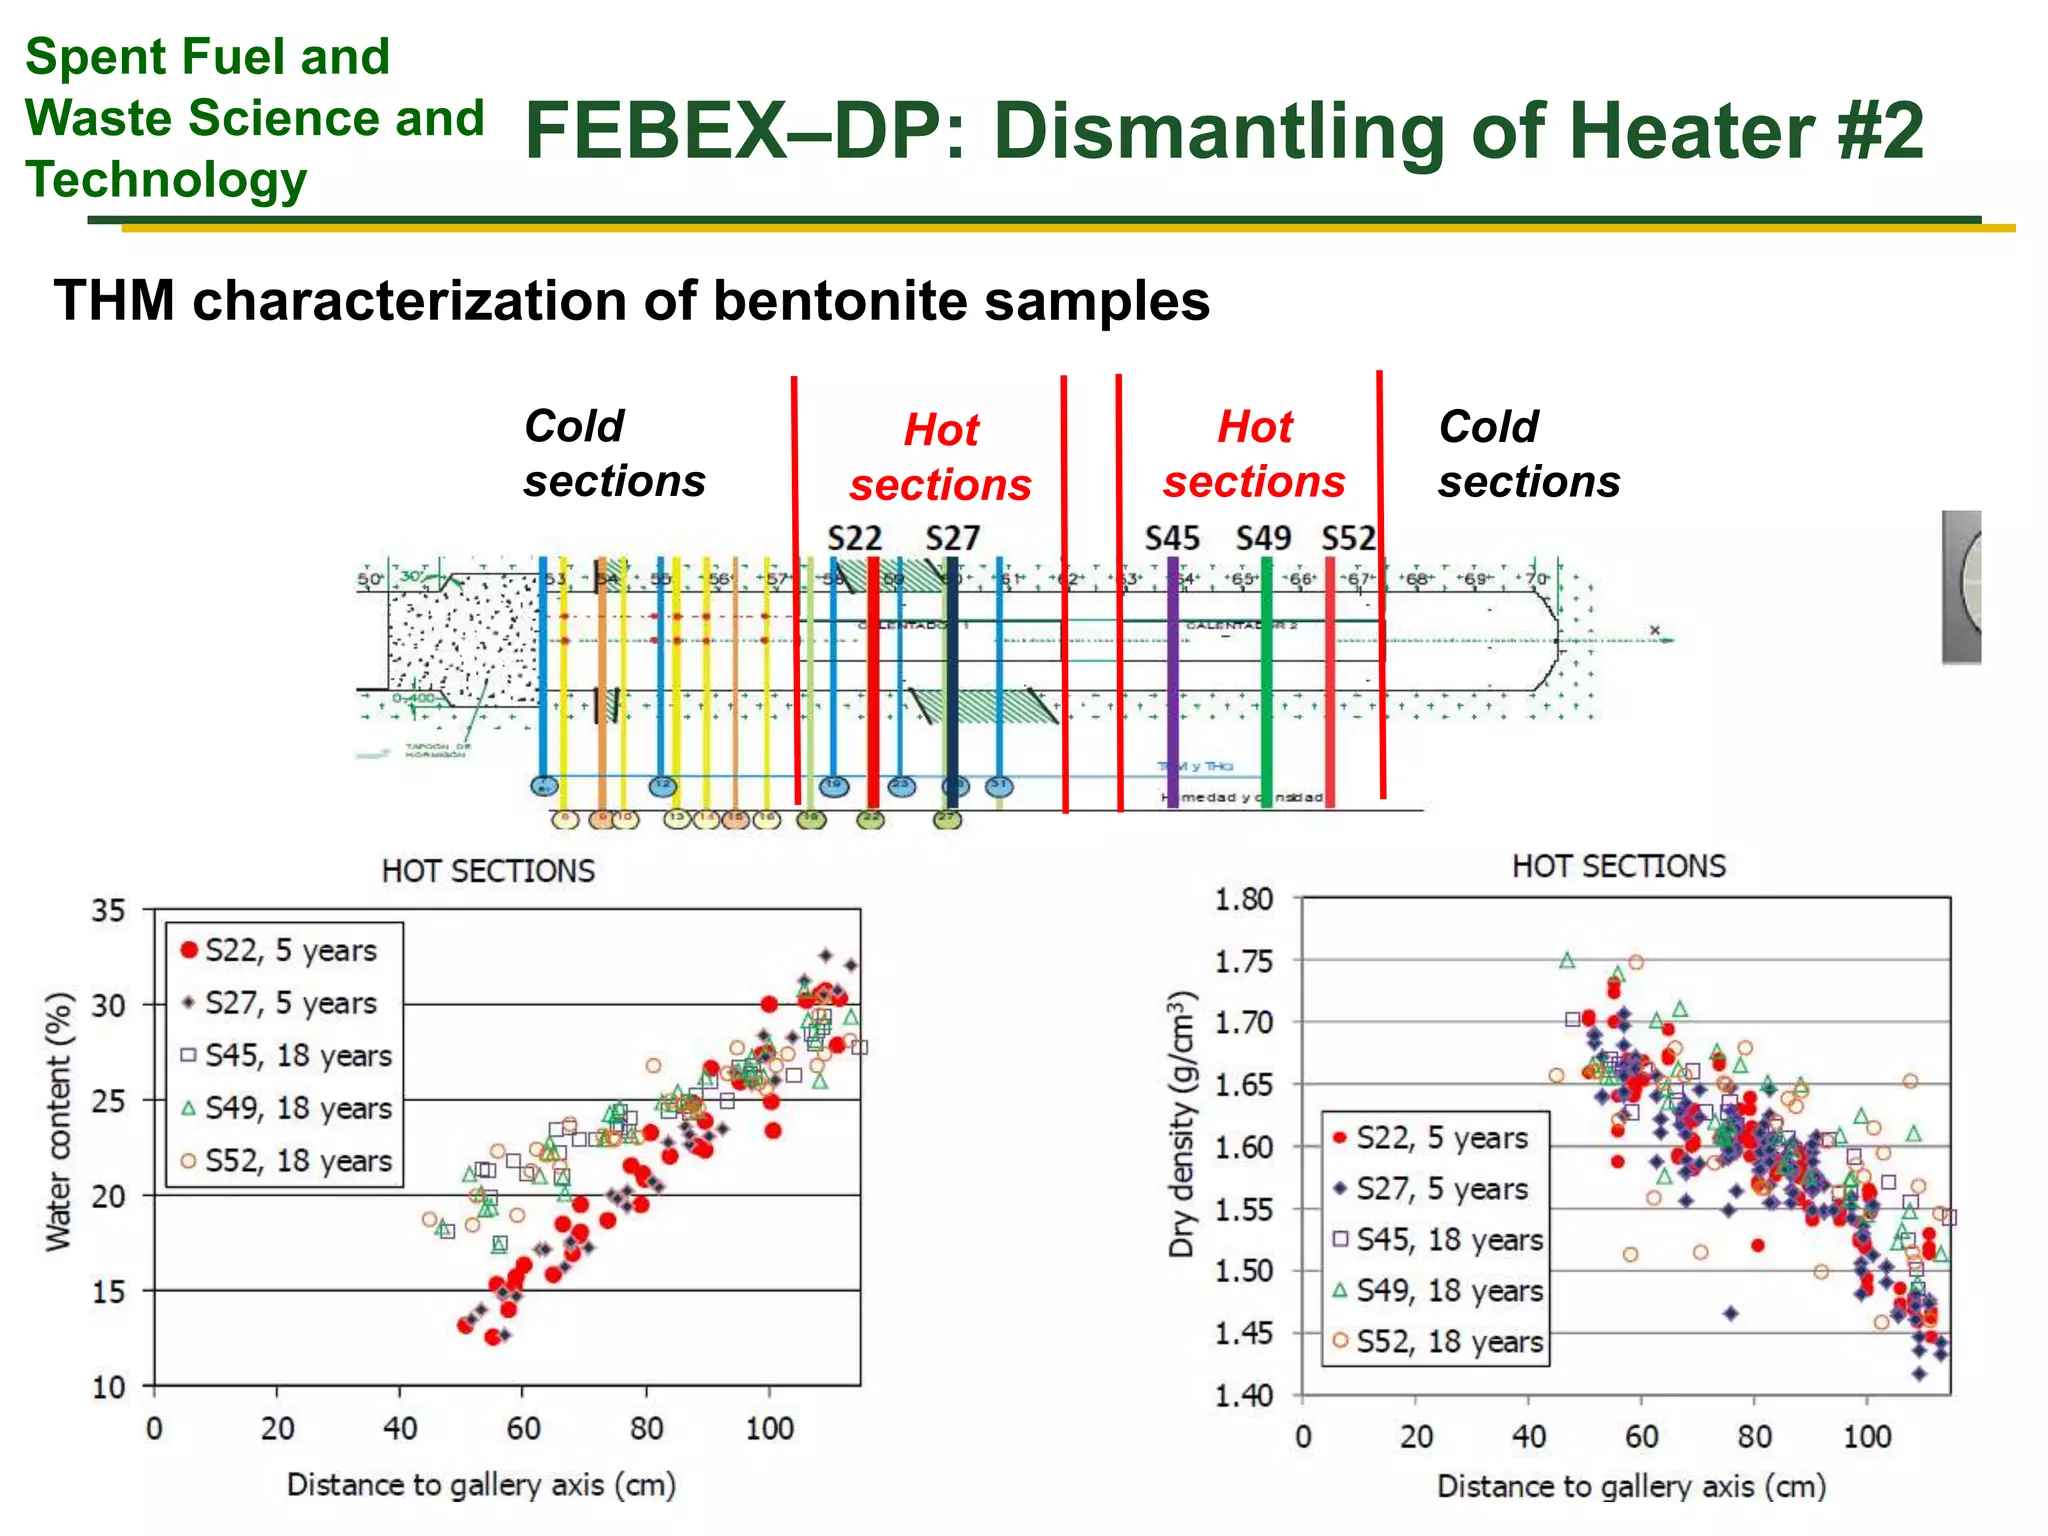
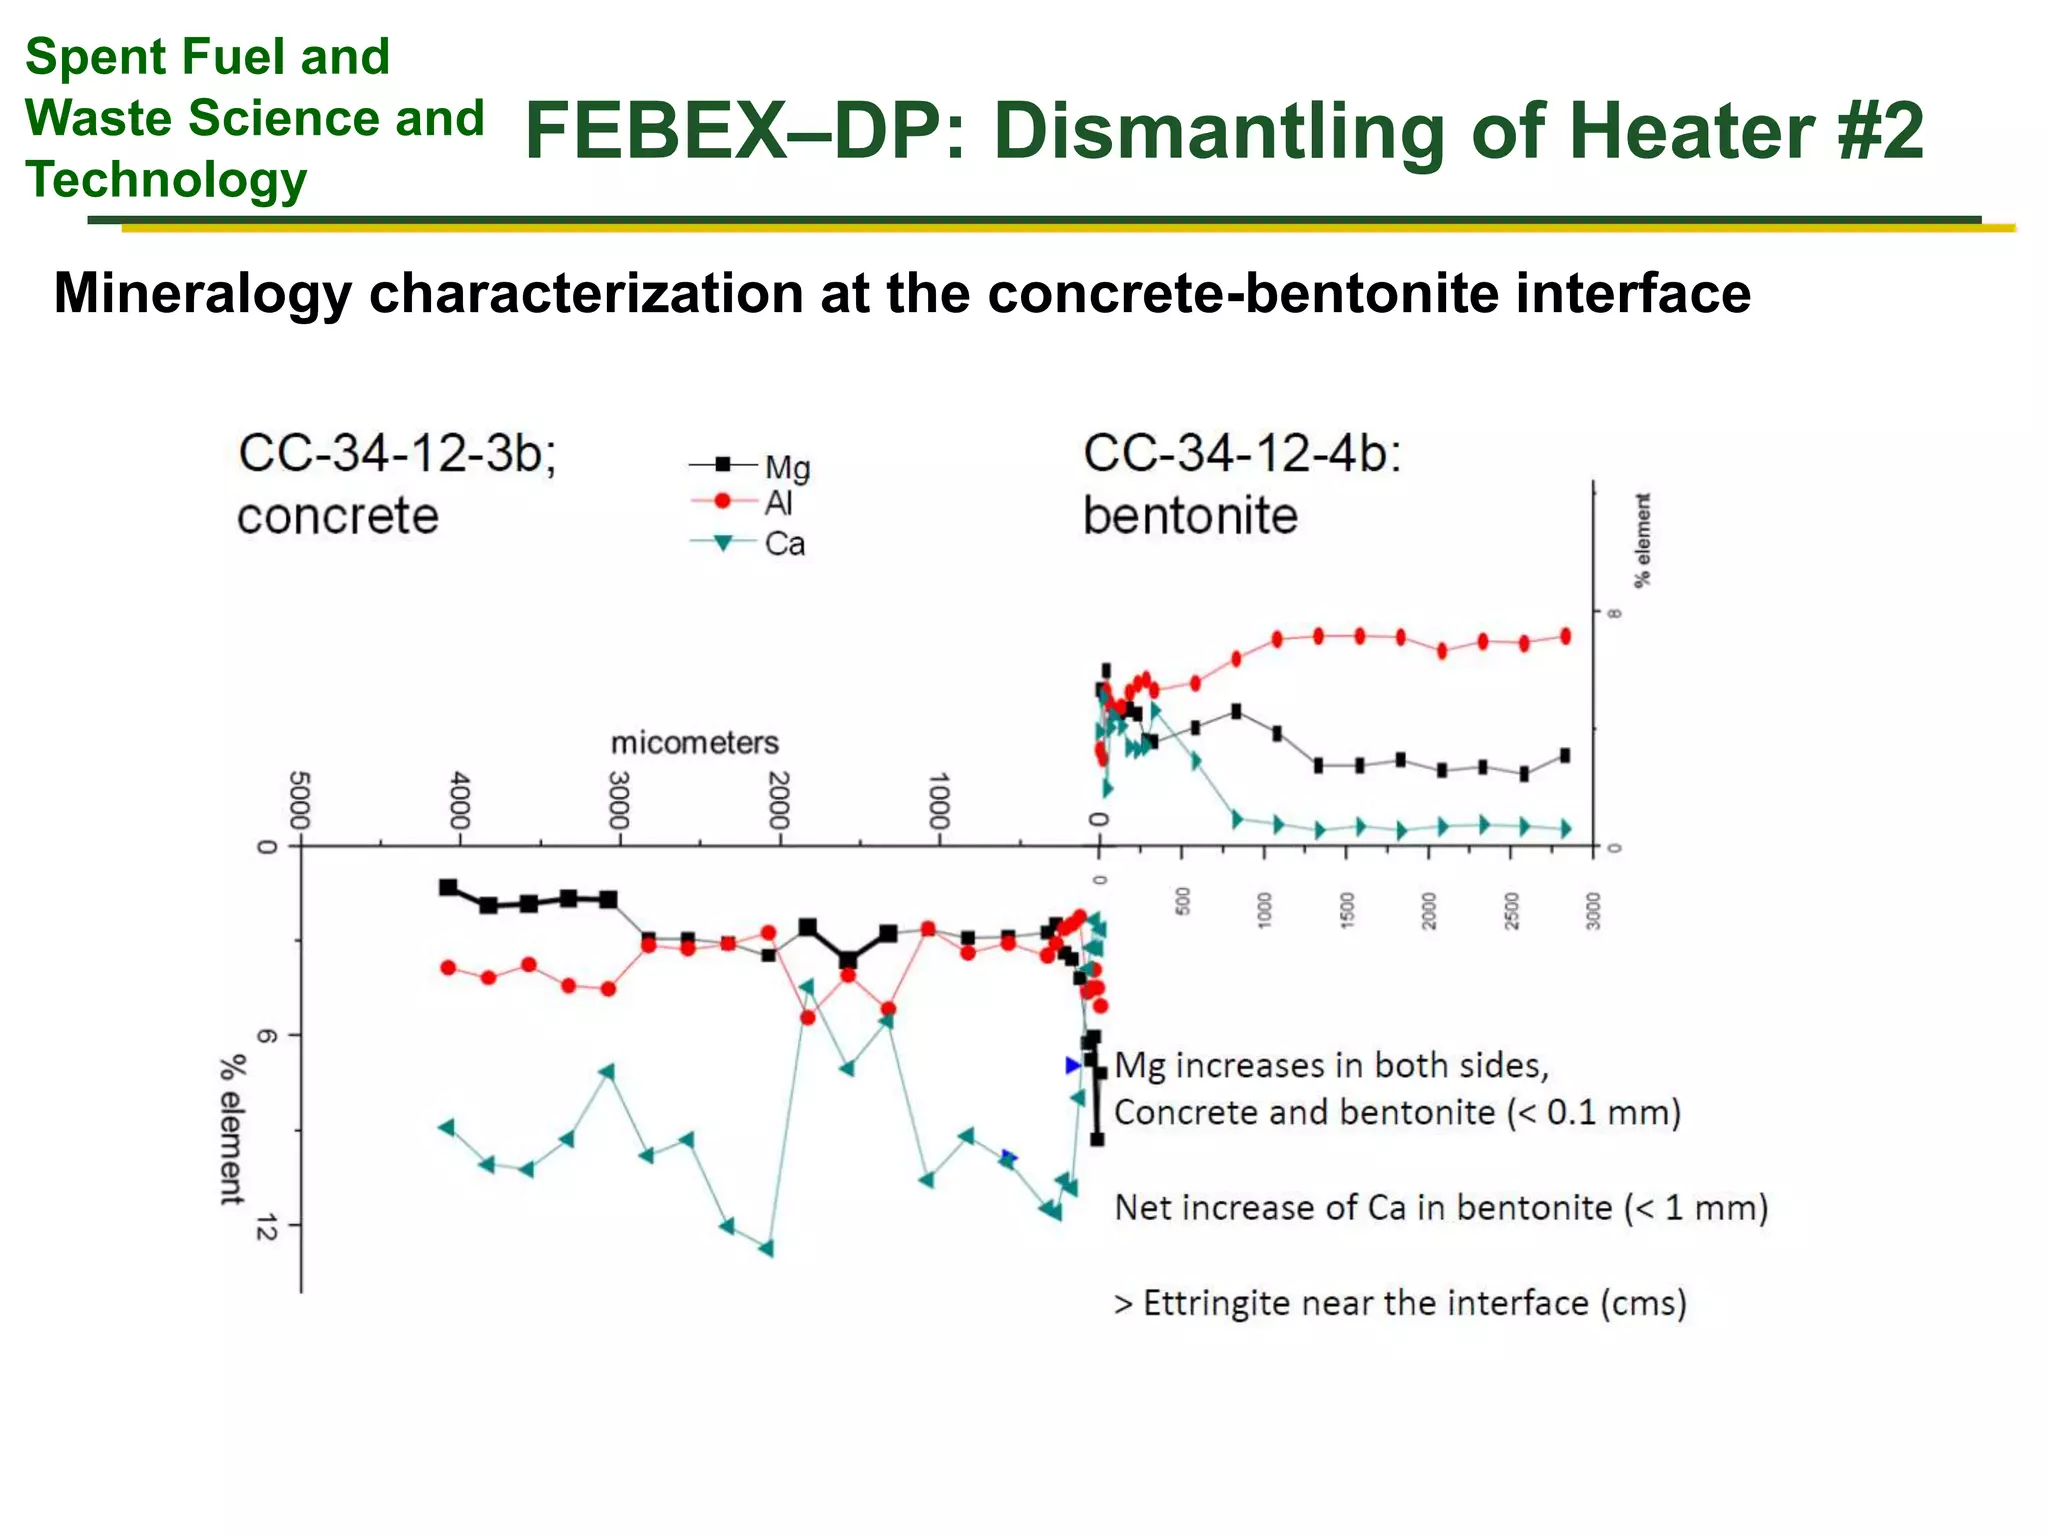
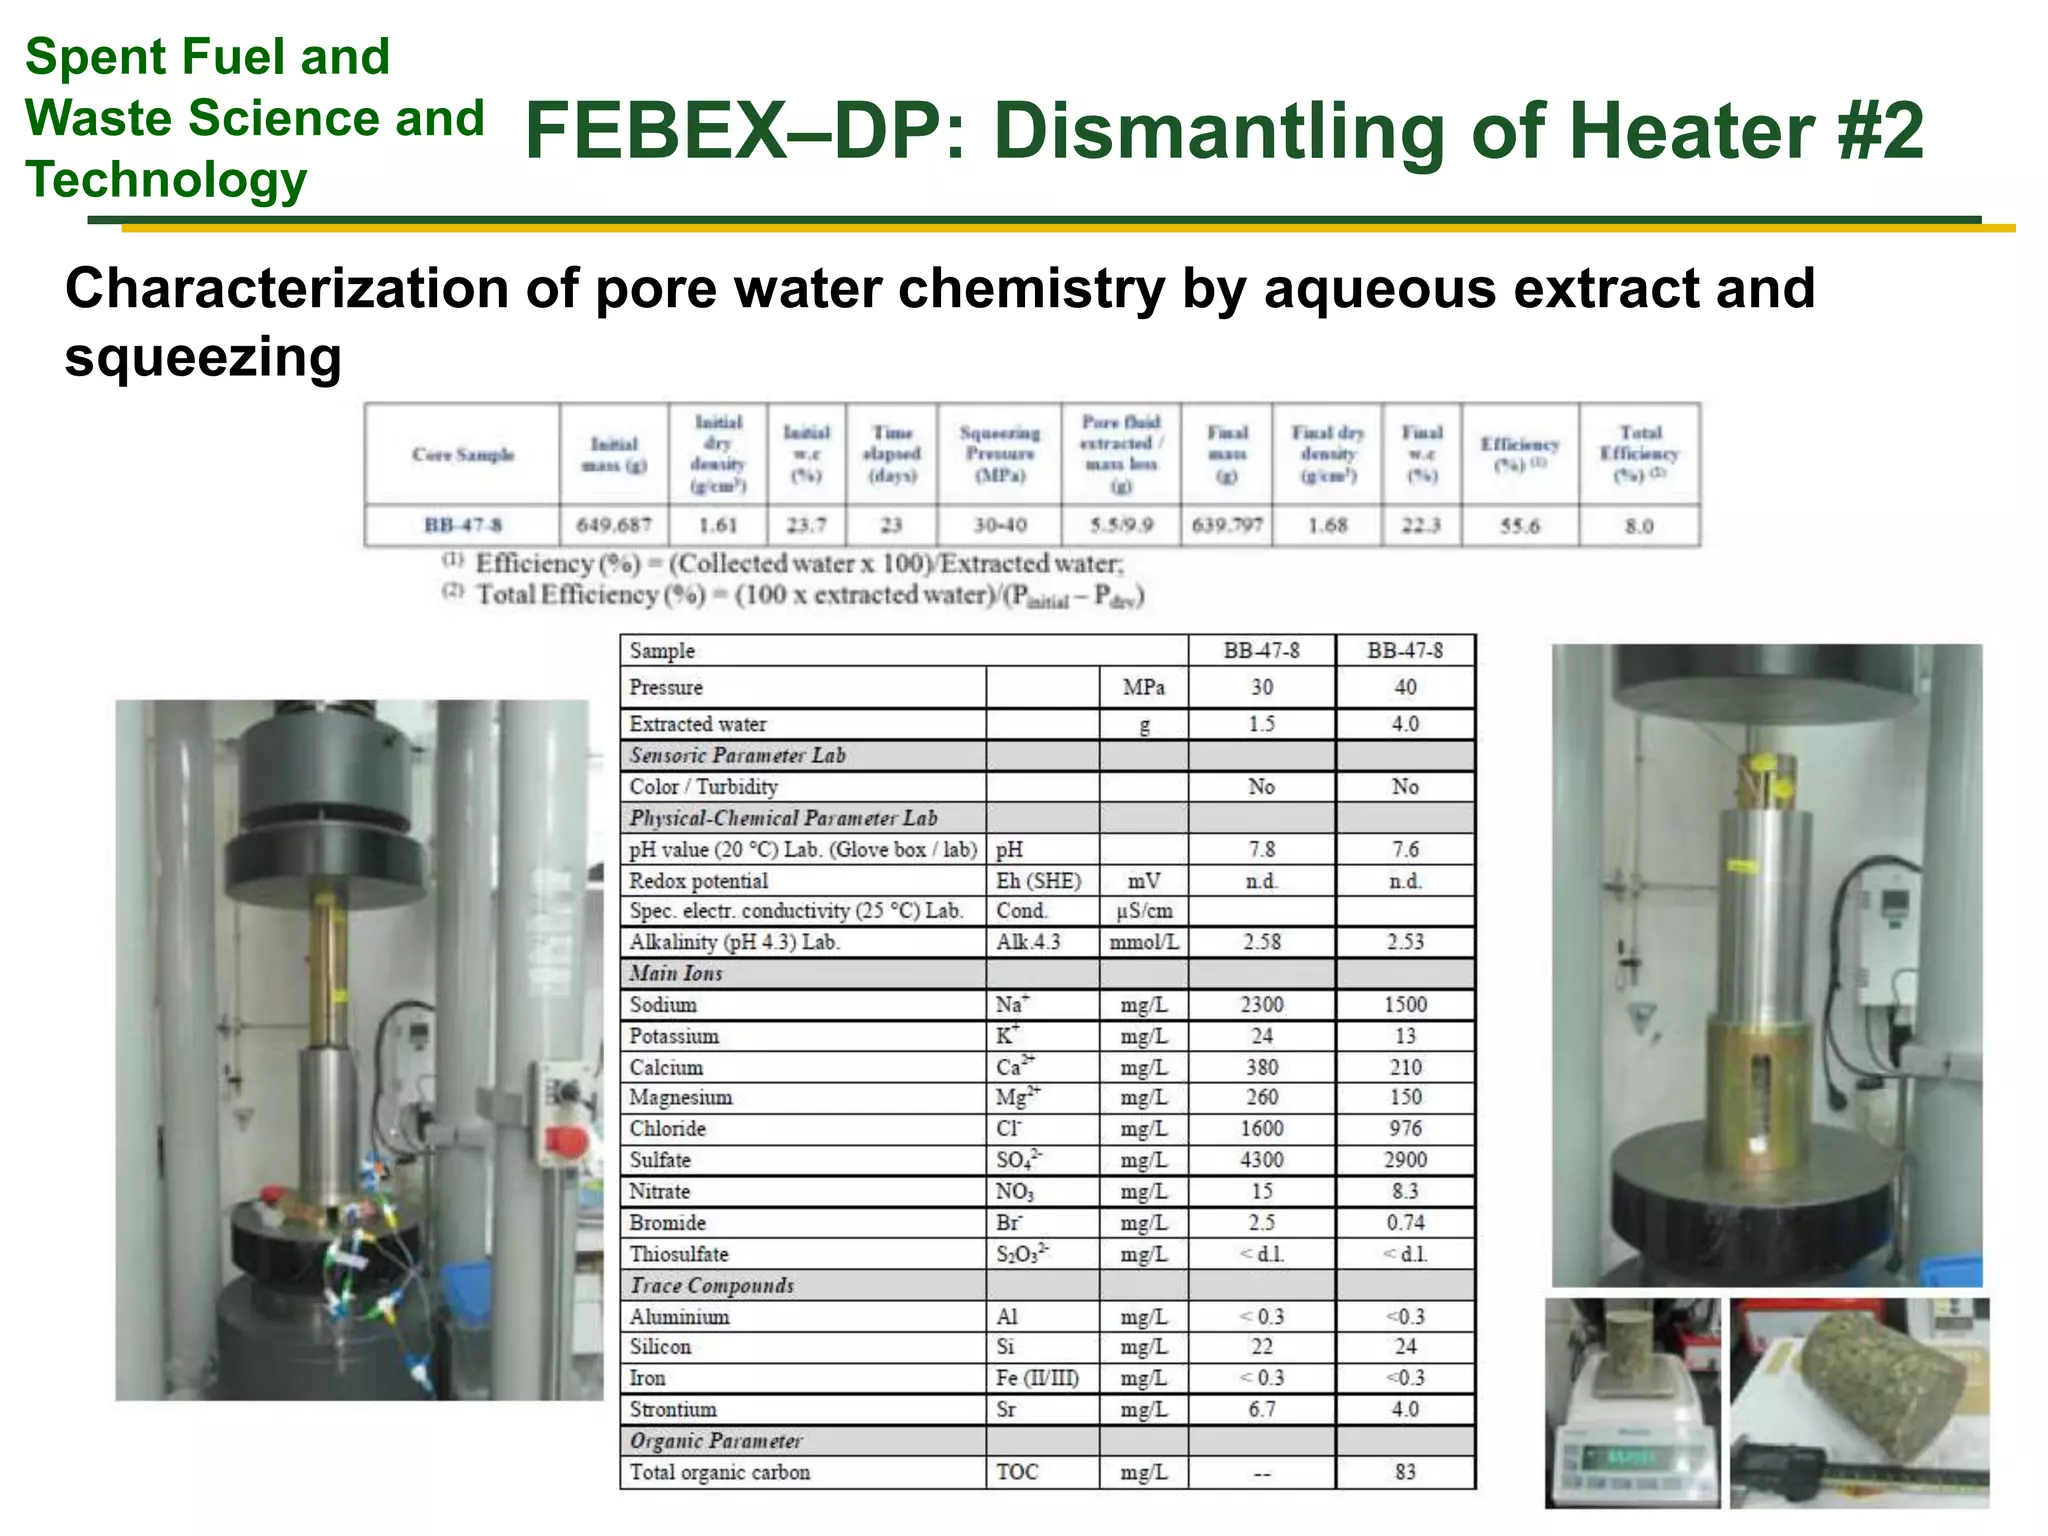
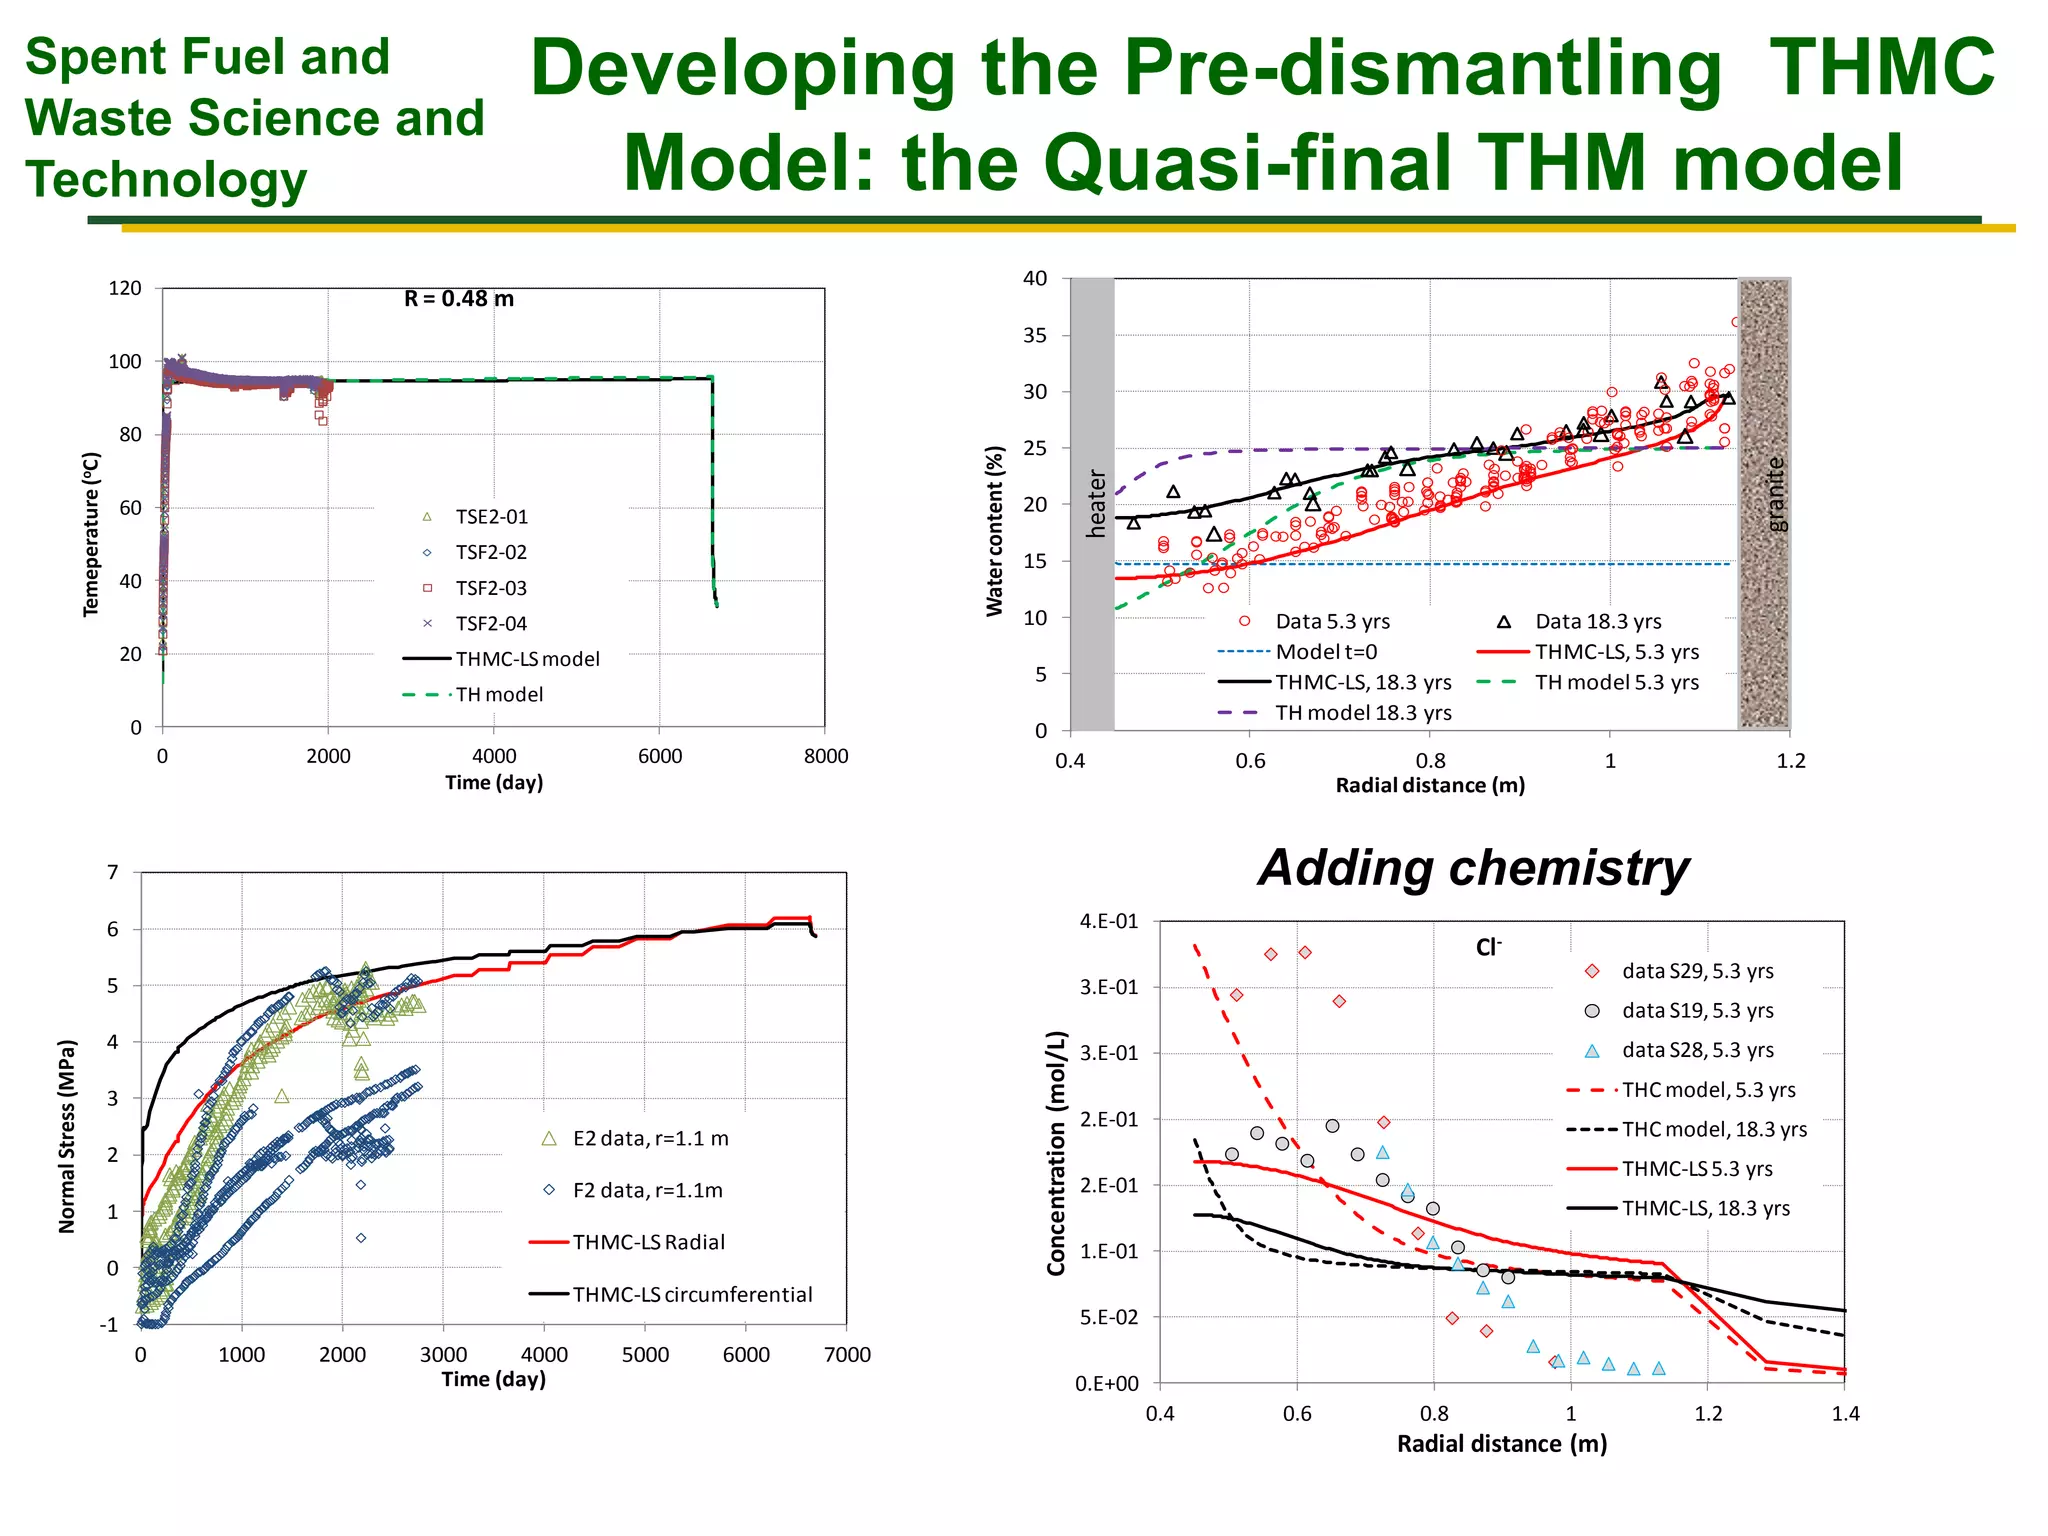
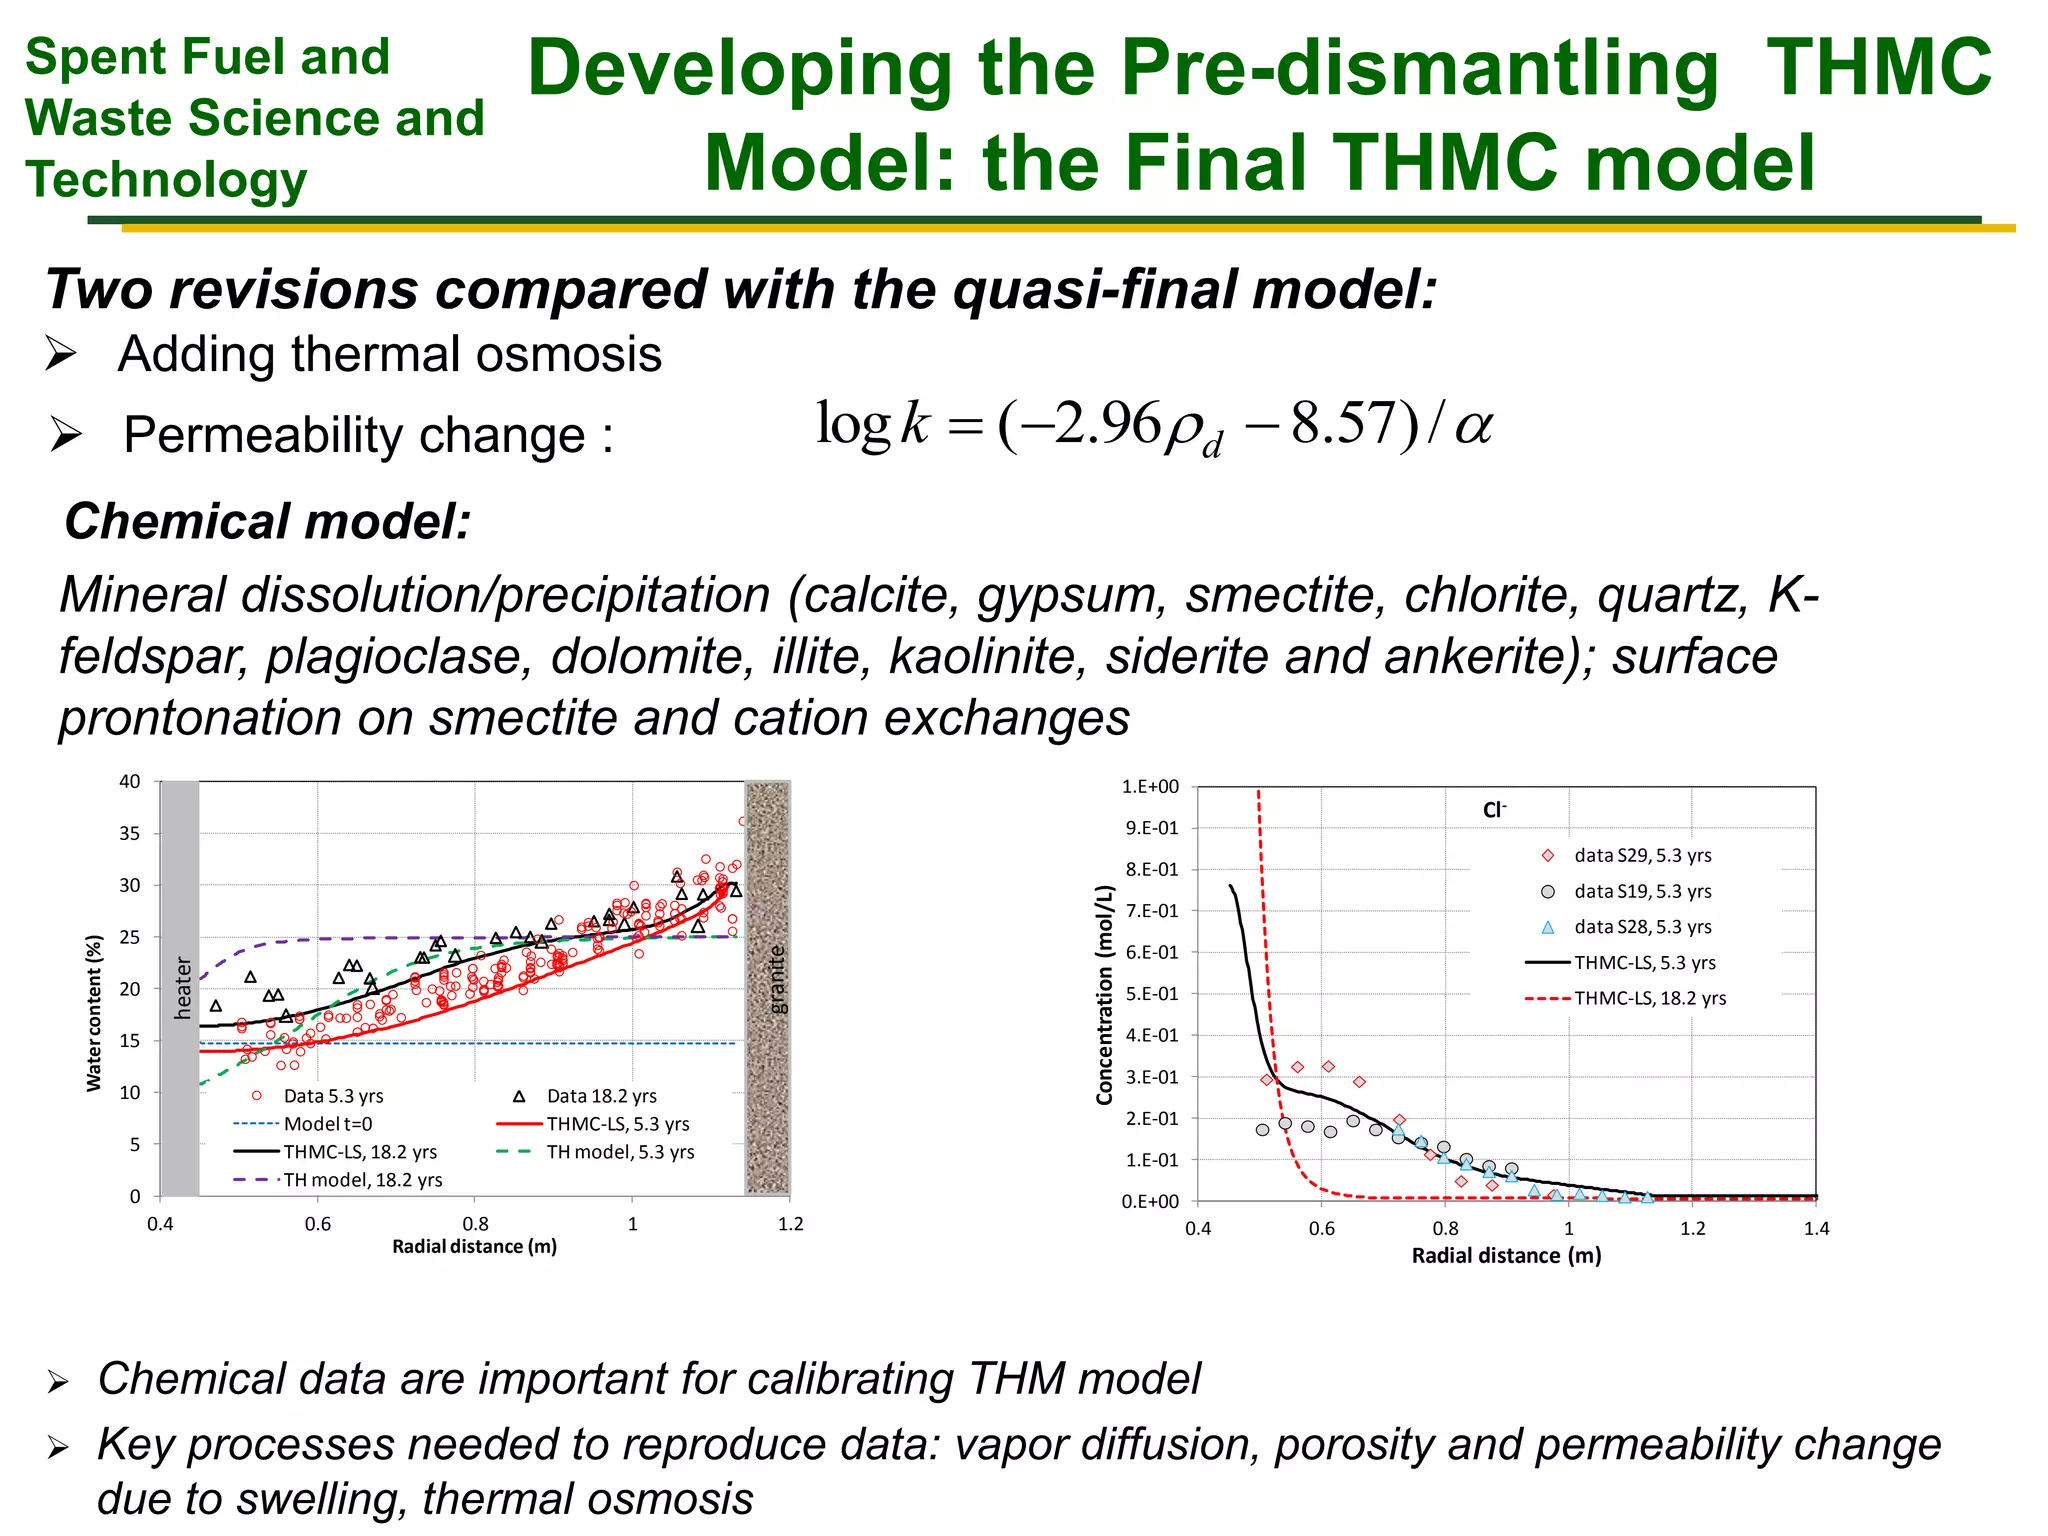
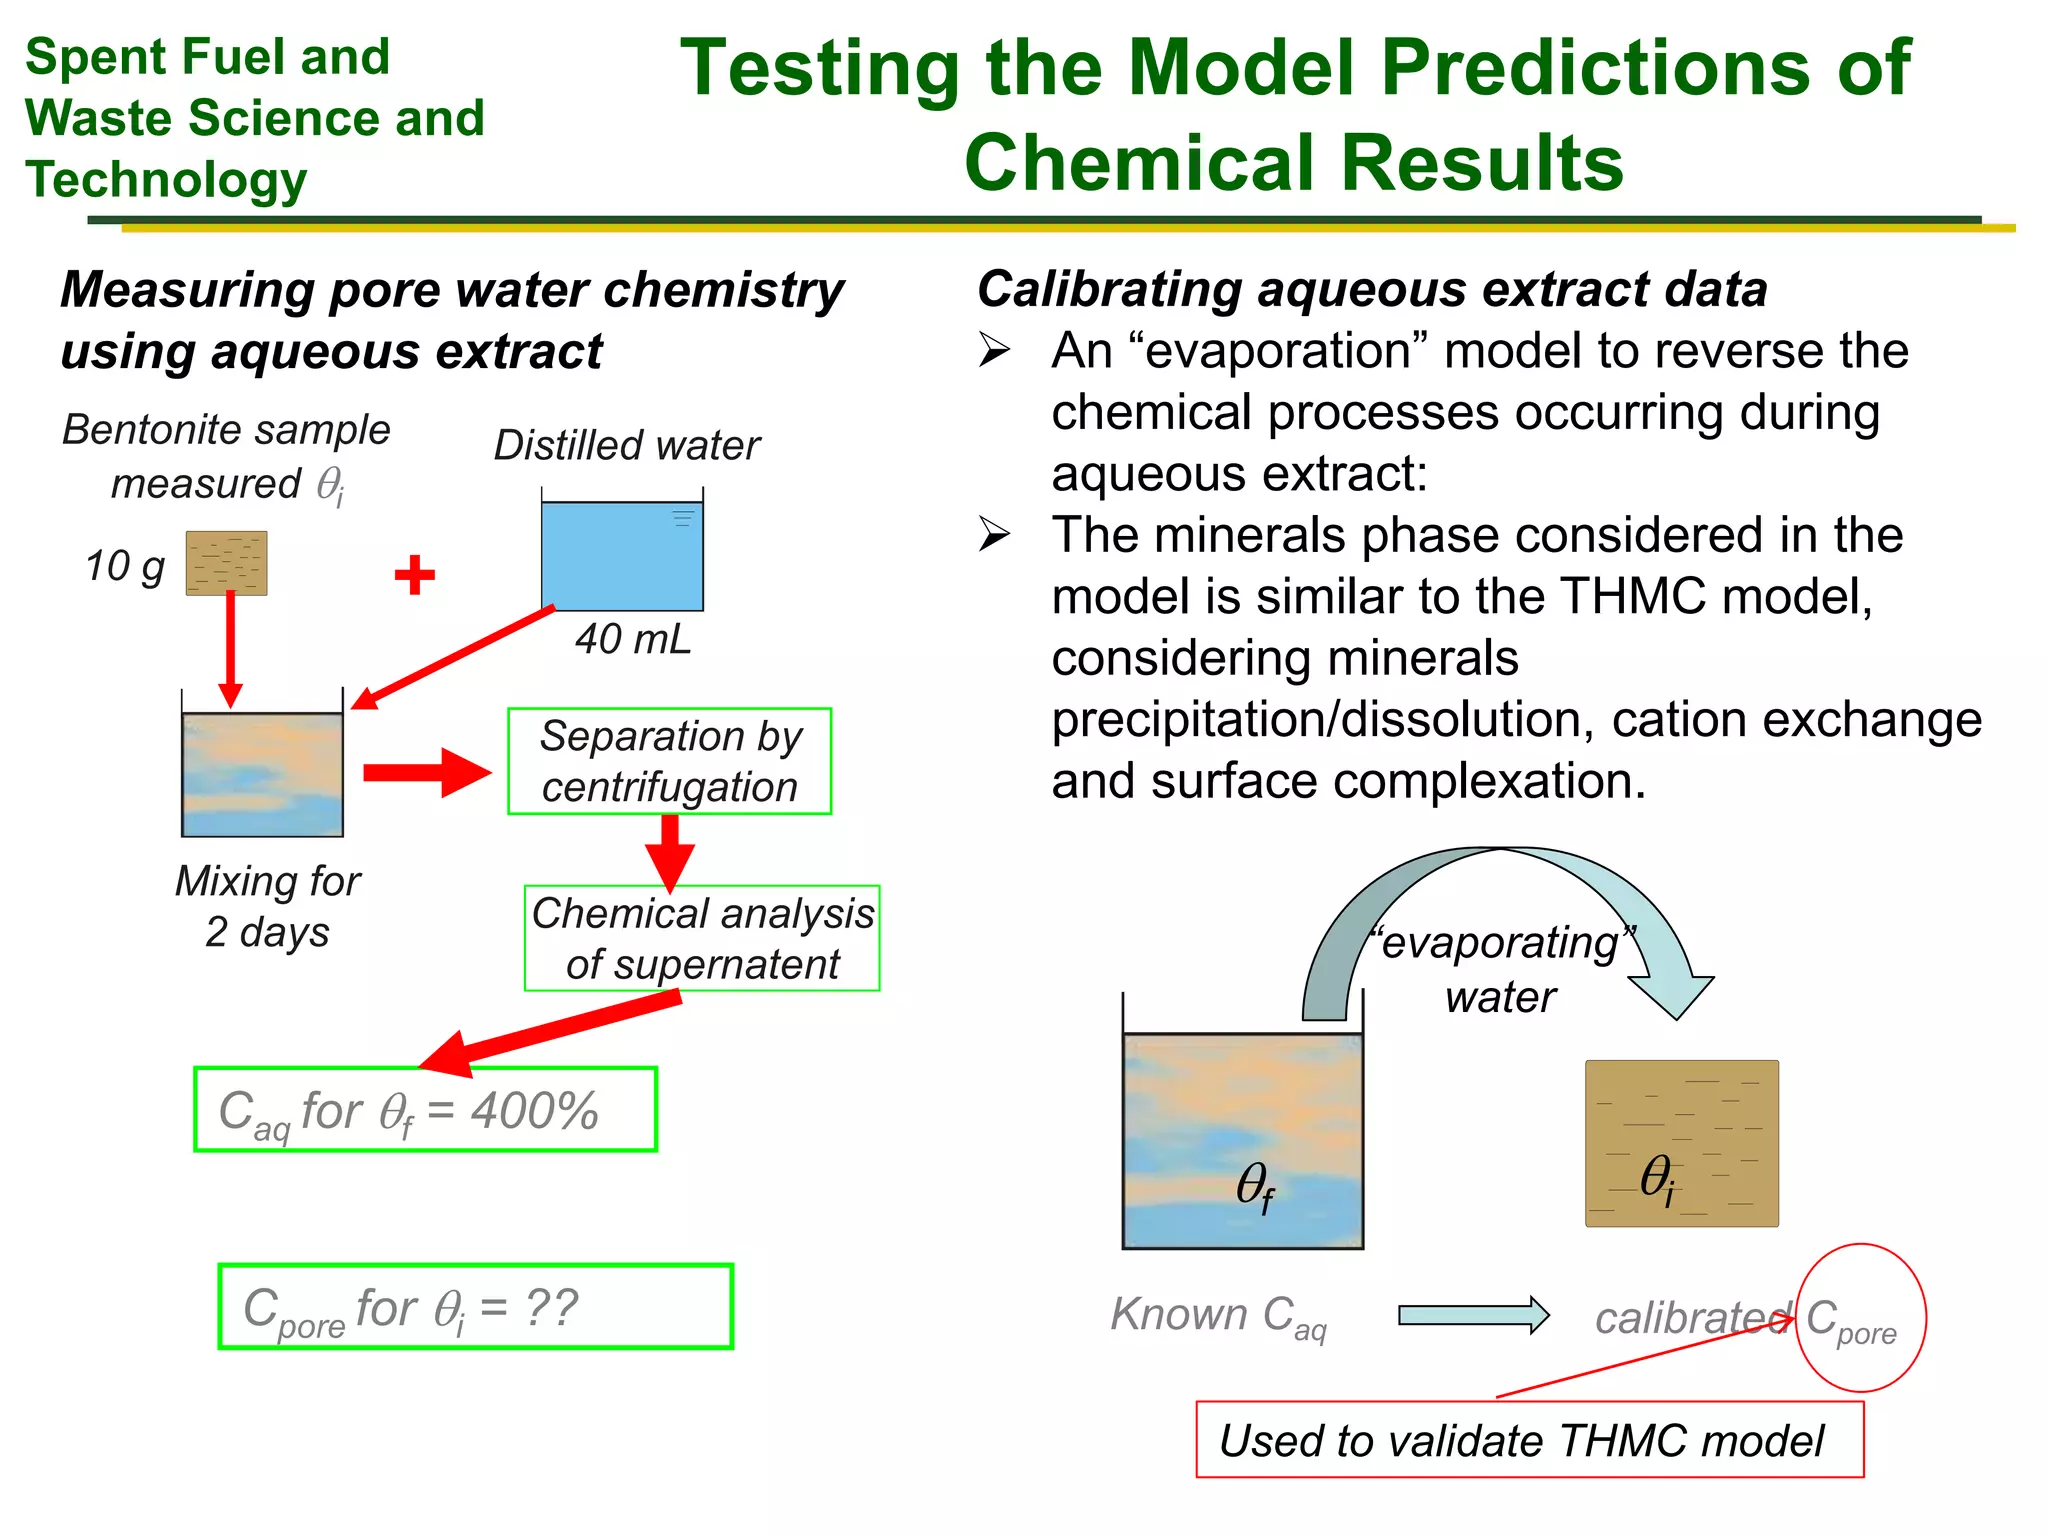
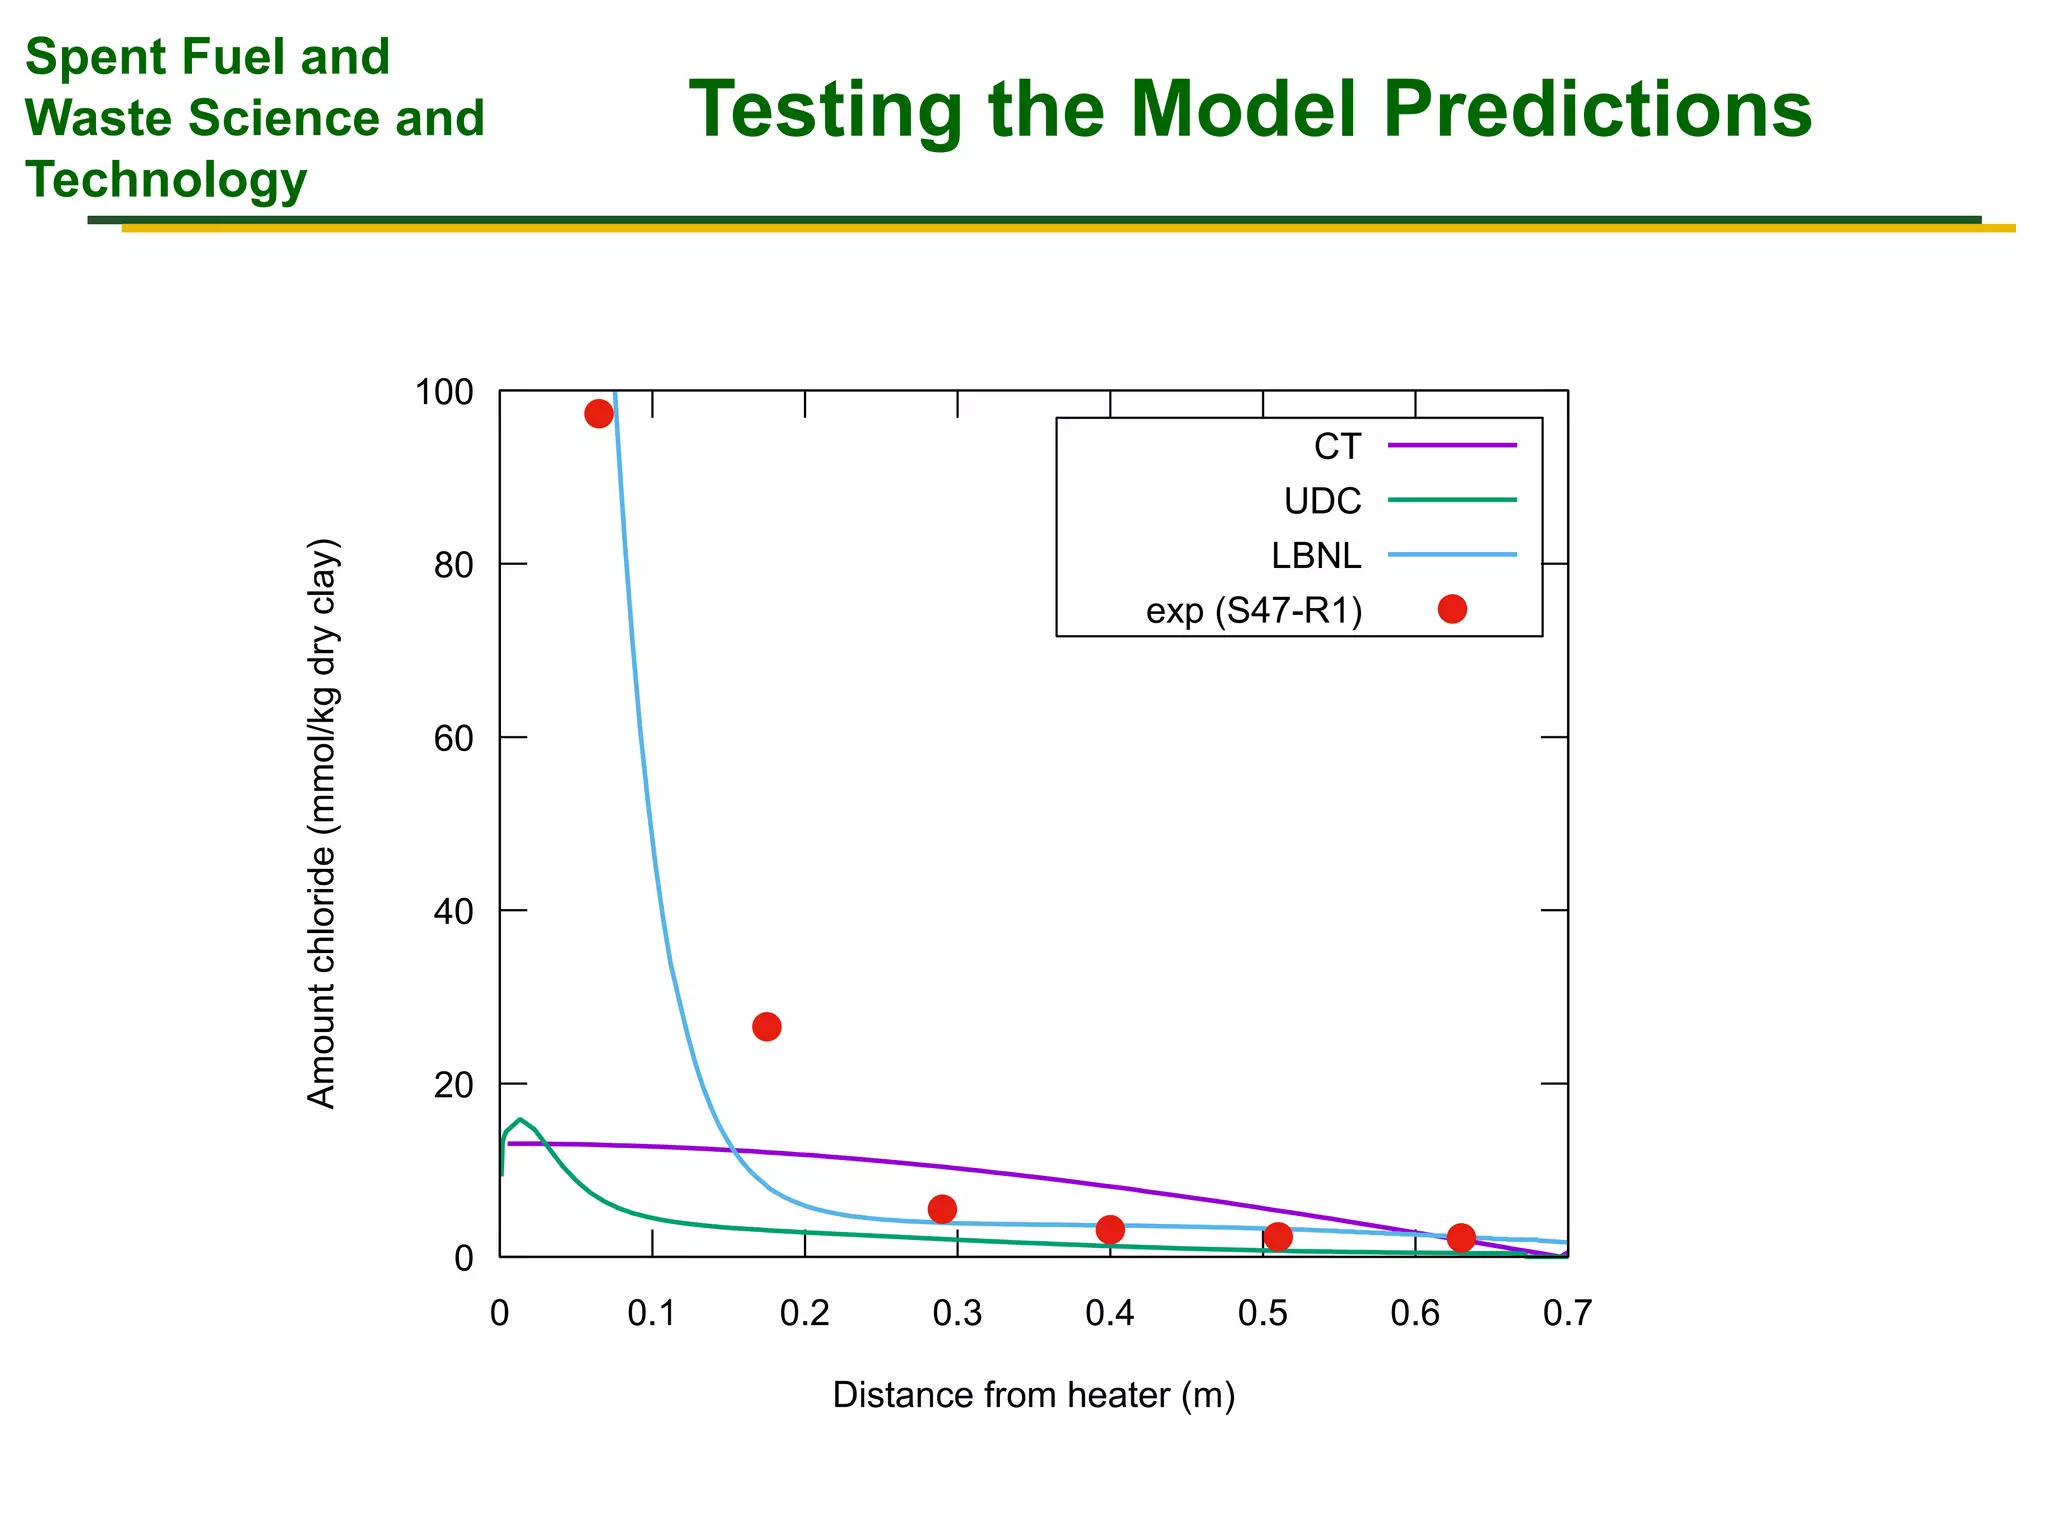
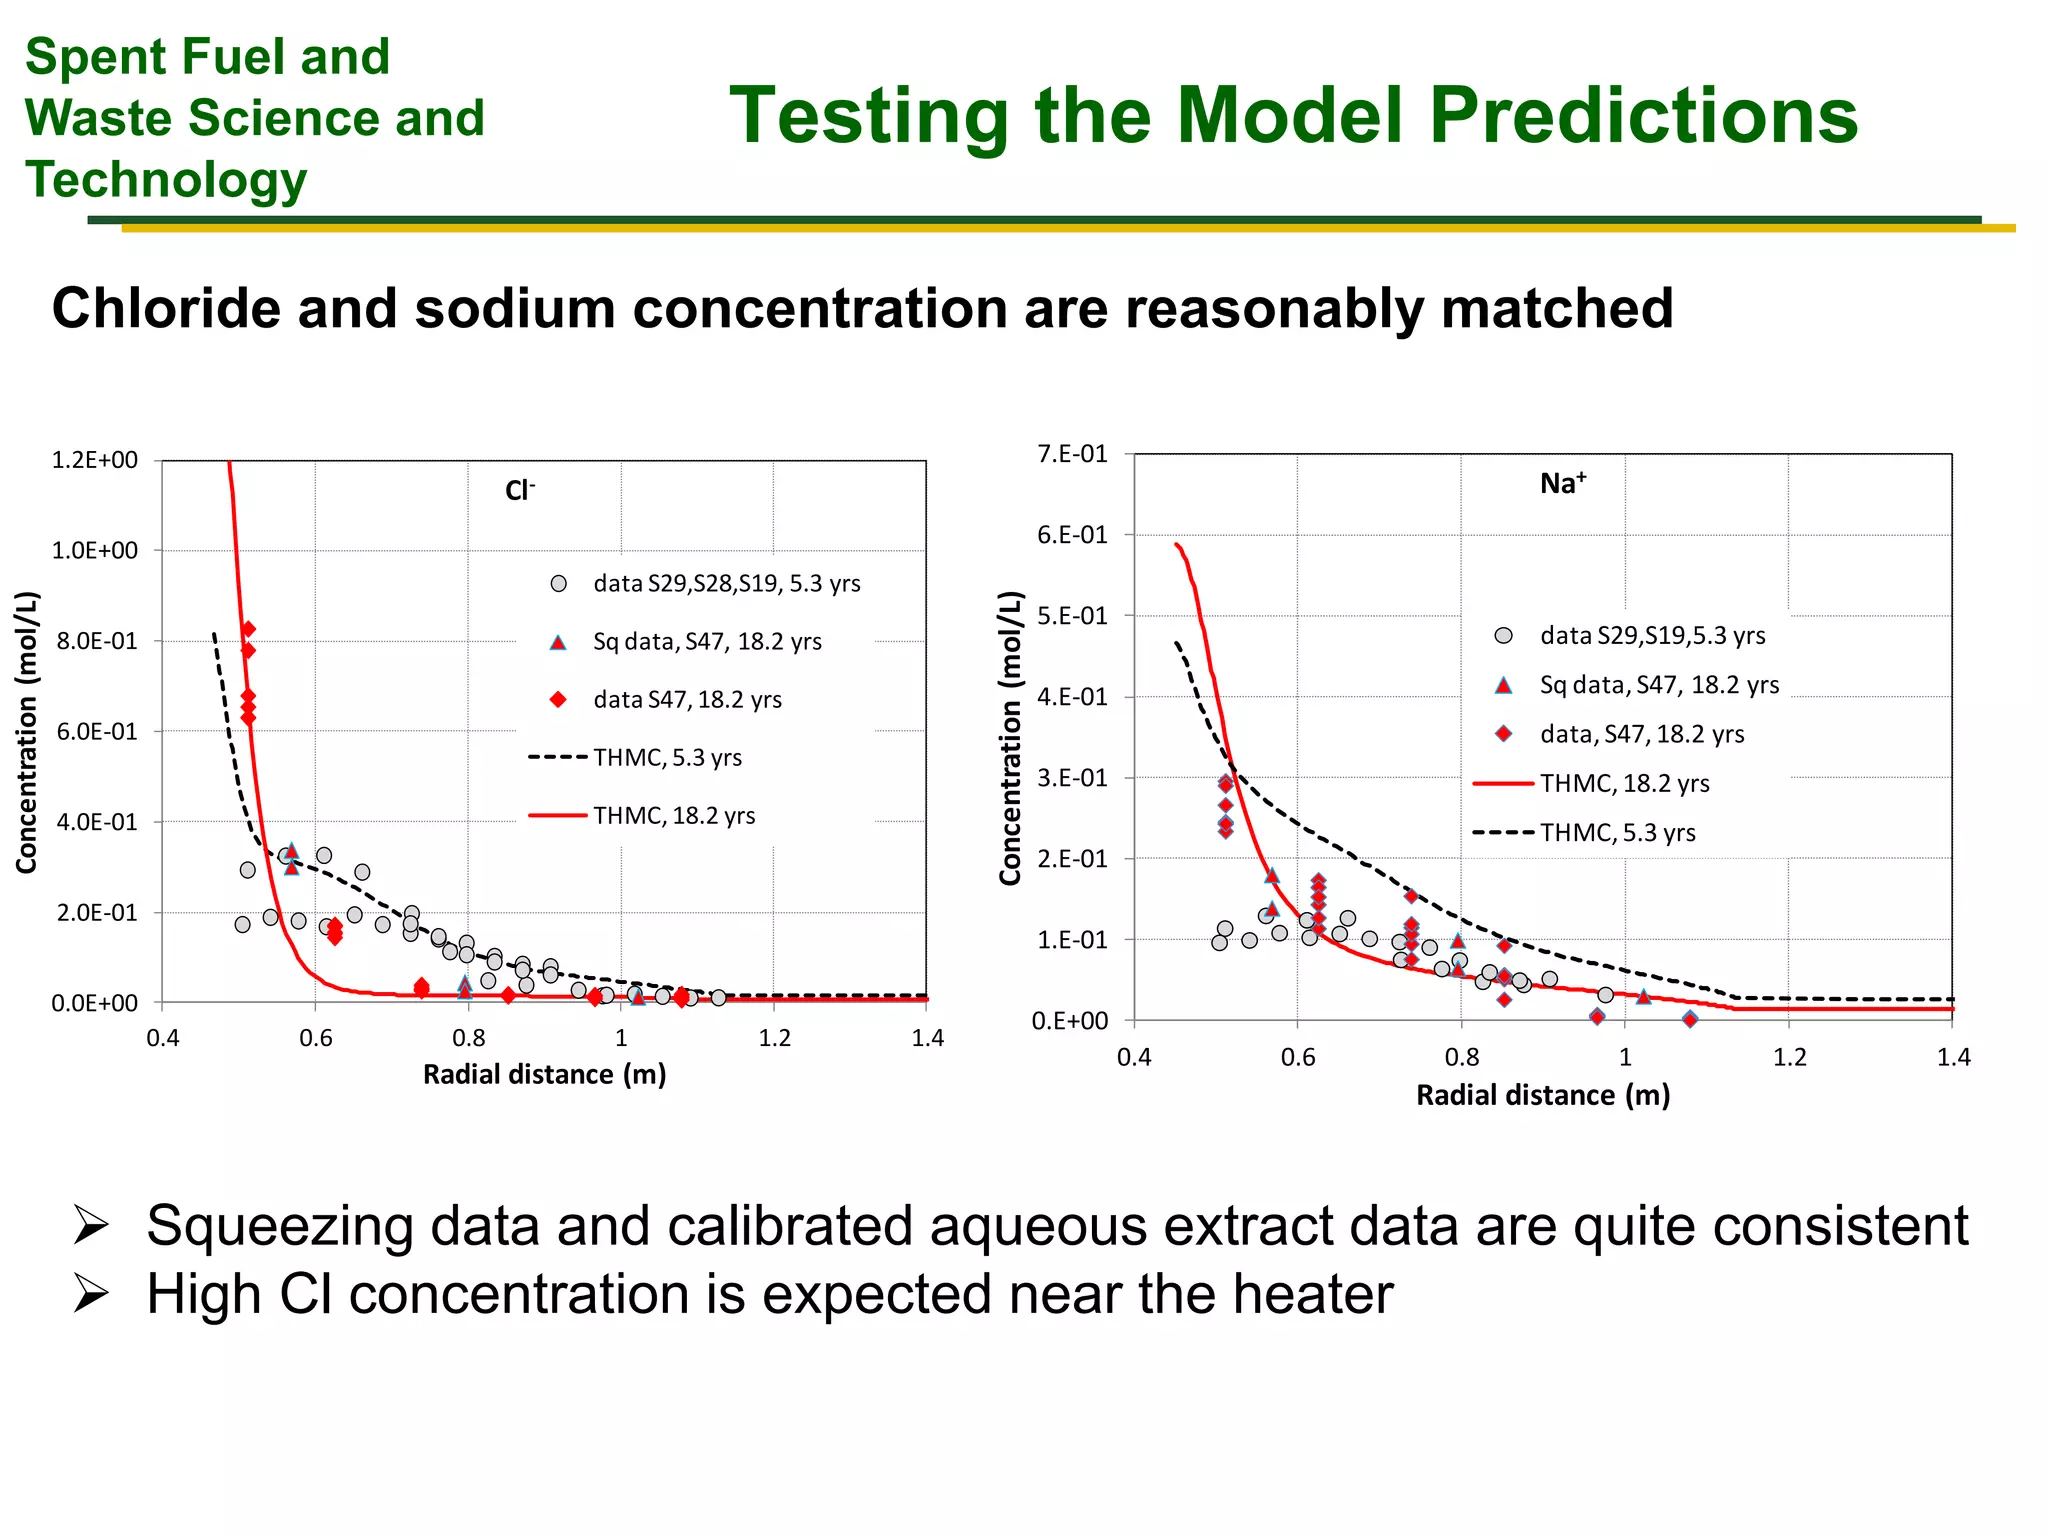
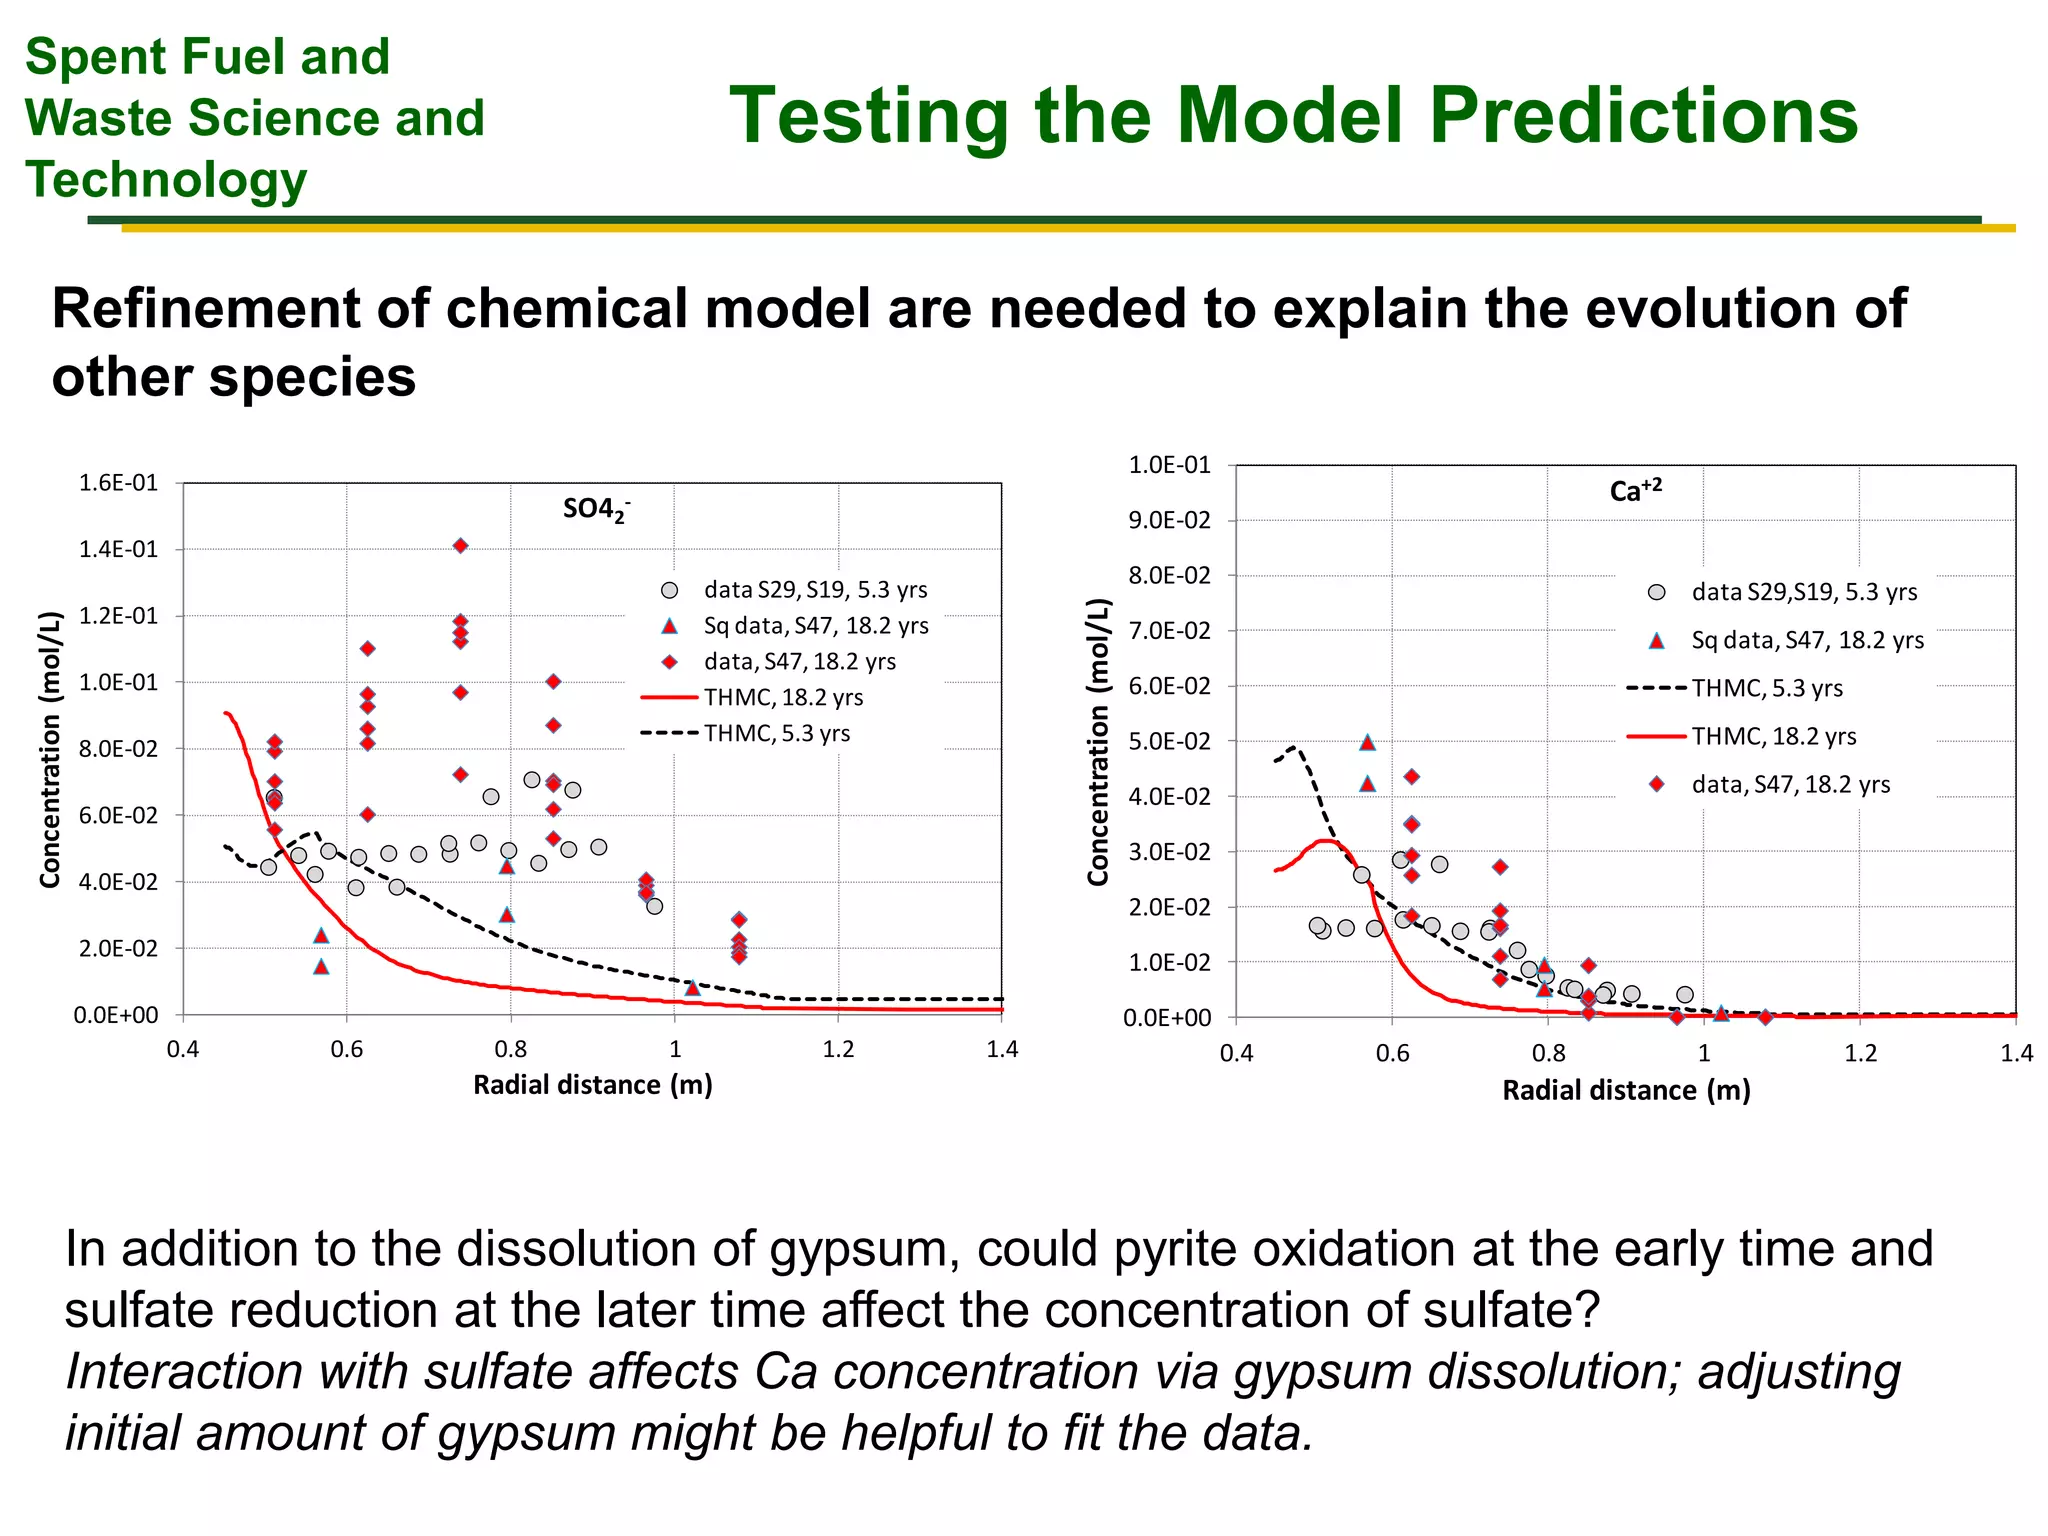
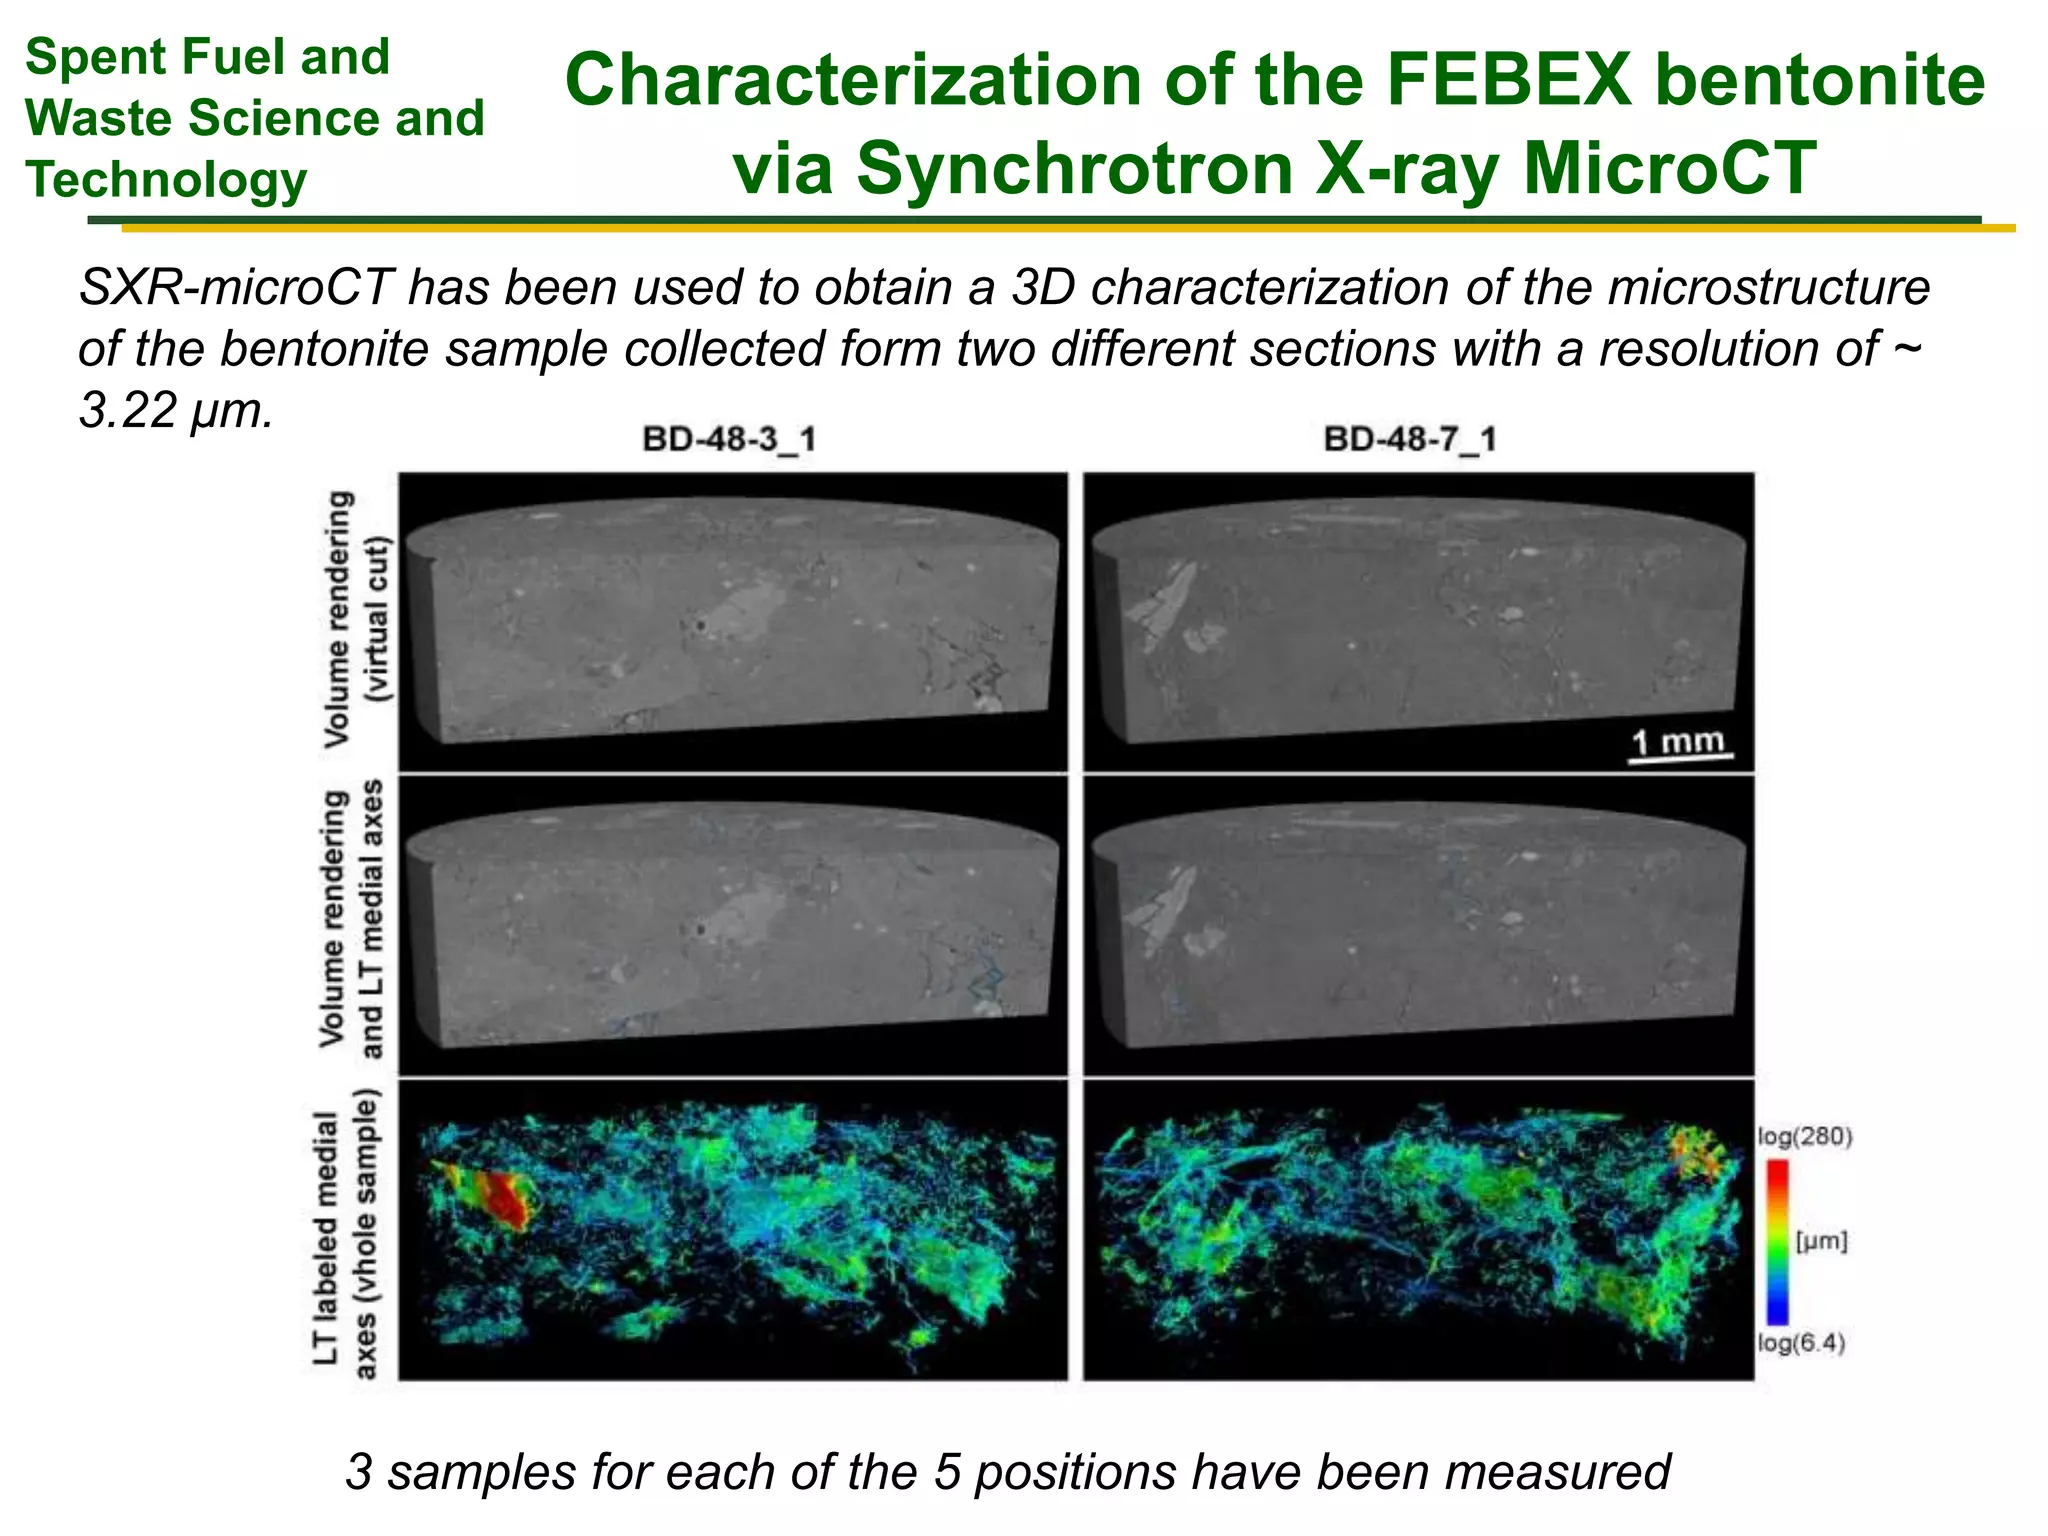
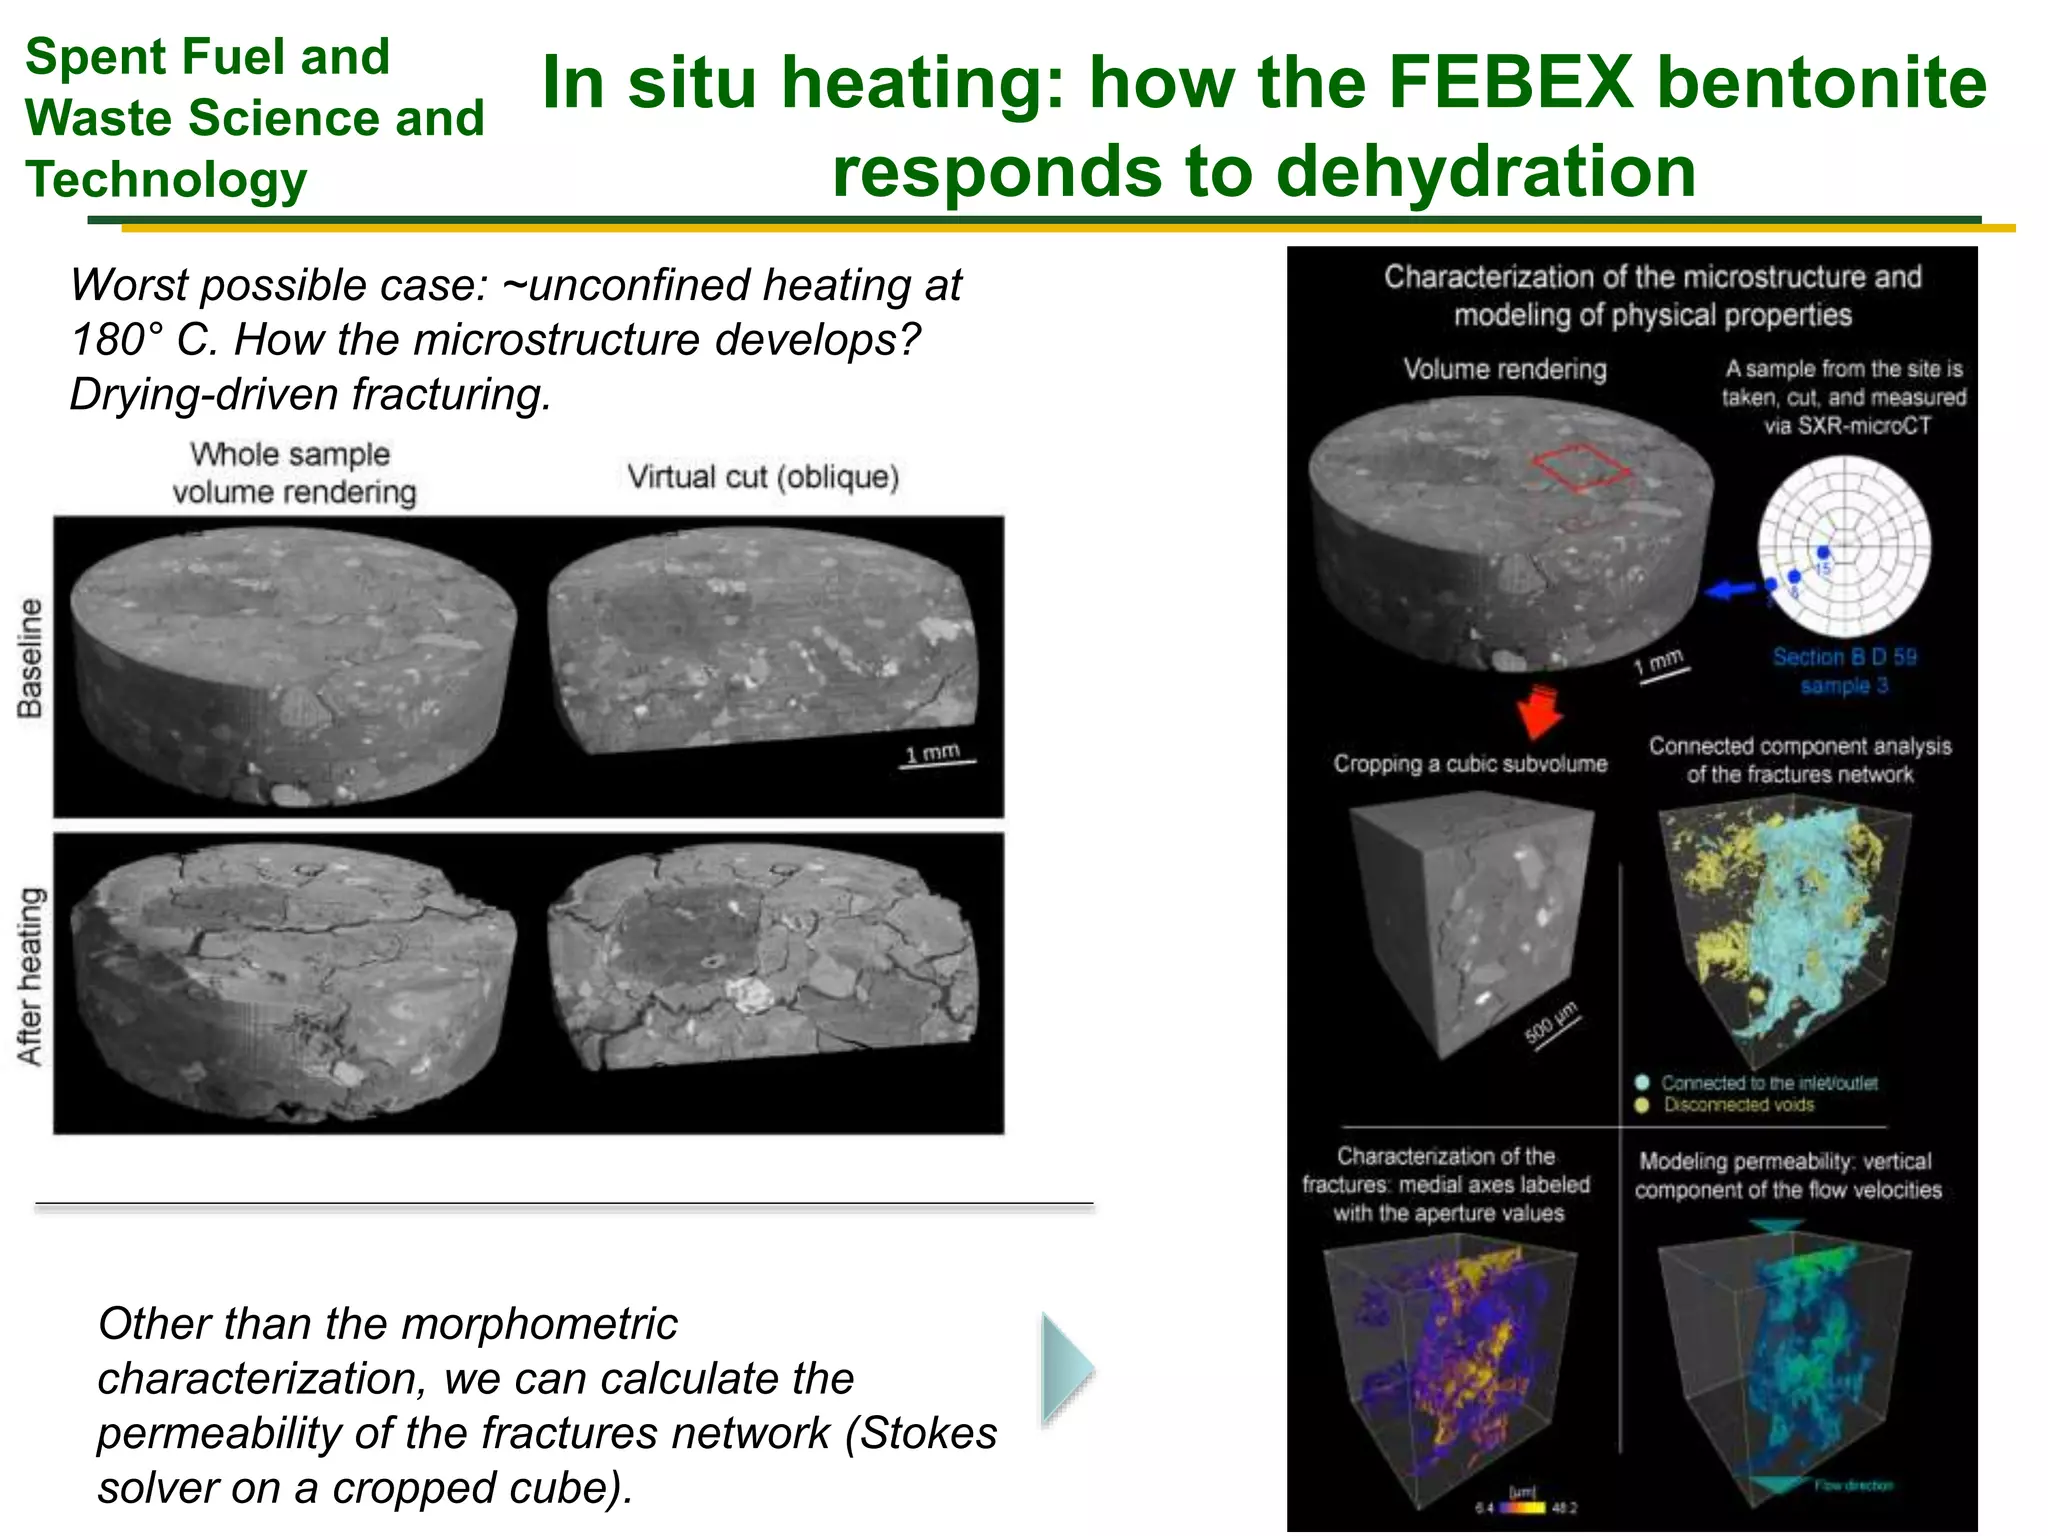
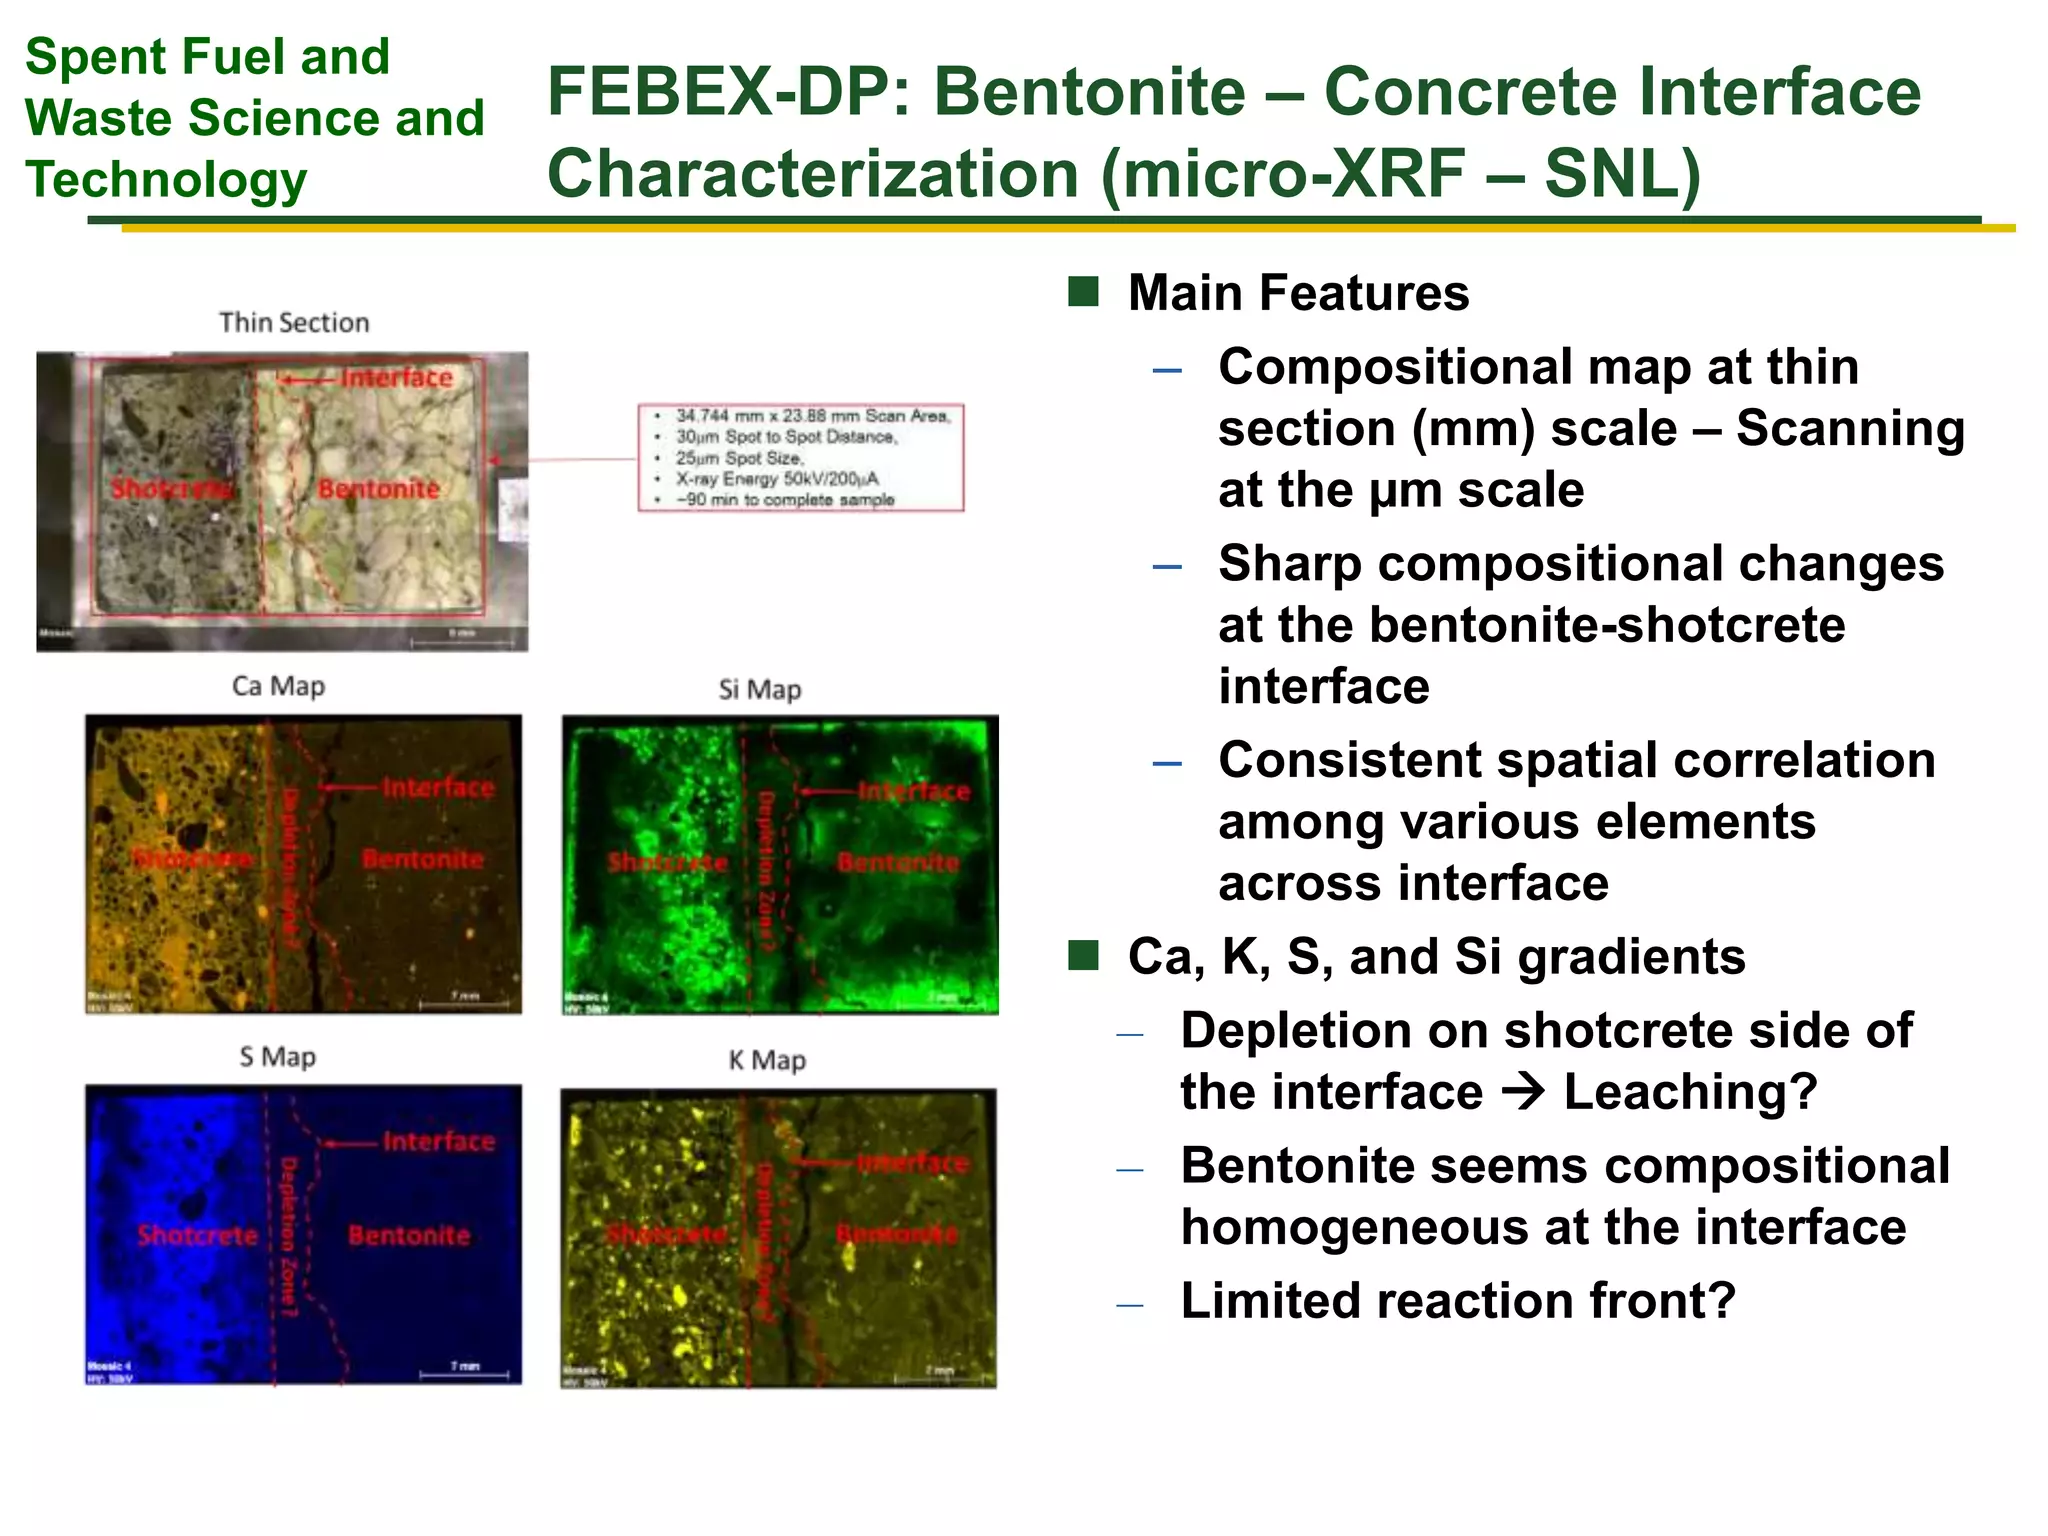
Spent Fuel and Waste Science and Technology
FEBEX-DP Collaboration: Overview and related
SFWST R&D Activities
Liange Zheng, Marco Voltolini, Hao Xu, Jonny Rutqvist, Jens
T. Birkholzer
LBNL, Berkeley, California 94720, USA
Carlos Jove-Colon
Sandia National Laboratory
Las Vegas, NV.
May 23-25, 2017
Spent Fuel and
Waste Science and
Technology
Overview of FEBEX-DP
FEBEX: Full-scale Engineering Barriers EXperiment
Mock-up test
February 1997– now
The full-scale “in situ” test is located in Grimsel,
Switzerland, heating started in 1997.
In 2002, Dismantling of Heater #1
In 2015,
Dismantling of
Heater #2
Spent Fuel and
Waste Science and
Technology
FEBEX–DP: Dismantling of Heater #2
 Bentonite characterization
– Density, water content and spatial distribution
– Chemical changes
 Characterization of corrosion and
microbial processes
– On instruments/sensors and coupons
– Bacterial growth
– All under evolving redox-conditions
 Mineralogical interactions at material
interfaces
– Concrete - bentonite, heater/liner – bentonite,
rock - bentonite
– Impact on pore water composition
 Integration of the monitoring results and
modelling
– THM/THMC modelling
– Pre- and post dismantling
Extensive laboratory tests were carried
out to characterize the THMC properties of
bentonite, concrete, steel liner and granite
Spent Fuel and
Waste Science and
Technology
Hot
sections
Cold
sections
Hot
sections
Cold
sections
FEBEX–DP: Dismantling of Heater #2
THM characterization of bentonite samples
Spent Fuel and
Waste Science and
Technology
FEBEX–DP: Dismantling of Heater #2
Mineralogy characterization at the concrete-bentonite interface
Spent Fuel and
Waste Science and
Technology
FEBEX–DP: Dismantling of Heater #2
Characterization of pore water chemistry by aqueous extract and
squeezing
Spent Fuel and
Waste Science and
Technology
SFWST R&D Activities Related to
FEBEX-DP
Validating coupled THMC model with FEBEX-DP
data
Analyzing the microscopic structure
Spent Fuel and
Waste Science and
Technology
Developing the Pre-dismantling THMC
Model: the Quasi-final THM model
0
20
40
60
80
100
120
0 2000 4000 6000 8000
Temeperature(oC)
Time (day)
R = 0.48 m
TSE2-01
TSF2-02
TSF2-03
TSF2-04
THMC-LSmodel
TH model
0
5
10
15
20
25
30
35
40
0.4 0.6 0.8 1 1.2
Watercontent(%)
Radial distance (m)
Data 5.3 yrs Data 18.3 yrs
Model t=0 THMC-LS, 5.3 yrs
THMC-LS, 18.3 yrs TH model 5.3 yrs
TH model 18.3 yrs
heater
granite
-1
0
1
2
3
4
5
6
7
0 1000 2000 3000 4000 5000 6000 7000
NormalStress(MPa)
Time (day)
E2data, r=1.1 m
F2 data, r=1.1m
THMC-LSRadial
THMC-LScircumferential
Adding chemistry
0.E+00
5.E-02
1.E-01
2.E-01
2.E-01
3.E-01
3.E-01
4.E-01
0.4 0.6 0.8 1 1.2 1.4
Concentration(mol/L)
Radial distance (m)
Cl-
data S29,5.3 yrs
data S19,5.3 yrs
data S28,5.3 yrs
THC model,5.3 yrs
THC model,18.3 yrs
THMC-LS5.3 yrs
THMC-LS,18.3 yrs
Spent Fuel and
Waste Science and
Technology
Developing the Pre-dismantling THMC
Model: the Final THMC model
 Permeability change :  /)57.896.2(log  dk
Chemical model:
Mineral dissolution/precipitation (calcite, gypsum, smectite, chlorite, quartz, K-
feldspar, plagioclase, dolomite, illite, kaolinite, siderite and ankerite); surface
prontonation on smectite and cation exchanges
 Chemical data are important for calibrating THM model
 Key processes needed to reproduce data: vapor diffusion, porosity and permeability change
due to swelling, thermal osmosis
Two revisions compared with the quasi-final model:
 Adding thermal osmosis
0
5
10
15
20
25
30
35
40
0.4 0.6 0.8 1 1.2
Watercontent(%)
Radial distance (m)
Data 5.3 yrs Data 18.2 yrs
Model t=0 THMC-LS,5.3 yrs
THMC-LS,18.2 yrs TH model,5.3 yrs
TH model,18.2 yrs
heater
granite
0.E+00
1.E-01
2.E-01
3.E-01
4.E-01
5.E-01
6.E-01
7.E-01
8.E-01
9.E-01
1.E+00
0.4 0.6 0.8 1 1.2 1.4
Concentration(mol/L)
Radial distance (m)
Cl-
data S29,5.3 yrs
data S19,5.3 yrs
data S28,5.3 yrs
THMC-LS,5.3 yrs
THMC-LS,18.2 yrs
Spent Fuel and
Waste Science and
Technology
Testing the Model Predictions of
Chemical Results
Calibrating aqueous extract data
 An “evaporation” model to reverse the
chemical processes occurring during
aqueous extract:
 The minerals phase considered in the
model is similar to the THMC model,
considering minerals
precipitation/dissolution, cation exchange
and surface complexation.
Distilled water
40 mL
10 g
Bentonite sample
measured i
Chemical analysis
of supernatent
Mixing for
2 days
+
Separation by
centrifugation
Caq for f = 400%
Cpore for i = ??
Measuring pore water chemistry
using aqueous extract
“evaporating”
water
Known Caq calibrated Cpore
f
i
Used to validate THMC model
Spent Fuel and
Waste Science and
Technology
Testing the Model Predictions
Spent Fuel and
Waste Science and
Technology
Testing the Model Predictions
Chloride and sodium concentration are reasonably matched
 Squeezing data and calibrated aqueous extract data are quite consistent
 High Cl concentration is expected near the heater
0.0E+00
2.0E-01
4.0E-01
6.0E-01
8.0E-01
1.0E+00
1.2E+00
0.4 0.6 0.8 1 1.2 1.4
Concentration(mol/L)
Radial distance (m)
Cl-
data S29,S28,S19, 5.3 yrs
Sq data,S47, 18.2 yrs
data S47,18.2 yrs
THMC,5.3 yrs
THMC,18.2 yrs
0.E+00
1.E-01
2.E-01
3.E-01
4.E-01
5.E-01
6.E-01
7.E-01
0.4 0.6 0.8 1 1.2 1.4
Concentration(mol/L)
Radial distance (m)
Na+
data S29,S19,5.3 yrs
Sq data,S47, 18.2 yrs
data,S47,18.2 yrs
THMC,18.2 yrs
THMC,5.3 yrs
Spent Fuel and
Waste Science and
Technology
Testing the Model Predictions
Refinement of chemical model are needed to explain the evolution of
other species
In addition to the dissolution of gypsum, could pyrite oxidation at the early time and
sulfate reduction at the later time affect the concentration of sulfate?
Interaction with sulfate affects Ca concentration via gypsum dissolution; adjusting
initial amount of gypsum might be helpful to fit the data.
0.0E+00
2.0E-02
4.0E-02
6.0E-02
8.0E-02
1.0E-01
1.2E-01
1.4E-01
1.6E-01
0.4 0.6 0.8 1 1.2 1.4
Concentration(mol/L)
Radial distance (m)
SO42
-
data S29,S19, 5.3 yrs
Sq data,S47, 18.2 yrs
data,S47,18.2 yrs
THMC,18.2 yrs
THMC,5.3 yrs
0.0E+00
1.0E-02
2.0E-02
3.0E-02
4.0E-02
5.0E-02
6.0E-02
7.0E-02
8.0E-02
9.0E-02
1.0E-01
0.4 0.6 0.8 1 1.2 1.4
Concentration(mol/L) Radial distance (m)
Ca+2
data S29,S19, 5.3 yrs
Sq data,S47, 18.2 yrs
THMC,5.3 yrs
THMC,18.2 yrs
data, S47, 18.2 yrs
Spent Fuel and
Waste Science and
Technology
Towards the Final Interpretation of
Chemical Data
 Corrosion of liner and Fe-bentonite interaction?
 Evolution of gases: CO2(g), O2, CH4?
 Biochemical reactions?
 Cross diffusion?
 2-D model with “cold” sections
 ….
Spent Fuel and
Waste Science and
Technology
Characterization of the FEBEX bentonite
via Synchrotron X-ray MicroCT
SXR-microCT has been used to obtain a 3D characterization of the microstructure
of the bentonite sample collected form two different sections with a resolution of ~
3.22 μm.
3 samples for each of the 5 positions have been measured
Spent Fuel and
Waste Science and
Technology
In situ heating: how the FEBEX bentonite
responds to dehydration
Worst possible case: ~unconfined heating at
180° C. How the microstructure develops?
Drying-driven fracturing.
Other than the morphometric
characterization, we can calculate the
permeability of the fractures network (Stokes
solver on a cropped cube).
Spent Fuel and
Waste Science and
Technology
FEBEX-DP: Bentonite – Concrete Interface
Characterization (micro-XRF – SNL)
 Main Features
– Compositional map at thin
section (mm) scale – Scanning
at the µm scale
– Sharp compositional changes
at the bentonite-shotcrete
interface
– Consistent spatial correlation
among various elements
across interface
 Ca, K, S, and Si gradients
– Depletion on shotcrete side of
the interface  Leaching?
– Bentonite seems compositional
homogeneous at the interface
– Limited reaction front?
Spent Fuel and
Waste Science and
Technology
ACKNOWLEDGMENTS
Funding for this work was provided by the Spent Fuel and
Waste Science and Technology, Office of Nuclear Energy, of
the U.S. Department of Energy under Contract Number DE-
AC02-05CH11231 with Berkeley Lab.

27a febex dp collaboration overview and related sfwst r and d activities zheng v0 lbnl

  • 1.
    Spent Fuel andWaste Science and Technology FEBEX-DP Collaboration: Overview and related SFWST R&D Activities Liange Zheng, Marco Voltolini, Hao Xu, Jonny Rutqvist, Jens T. Birkholzer LBNL, Berkeley, California 94720, USA Carlos Jove-Colon Sandia National Laboratory Las Vegas, NV. May 23-25, 2017
  • 2.
    Spent Fuel and WasteScience and Technology Overview of FEBEX-DP FEBEX: Full-scale Engineering Barriers EXperiment Mock-up test February 1997– now The full-scale “in situ” test is located in Grimsel, Switzerland, heating started in 1997. In 2002, Dismantling of Heater #1 In 2015, Dismantling of Heater #2
  • 3.
    Spent Fuel and WasteScience and Technology FEBEX–DP: Dismantling of Heater #2  Bentonite characterization – Density, water content and spatial distribution – Chemical changes  Characterization of corrosion and microbial processes – On instruments/sensors and coupons – Bacterial growth – All under evolving redox-conditions  Mineralogical interactions at material interfaces – Concrete - bentonite, heater/liner – bentonite, rock - bentonite – Impact on pore water composition  Integration of the monitoring results and modelling – THM/THMC modelling – Pre- and post dismantling Extensive laboratory tests were carried out to characterize the THMC properties of bentonite, concrete, steel liner and granite
  • 4.
    Spent Fuel and WasteScience and Technology Hot sections Cold sections Hot sections Cold sections FEBEX–DP: Dismantling of Heater #2 THM characterization of bentonite samples
  • 5.
    Spent Fuel and WasteScience and Technology FEBEX–DP: Dismantling of Heater #2 Mineralogy characterization at the concrete-bentonite interface
  • 6.
    Spent Fuel and WasteScience and Technology FEBEX–DP: Dismantling of Heater #2 Characterization of pore water chemistry by aqueous extract and squeezing
  • 7.
    Spent Fuel and WasteScience and Technology SFWST R&D Activities Related to FEBEX-DP Validating coupled THMC model with FEBEX-DP data Analyzing the microscopic structure
  • 8.
    Spent Fuel and WasteScience and Technology Developing the Pre-dismantling THMC Model: the Quasi-final THM model 0 20 40 60 80 100 120 0 2000 4000 6000 8000 Temeperature(oC) Time (day) R = 0.48 m TSE2-01 TSF2-02 TSF2-03 TSF2-04 THMC-LSmodel TH model 0 5 10 15 20 25 30 35 40 0.4 0.6 0.8 1 1.2 Watercontent(%) Radial distance (m) Data 5.3 yrs Data 18.3 yrs Model t=0 THMC-LS, 5.3 yrs THMC-LS, 18.3 yrs TH model 5.3 yrs TH model 18.3 yrs heater granite -1 0 1 2 3 4 5 6 7 0 1000 2000 3000 4000 5000 6000 7000 NormalStress(MPa) Time (day) E2data, r=1.1 m F2 data, r=1.1m THMC-LSRadial THMC-LScircumferential Adding chemistry 0.E+00 5.E-02 1.E-01 2.E-01 2.E-01 3.E-01 3.E-01 4.E-01 0.4 0.6 0.8 1 1.2 1.4 Concentration(mol/L) Radial distance (m) Cl- data S29,5.3 yrs data S19,5.3 yrs data S28,5.3 yrs THC model,5.3 yrs THC model,18.3 yrs THMC-LS5.3 yrs THMC-LS,18.3 yrs
  • 9.
    Spent Fuel and WasteScience and Technology Developing the Pre-dismantling THMC Model: the Final THMC model  Permeability change :  /)57.896.2(log  dk Chemical model: Mineral dissolution/precipitation (calcite, gypsum, smectite, chlorite, quartz, K- feldspar, plagioclase, dolomite, illite, kaolinite, siderite and ankerite); surface prontonation on smectite and cation exchanges  Chemical data are important for calibrating THM model  Key processes needed to reproduce data: vapor diffusion, porosity and permeability change due to swelling, thermal osmosis Two revisions compared with the quasi-final model:  Adding thermal osmosis 0 5 10 15 20 25 30 35 40 0.4 0.6 0.8 1 1.2 Watercontent(%) Radial distance (m) Data 5.3 yrs Data 18.2 yrs Model t=0 THMC-LS,5.3 yrs THMC-LS,18.2 yrs TH model,5.3 yrs TH model,18.2 yrs heater granite 0.E+00 1.E-01 2.E-01 3.E-01 4.E-01 5.E-01 6.E-01 7.E-01 8.E-01 9.E-01 1.E+00 0.4 0.6 0.8 1 1.2 1.4 Concentration(mol/L) Radial distance (m) Cl- data S29,5.3 yrs data S19,5.3 yrs data S28,5.3 yrs THMC-LS,5.3 yrs THMC-LS,18.2 yrs
  • 10.
    Spent Fuel and WasteScience and Technology Testing the Model Predictions of Chemical Results Calibrating aqueous extract data  An “evaporation” model to reverse the chemical processes occurring during aqueous extract:  The minerals phase considered in the model is similar to the THMC model, considering minerals precipitation/dissolution, cation exchange and surface complexation. Distilled water 40 mL 10 g Bentonite sample measured i Chemical analysis of supernatent Mixing for 2 days + Separation by centrifugation Caq for f = 400% Cpore for i = ?? Measuring pore water chemistry using aqueous extract “evaporating” water Known Caq calibrated Cpore f i Used to validate THMC model
  • 11.
    Spent Fuel and WasteScience and Technology Testing the Model Predictions
  • 12.
    Spent Fuel and WasteScience and Technology Testing the Model Predictions Chloride and sodium concentration are reasonably matched  Squeezing data and calibrated aqueous extract data are quite consistent  High Cl concentration is expected near the heater 0.0E+00 2.0E-01 4.0E-01 6.0E-01 8.0E-01 1.0E+00 1.2E+00 0.4 0.6 0.8 1 1.2 1.4 Concentration(mol/L) Radial distance (m) Cl- data S29,S28,S19, 5.3 yrs Sq data,S47, 18.2 yrs data S47,18.2 yrs THMC,5.3 yrs THMC,18.2 yrs 0.E+00 1.E-01 2.E-01 3.E-01 4.E-01 5.E-01 6.E-01 7.E-01 0.4 0.6 0.8 1 1.2 1.4 Concentration(mol/L) Radial distance (m) Na+ data S29,S19,5.3 yrs Sq data,S47, 18.2 yrs data,S47,18.2 yrs THMC,18.2 yrs THMC,5.3 yrs
  • 13.
    Spent Fuel and WasteScience and Technology Testing the Model Predictions Refinement of chemical model are needed to explain the evolution of other species In addition to the dissolution of gypsum, could pyrite oxidation at the early time and sulfate reduction at the later time affect the concentration of sulfate? Interaction with sulfate affects Ca concentration via gypsum dissolution; adjusting initial amount of gypsum might be helpful to fit the data. 0.0E+00 2.0E-02 4.0E-02 6.0E-02 8.0E-02 1.0E-01 1.2E-01 1.4E-01 1.6E-01 0.4 0.6 0.8 1 1.2 1.4 Concentration(mol/L) Radial distance (m) SO42 - data S29,S19, 5.3 yrs Sq data,S47, 18.2 yrs data,S47,18.2 yrs THMC,18.2 yrs THMC,5.3 yrs 0.0E+00 1.0E-02 2.0E-02 3.0E-02 4.0E-02 5.0E-02 6.0E-02 7.0E-02 8.0E-02 9.0E-02 1.0E-01 0.4 0.6 0.8 1 1.2 1.4 Concentration(mol/L) Radial distance (m) Ca+2 data S29,S19, 5.3 yrs Sq data,S47, 18.2 yrs THMC,5.3 yrs THMC,18.2 yrs data, S47, 18.2 yrs
  • 14.
    Spent Fuel and WasteScience and Technology Towards the Final Interpretation of Chemical Data  Corrosion of liner and Fe-bentonite interaction?  Evolution of gases: CO2(g), O2, CH4?  Biochemical reactions?  Cross diffusion?  2-D model with “cold” sections  ….
  • 15.
    Spent Fuel and WasteScience and Technology Characterization of the FEBEX bentonite via Synchrotron X-ray MicroCT SXR-microCT has been used to obtain a 3D characterization of the microstructure of the bentonite sample collected form two different sections with a resolution of ~ 3.22 μm. 3 samples for each of the 5 positions have been measured
  • 16.
    Spent Fuel and WasteScience and Technology In situ heating: how the FEBEX bentonite responds to dehydration Worst possible case: ~unconfined heating at 180° C. How the microstructure develops? Drying-driven fracturing. Other than the morphometric characterization, we can calculate the permeability of the fractures network (Stokes solver on a cropped cube).
  • 17.
    Spent Fuel and WasteScience and Technology FEBEX-DP: Bentonite – Concrete Interface Characterization (micro-XRF – SNL)  Main Features – Compositional map at thin section (mm) scale – Scanning at the µm scale – Sharp compositional changes at the bentonite-shotcrete interface – Consistent spatial correlation among various elements across interface  Ca, K, S, and Si gradients – Depletion on shotcrete side of the interface  Leaching? – Bentonite seems compositional homogeneous at the interface – Limited reaction front?
  • 18.
    Spent Fuel and WasteScience and Technology ACKNOWLEDGMENTS Funding for this work was provided by the Spent Fuel and Waste Science and Technology, Office of Nuclear Energy, of the U.S. Department of Energy under Contract Number DE- AC02-05CH11231 with Berkeley Lab.