SlideShare a Scribd company logo
1 of 24
Download to read offline
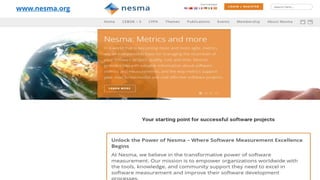
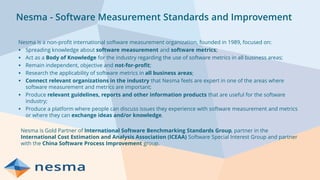
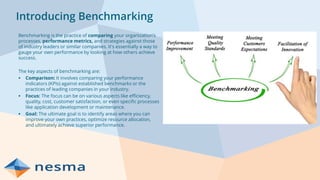
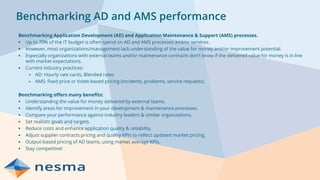
Nesma webinar
2024-04
www.nesma.org
Nesma - Software Measurement Standards and Improvement
Nesma is a non-profit international software measurement organization, founded in 1989, focused on:
▪ Spreading knowledge about software measurement and software metrics;
▪ Act as a Body of Knowledge for the industry regarding the use of software metrics in all business areas;
▪ Remain independent, objective and not-for-profit;
▪ Research the applicability of software metrics in all business areas;
▪ Connect relevant organizations in the industry that Nesma feels are expert in one of the areas where
software measurement and metrics are important;
▪ Produce relevant guidelines, reports and other information products that are useful for the software
industry;
▪ Produce a platform where people can discuss issues they experience with software measurement and metrics
or where they can exchange ideas and/or knowledge.
Nesma is Gold Partner of International Software Benchmarking Standards Group, partner in the
International Cost Estimation and Analysis Association (ICEAA) Software Special Interest Group and partner
with the China Software Process Improvement group.
Introducing me
Harold van Heeringen
▪ >25 years experience in IT, >20 years in software measurement and metrics.
▪ Ex-Sogeti – 17 years – Metrics desk: FPA, metrics, estimation, benchmarking.
▪ IDC Metri – 8 years – Principal Consultant and Practice Lead IT Intelligence services.
▪ ISBSG – Immediate Past President, data collection.
▪ NESMA – President.
▪ SIG ICEAA Software – Board member.
50 years young.
Living in Veendam, the Netherlands.
Married, 3 children.
Passions: playing speed chess, skiing, travelling, fitness, mountain biking, playing padel.
Topics for today
▪ Introducing Benchmarking
▪ Key benefits of Benchmarking.
▪ Typical metrics used in benchmarking.
▪ How to do a benchmark.
▪ Typical results of a benchmark.
▪ Q&A
This webinar is being
recorded! And
uploaded to the
Nesma YouTube
channel
Introducing Benchmarking
Benchmarking is the practice of comparing your organization's
processes, performance metrics, and strategies against those
of industry leaders or similar companies. It's essentially a way to
gauge your own performance by looking at how others achieve
success.
The key aspects of benchmarking are:
▪ Comparison: It involves comparing your performance
indicators (KPIs) against established benchmarks or the
practices of leading companies in your industry.
▪ Focus: The focus can be on various aspects like efficiency,
quality, cost, customer satisfaction, or even specific processes
like application development or maintenance.
▪ Goal: The ultimate goal is to identify areas where you can
improve your own practices, optimize resource allocation,
and ultimately achieve superior performance.
Benchmarking AD and AMS performance
Benchmarking Application Development (AD) and Application Maintenance & Support (AMS) processes.
▪ Up to 70% of the IT budget is often spend on AD and AMS processes and/or services.
▪ However, most organizations/management lack understanding of the value for money and/or improvement potential.
▪ Especially organizations with external teams and/or maintenance contracts don’t know if the delivered value for money is in line
with market expectations.
▪ Current industry practices:
▪ AD: Hourly rate cards, Blended rates
▪ AMS: fixed price or ticket-based pricing (incidents, problems, service requests).
Benchmarking offers many benefits:
▪ Understanding the value for money delivered by external teams.
▪ Identify areas for improvement in your development & maintenance processes.
▪ Compare your performance against industry leaders & similar organizations.
▪ Set realistic goals and targets.
▪ Reduce costs and enhance application quality & reliability.
▪ Adjust supplier contracts pricing and quality KPIs to reflect updated market pricing.
▪ Output-based pricing of AD teams, using market average KPIs.
▪ Stay competitive!
The CIO challenge
Benchmarking Process
Decide on Peer
Group and BM
Scope
Select the Peer Group
Peer Group Selection – Application Development
Choosing the right peer group is crucial for effective application development benchmarking. Here are some key factors to
consider when selecting your peers:
▪ Focus on your specific industry: Benchmarking against companies in your industry provides the most relevant comparison as
they face similar challenges and opportunities. For example, an e-commerce company wouldn't want to benchmark against a
manufacturing plant.
▪ Consider the types of applications you develop: If you build mobile apps, compare yourself to other companies creating
mobile apps. This ensures a more accurate picture of development processes and performance metrics relevant to your
application type.
▪ Match your organization's size: Selecting peers of similar size (number of employees, revenue) creates a fairer comparison.
Large enterprises have different resource allocation and development approaches than smaller startups.
▪ Account for development methodology: If your team uses Agile, compare against other Agile development shops.
Benchmarking against a Waterfall development team might not provide meaningful insights.
▪ Account for development technology: If your team develops in Java, compare the team performance against other teams that
use the same technology.
▪ Align with your strategic goals: If your primary focus is on rapid development and innovation, benchmark against companies
known for their agility. If security and compliance are top priorities, compare yourself to organizations with a strong security
track record.
▪ Access to benchmarking data: Consider the availability of relevant data for your chosen peer group. Industry reports,
research organizations, and even professional networks can be valuable sources of benchmarking data for specific industries
and application types.
AD Benchmark – How? An example!
Initiation
▪ Select the Scope: for instance, a new Development Project or a release of an agile team. For this example, we select a release of
2 sprints (1 calendar month)
▪ Determine the Peer group: for the example an Agile team, financial industry, Java development.
Data Gathering
▪ Gather the user stories that were initiated and completed in this release.
▪ Collect the effort hours spent and the cost of this effort (per function/role).
▪ Collect the defects found in this release.
Data Analysis
▪ To measure the output (value) delivered, use a standard for functional size measurement to objectively size the output.
Especially in agile development, functionality may also be modified or removed from the application during the releases.
Recommended is the Nesma standard: Easy Functional Sizing (to be released soon).
▪ Analyze the effort, cost and defects. If necessary, normalize the data to reflects the actual scope. For instance, if there is effort
in the numbers that should not be there (e.g., training, spike, etc.), remove that effort/cost.
▪ Analyze the defects found, and the impact of the rework of resolving the defects.
▪ Calculate the main benchmark metrics: Project Delivery Rate (PDR: Hours/FP), Cost Efficiency (EUR/USD per FP), Delivery
Speed (FP per month) and Defect Density (Defects/1000 FP).
Data Analysis example
Team Effort % Cost %
Requirements 56 5% 5.880
€ 5%
Design 90 8% 11.200
€ 10%
Development 493 44% 46.816
€ 44%
Test 314 28% 27.910
€ 26%
Implementation 67 6% 6.854
€ 6%
Scrum Master 101 9% 8.770
€ 8%
Total 1.120 100% 107.430
€ 100%
Performance metric Value UoM
Functionality Delivered 124 FP
Defects 21
PDR 9,0 Hours/FP
Cost Efficiency 866
€ EUR/FP
Delivery Speed 124 FP/month
ISBSG: The Gold Standard in Software Benchmarking
The International Software Benchmarking Standards Group (ISBSG ), founded in 1997, is a non-profit organization dedicated to
establishing and promoting industry standards for software development and maintenance benchmarking. They provide a
comprehensive data repository of real-world project metrics from leading organizations worldwide.
Mission: “To improve the management of IT resources by both business and government, through the provision and
exploitation of public repositories of software engineering knowledge that are standardized, verified, recent and
representative of current technologies”
Nesma has been a Gold Partner of ISBSG since its establishment in 1997. This long-standing partnership signifies our deep
commitment to:
▪ Reliable Benchmarking Data: Nesma leverage ISBSG data to allow our members to use the most up-to-date and reliable
industry data for benchmarking, estimation, outsourcing, performance measurement, research and analysis, etc.
▪ Advanced Benchmarking Expertise: Nesma shares extensive knowledge of ISBSG data and methodologies, allowing our
members to deliver insightful analyses and actionable recommendations.
▪ Continuous Improvement: Nesma actively collaborates with ISBSG to contribute to the evolution of software benchmarking
standards and best practices.
Peer Group Selection – ISBSG data
11800+ data points of new development and enhancement projects, releases and sprints.
253 columns with project data attributes.
PDR = hours per FP (inverse of universal concept of Productivity)
Peer Group Selection
Filter the data using criteria:
▪ Data Quality Rating = A or B.
▪ Project Year: >2016
▪ Industry Sector: Finance
▪ Primary Programming Language = Java
▪ Count Approach = Nesma
▪ Development Methodology = Agile Development
This results in a peer group of 43 data points.
The figure shows the distribution of these 43 data points
regarding the descriptive statistics.
Usually, we refer to the P25 as Peer Max (best
productivity), the Median is Peer Average reflecting the
industry average Productivity, and the P75 as Peer Low.
Our example: PDR is Peer Low, therefore there is
significant room to improve the Productivity.
Example
project: 9,0
h/FP
Other Analysis and Benchmark possibilities
Analyze and Benchmark:
▪ Project Delivery Rate Cost Efficiency, Delivery Speed, Defect Density: index!
▪ Benchmark Hourly rates of external parties.
▪ The percentage effort per function/role.
▪ Rework due to Defects
Combine the analysis results. For instance, low productivity can be caused by:
▪ Low percentage of requirements effort resulting in poor requirements quality.
▪ Bad programming practices may result in high defect density, resulting in a lot of
rework.
▪ Idle team members because the product owner has not completed the user
stories in time.
▪ Rework due to high percentage of modified functionality (unclear product
owner).
▪ Slow implementation process resulting in higher than usual implementation
effort.
▪ Etcetera.
The benchmark is the starting point for understanding the reasons why and to
improve and input for the Action Plan.
0
0,2
0,4
0,6
0,8
1
1,2
Productivity
Index
Cost Efficiency
Index
Delivery Speed
Index
Defect Density
Index
Team
Compare teams based on indices
Industry average
(different for each team)
Take Aways
▪ Benchmarking is an important process to understand
your performance against peers.
▪ Application Development is often the most important
value creation function.
▪ The industry is not doing a good job: Hourly Rates
benchmarks and T&M contracts.
▪ Application Development output (functionality
delivered) can be measured using objective ISO
standards for Functional Size Measurement (FSM).
▪ Metrics based on these measurements can be
benchmarked to (ISBSG) industry data.
▪ Organizations that implement these types of metrics
and benchmarks are able to identify high-performing
and low-performing teams.
▪ This knowledge is the starting point to improve, using
an action plan!
Action Plan!
Elevate Your Expertise in Software Measurement & Estimation
Join the Global Community of Nesma Professionals!
• Access a network of experts:
• Learn from experienced practitioners.
• Collaborate on projects and initiatives.
• Gain valuable resources:
• Free Research publications, white papers, case studies.
• Free Standardized measurement methods and guidelines (FPA standard).
• Large discounts on ISBSG data!
• Boost your career:
• Professional development opportunities & certifications.
• Increased industry recognition and credibility.
• Access and contribute to the ICEAA Software SIG.
• Expand your network:
• Connect with potential employers and clients on our free annual physical networking event!
• Contribute to shaping the future of the field.
• Stay informed:
• Gain insights into industry trends and challenge.
• Sign up now: Membership (fee: 125 EUR per Year).
ISBSG data and discounts for Nesma members
Nesma members get discount on ISBSG data subscriptions.
▪ Developments & Enhancements: 11800 data points of new application developments and releases.
▪ Maintenance & Support: 1921 data points of application Maintenance & Support.
▪ Corporate Subscription: All (updates of) the Development & Enhancements data + all the Maintenance & Support data
▪ Data Subscription: Subscription to only D&E or Only the M&S data.
▪ Productivity Query Tool: High-level analysis tool on a subset of the D&E data.
▪ All ISBSG reports are free for Nesma members.
Check for more information here:
https://nesma.org/publications/isbsg-data-and-reports/isbsg-project-data-subscription/
ISBSG offer Non-Member Nesma Member Discount %
ISBSG data subscription 1.830
€ 1.525
€ 305
€ 17%
Corporate subscription 4.575
€ 3.500
€ 1.075
€ 23%
PDQ tool 120
€ -
€ 120
€
Thank you for attending this webinar!
▪
Haroldvanheeringen
Become a Nesma member now! Annual fee is only €125
https://nesma.org/members/registration-form/
Connect with the Nesma community, including
free downloads of all digital products +
free access to a physical member meeting/network event!
large discounts on ISBSG data!
Nesma: http:// www.nesma.org
Harold.van.Heeringen@nesma.org

More Related Content

Similar to 2024-04 - Nesma webinar - Benchmarking.pdf

benchmarking-12517018313111-phpapp01.pdf
benchmarking-12517018313111-phpapp01.pdfbenchmarking-12517018313111-phpapp01.pdf
benchmarking-12517018313111-phpapp01.pdfbehaylu3
 
The Total Economic Impact of SAP Cloud for Sales
The Total Economic Impact of SAP Cloud for SalesThe Total Economic Impact of SAP Cloud for Sales
The Total Economic Impact of SAP Cloud for SalesSAP Customer Experience
 
The value of benchmarking software projects
The value of benchmarking software projectsThe value of benchmarking software projects
The value of benchmarking software projectsHarold van Heeringen
 
Six Sigma Benchmarking
Six Sigma BenchmarkingSix Sigma Benchmarking
Six Sigma Benchmarkingguestbd4baa8
 
WHAT IS BUSINESS ANALYTICS um hj mnjh nit 1 ppt only kjjn
WHAT IS BUSINESS ANALYTICS um hj mnjh nit 1 ppt only kjjnWHAT IS BUSINESS ANALYTICS um hj mnjh nit 1 ppt only kjjn
WHAT IS BUSINESS ANALYTICS um hj mnjh nit 1 ppt only kjjnRohitKumar639388
 
Dynamic Benchmarking For Franchises
Dynamic Benchmarking For FranchisesDynamic Benchmarking For Franchises
Dynamic Benchmarking For FranchisesDynamic Benchmarking
 
it_Define_Service_Desk_Metrics_That_Matter_Storyboard.pptx
it_Define_Service_Desk_Metrics_That_Matter_Storyboard.pptxit_Define_Service_Desk_Metrics_That_Matter_Storyboard.pptx
it_Define_Service_Desk_Metrics_That_Matter_Storyboard.pptxAbdulelah Aljabri
 
Build Or Subscribe For Spm 3
Build Or Subscribe For Spm  3Build Or Subscribe For Spm  3
Build Or Subscribe For Spm 3pstakenas
 
Project delivery standardization framework innovate vancouver
Project delivery standardization framework  innovate vancouverProject delivery standardization framework  innovate vancouver
Project delivery standardization framework innovate vancouverInnovate Vancouver
 
Are Function Points Still Relevant?
Are Function Points Still Relevant?Are Function Points Still Relevant?
Are Function Points Still Relevant?DCG Software Value
 
Are Function Points Still Relevant?
Are Function Points Still Relevant?Are Function Points Still Relevant?
Are Function Points Still Relevant?Premios Group
 
Fail to prepare - Softworld 2011
Fail to prepare -  Softworld 2011Fail to prepare -  Softworld 2011
Fail to prepare - Softworld 2011Sageukofficial
 
Fail to prepare, prepare to fail: implementing ERP and CRM systems
Fail to prepare, prepare to fail: implementing ERP and CRM systemsFail to prepare, prepare to fail: implementing ERP and CRM systems
Fail to prepare, prepare to fail: implementing ERP and CRM systemsSageukofficial
 
Dynamic Benchmarking For Franchises
Dynamic Benchmarking For FranchisesDynamic Benchmarking For Franchises
Dynamic Benchmarking For FranchisesDynamic Benchmarking
 
P4 System Overview
P4 System OverviewP4 System Overview
P4 System Overviewldeutsch
 
P4 System Overview
P4 System OverviewP4 System Overview
P4 System Overviewpegan
 
Vave_Overview_Feb_2016
Vave_Overview_Feb_2016Vave_Overview_Feb_2016
Vave_Overview_Feb_2016Vave Solutions
 

Similar to 2024-04 - Nesma webinar - Benchmarking.pdf (20)

benchmarking-12517018313111-phpapp01.pdf
benchmarking-12517018313111-phpapp01.pdfbenchmarking-12517018313111-phpapp01.pdf
benchmarking-12517018313111-phpapp01.pdf
 
The Total Economic Impact of SAP Cloud for Sales
The Total Economic Impact of SAP Cloud for SalesThe Total Economic Impact of SAP Cloud for Sales
The Total Economic Impact of SAP Cloud for Sales
 
The value of benchmarking software projects
The value of benchmarking software projectsThe value of benchmarking software projects
The value of benchmarking software projects
 
Six Sigma Benchmarking
Six Sigma BenchmarkingSix Sigma Benchmarking
Six Sigma Benchmarking
 
WHAT IS BUSINESS ANALYTICS um hj mnjh nit 1 ppt only kjjn
WHAT IS BUSINESS ANALYTICS um hj mnjh nit 1 ppt only kjjnWHAT IS BUSINESS ANALYTICS um hj mnjh nit 1 ppt only kjjn
WHAT IS BUSINESS ANALYTICS um hj mnjh nit 1 ppt only kjjn
 
Pbd Benchmarking
Pbd BenchmarkingPbd Benchmarking
Pbd Benchmarking
 
Dynamic Benchmarking For Franchises
Dynamic Benchmarking For FranchisesDynamic Benchmarking For Franchises
Dynamic Benchmarking For Franchises
 
it_Define_Service_Desk_Metrics_That_Matter_Storyboard.pptx
it_Define_Service_Desk_Metrics_That_Matter_Storyboard.pptxit_Define_Service_Desk_Metrics_That_Matter_Storyboard.pptx
it_Define_Service_Desk_Metrics_That_Matter_Storyboard.pptx
 
Sangi krishna A S
Sangi krishna A SSangi krishna A S
Sangi krishna A S
 
Build Or Subscribe For Spm 3
Build Or Subscribe For Spm  3Build Or Subscribe For Spm  3
Build Or Subscribe For Spm 3
 
Project delivery standardization framework innovate vancouver
Project delivery standardization framework  innovate vancouverProject delivery standardization framework  innovate vancouver
Project delivery standardization framework innovate vancouver
 
Are Function Points Still Relevant?
Are Function Points Still Relevant?Are Function Points Still Relevant?
Are Function Points Still Relevant?
 
Are Function Points Still Relevant?
Are Function Points Still Relevant?Are Function Points Still Relevant?
Are Function Points Still Relevant?
 
Fail to prepare - Softworld 2011
Fail to prepare -  Softworld 2011Fail to prepare -  Softworld 2011
Fail to prepare - Softworld 2011
 
Fail to prepare, prepare to fail: implementing ERP and CRM systems
Fail to prepare, prepare to fail: implementing ERP and CRM systemsFail to prepare, prepare to fail: implementing ERP and CRM systems
Fail to prepare, prepare to fail: implementing ERP and CRM systems
 
Dynamic Benchmarking For Franchises
Dynamic Benchmarking For FranchisesDynamic Benchmarking For Franchises
Dynamic Benchmarking For Franchises
 
P4 System Overview
P4 System OverviewP4 System Overview
P4 System Overview
 
P4 System Overview
P4 System OverviewP4 System Overview
P4 System Overview
 
Vave_Overview_Feb_2016
Vave_Overview_Feb_2016Vave_Overview_Feb_2016
Vave_Overview_Feb_2016
 
Vave_Overview_Feb_2016
Vave_Overview_Feb_2016Vave_Overview_Feb_2016
Vave_Overview_Feb_2016
 

More from Nesma

Software Cost Estimation webinar January 2024.pdf
Software Cost Estimation webinar January 2024.pdfSoftware Cost Estimation webinar January 2024.pdf
Software Cost Estimation webinar January 2024.pdfNesma
 
Nesma event June '23 - How to use objective metrics as a basis for agile cost...
Nesma event June '23 - How to use objective metrics as a basis for agile cost...Nesma event June '23 - How to use objective metrics as a basis for agile cost...
Nesma event June '23 - How to use objective metrics as a basis for agile cost...Nesma
 
Nesma event June '23 - NEN Practice Guideline - NPR.pdf
Nesma event June '23 - NEN Practice Guideline - NPR.pdfNesma event June '23 - NEN Practice Guideline - NPR.pdf
Nesma event June '23 - NEN Practice Guideline - NPR.pdfNesma
 
Nesma event June '23 - Easy Function Sizing - Introduction.pdf
Nesma event June '23 - Easy Function Sizing - Introduction.pdfNesma event June '23 - Easy Function Sizing - Introduction.pdf
Nesma event June '23 - Easy Function Sizing - Introduction.pdfNesma
 
Automotive Software Cost Estimation - The UCE Approach - Emmanuel Mary
Automotive Software Cost Estimation - The UCE Approach - Emmanuel MaryAutomotive Software Cost Estimation - The UCE Approach - Emmanuel Mary
Automotive Software Cost Estimation - The UCE Approach - Emmanuel MaryNesma
 
The COSMIC battle between David and Goliath - Paul Hussein
The COSMIC battle between David and Goliath - Paul HusseinThe COSMIC battle between David and Goliath - Paul Hussein
The COSMIC battle between David and Goliath - Paul HusseinNesma
 
Succesful Estimating - It's how you tell the story - Amritpal Singh Agar
Succesful Estimating - It's how you tell the story - Amritpal Singh AgarSuccesful Estimating - It's how you tell the story - Amritpal Singh Agar
Succesful Estimating - It's how you tell the story - Amritpal Singh AgarNesma
 
(Increasing) Predictability of large Government ICT Projects - Koos Veefkind
(Increasing) Predictability of large Government ICT Projects - Koos Veefkind(Increasing) Predictability of large Government ICT Projects - Koos Veefkind
(Increasing) Predictability of large Government ICT Projects - Koos VeefkindNesma
 
CEBoK for Software Past Present Future - Megan Jones
CEBoK for Software Past Present Future - Megan JonesCEBoK for Software Past Present Future - Megan Jones
CEBoK for Software Past Present Future - Megan JonesNesma
 
Agile Development and Agile Cost Estimation - A return to basic principles - ...
Agile Development and Agile Cost Estimation - A return to basic principles - ...Agile Development and Agile Cost Estimation - A return to basic principles - ...
Agile Development and Agile Cost Estimation - A return to basic principles - ...Nesma
 
Resolving Cost Management and Key Pitfalls of Agile Software Development - Da...
Resolving Cost Management and Key Pitfalls of Agile Software Development - Da...Resolving Cost Management and Key Pitfalls of Agile Software Development - Da...
Resolving Cost Management and Key Pitfalls of Agile Software Development - Da...Nesma
 
Project Succes is a Choice - Joop Schefferlie
Project Succes is a Choice - Joop SchefferlieProject Succes is a Choice - Joop Schefferlie
Project Succes is a Choice - Joop SchefferlieNesma
 
Afrekenen met functiepunten
Afrekenen met functiepuntenAfrekenen met functiepunten
Afrekenen met functiepuntenNesma
 
Agile teams get a grip - martijn groenewegen
Agile teams   get a grip - martijn groenewegenAgile teams   get a grip - martijn groenewegen
Agile teams get a grip - martijn groenewegenNesma
 
The fact that your poject is agile is not (necessarily) a cost driver arlen...
The fact that your poject is agile is not (necessarily) a cost driver   arlen...The fact that your poject is agile is not (necessarily) a cost driver   arlen...
The fact that your poject is agile is not (necessarily) a cost driver arlen...Nesma
 
Software sizing as an essential measure past present and future - Dan Galorat...
Software sizing as an essential measure past present and future - Dan Galorat...Software sizing as an essential measure past present and future - Dan Galorat...
Software sizing as an essential measure past present and future - Dan Galorat...Nesma
 
A benchmark based approach to determine language verbosity - Hans Kuijpers - ...
A benchmark based approach to determine language verbosity - Hans Kuijpers - ...A benchmark based approach to determine language verbosity - Hans Kuijpers - ...
A benchmark based approach to determine language verbosity - Hans Kuijpers - ...Nesma
 
Software sizing the cornerstone for iceaa's scebok - Carol Dekkers
Software sizing the cornerstone for iceaa's scebok - Carol DekkersSoftware sizing the cornerstone for iceaa's scebok - Carol Dekkers
Software sizing the cornerstone for iceaa's scebok - Carol DekkersNesma
 
Size matters a lot rick collins - technomics
Size matters a lot   rick collins - technomicsSize matters a lot   rick collins - technomics
Size matters a lot rick collins - technomicsNesma
 
Software estimation challenge diederik wortman - metri
Software estimation challenge   diederik wortman - metriSoftware estimation challenge   diederik wortman - metri
Software estimation challenge diederik wortman - metriNesma
 

More from Nesma (20)

Software Cost Estimation webinar January 2024.pdf
Software Cost Estimation webinar January 2024.pdfSoftware Cost Estimation webinar January 2024.pdf
Software Cost Estimation webinar January 2024.pdf
 
Nesma event June '23 - How to use objective metrics as a basis for agile cost...
Nesma event June '23 - How to use objective metrics as a basis for agile cost...Nesma event June '23 - How to use objective metrics as a basis for agile cost...
Nesma event June '23 - How to use objective metrics as a basis for agile cost...
 
Nesma event June '23 - NEN Practice Guideline - NPR.pdf
Nesma event June '23 - NEN Practice Guideline - NPR.pdfNesma event June '23 - NEN Practice Guideline - NPR.pdf
Nesma event June '23 - NEN Practice Guideline - NPR.pdf
 
Nesma event June '23 - Easy Function Sizing - Introduction.pdf
Nesma event June '23 - Easy Function Sizing - Introduction.pdfNesma event June '23 - Easy Function Sizing - Introduction.pdf
Nesma event June '23 - Easy Function Sizing - Introduction.pdf
 
Automotive Software Cost Estimation - The UCE Approach - Emmanuel Mary
Automotive Software Cost Estimation - The UCE Approach - Emmanuel MaryAutomotive Software Cost Estimation - The UCE Approach - Emmanuel Mary
Automotive Software Cost Estimation - The UCE Approach - Emmanuel Mary
 
The COSMIC battle between David and Goliath - Paul Hussein
The COSMIC battle between David and Goliath - Paul HusseinThe COSMIC battle between David and Goliath - Paul Hussein
The COSMIC battle between David and Goliath - Paul Hussein
 
Succesful Estimating - It's how you tell the story - Amritpal Singh Agar
Succesful Estimating - It's how you tell the story - Amritpal Singh AgarSuccesful Estimating - It's how you tell the story - Amritpal Singh Agar
Succesful Estimating - It's how you tell the story - Amritpal Singh Agar
 
(Increasing) Predictability of large Government ICT Projects - Koos Veefkind
(Increasing) Predictability of large Government ICT Projects - Koos Veefkind(Increasing) Predictability of large Government ICT Projects - Koos Veefkind
(Increasing) Predictability of large Government ICT Projects - Koos Veefkind
 
CEBoK for Software Past Present Future - Megan Jones
CEBoK for Software Past Present Future - Megan JonesCEBoK for Software Past Present Future - Megan Jones
CEBoK for Software Past Present Future - Megan Jones
 
Agile Development and Agile Cost Estimation - A return to basic principles - ...
Agile Development and Agile Cost Estimation - A return to basic principles - ...Agile Development and Agile Cost Estimation - A return to basic principles - ...
Agile Development and Agile Cost Estimation - A return to basic principles - ...
 
Resolving Cost Management and Key Pitfalls of Agile Software Development - Da...
Resolving Cost Management and Key Pitfalls of Agile Software Development - Da...Resolving Cost Management and Key Pitfalls of Agile Software Development - Da...
Resolving Cost Management and Key Pitfalls of Agile Software Development - Da...
 
Project Succes is a Choice - Joop Schefferlie
Project Succes is a Choice - Joop SchefferlieProject Succes is a Choice - Joop Schefferlie
Project Succes is a Choice - Joop Schefferlie
 
Afrekenen met functiepunten
Afrekenen met functiepuntenAfrekenen met functiepunten
Afrekenen met functiepunten
 
Agile teams get a grip - martijn groenewegen
Agile teams   get a grip - martijn groenewegenAgile teams   get a grip - martijn groenewegen
Agile teams get a grip - martijn groenewegen
 
The fact that your poject is agile is not (necessarily) a cost driver arlen...
The fact that your poject is agile is not (necessarily) a cost driver   arlen...The fact that your poject is agile is not (necessarily) a cost driver   arlen...
The fact that your poject is agile is not (necessarily) a cost driver arlen...
 
Software sizing as an essential measure past present and future - Dan Galorat...
Software sizing as an essential measure past present and future - Dan Galorat...Software sizing as an essential measure past present and future - Dan Galorat...
Software sizing as an essential measure past present and future - Dan Galorat...
 
A benchmark based approach to determine language verbosity - Hans Kuijpers - ...
A benchmark based approach to determine language verbosity - Hans Kuijpers - ...A benchmark based approach to determine language verbosity - Hans Kuijpers - ...
A benchmark based approach to determine language verbosity - Hans Kuijpers - ...
 
Software sizing the cornerstone for iceaa's scebok - Carol Dekkers
Software sizing the cornerstone for iceaa's scebok - Carol DekkersSoftware sizing the cornerstone for iceaa's scebok - Carol Dekkers
Software sizing the cornerstone for iceaa's scebok - Carol Dekkers
 
Size matters a lot rick collins - technomics
Size matters a lot   rick collins - technomicsSize matters a lot   rick collins - technomics
Size matters a lot rick collins - technomics
 
Software estimation challenge diederik wortman - metri
Software estimation challenge   diederik wortman - metriSoftware estimation challenge   diederik wortman - metri
Software estimation challenge diederik wortman - metri
 

Recently uploaded

SOCIAL AND HISTORICAL CONTEXT - LFTVD.pptx
SOCIAL AND HISTORICAL CONTEXT - LFTVD.pptxSOCIAL AND HISTORICAL CONTEXT - LFTVD.pptx
SOCIAL AND HISTORICAL CONTEXT - LFTVD.pptxiammrhaywood
 
Kisan Call Centre - To harness potential of ICT in Agriculture by answer farm...
Kisan Call Centre - To harness potential of ICT in Agriculture by answer farm...Kisan Call Centre - To harness potential of ICT in Agriculture by answer farm...
Kisan Call Centre - To harness potential of ICT in Agriculture by answer farm...Krashi Coaching
 
Presiding Officer Training module 2024 lok sabha elections
Presiding Officer Training module 2024 lok sabha electionsPresiding Officer Training module 2024 lok sabha elections
Presiding Officer Training module 2024 lok sabha electionsanshu789521
 
Mastering the Unannounced Regulatory Inspection
Mastering the Unannounced Regulatory InspectionMastering the Unannounced Regulatory Inspection
Mastering the Unannounced Regulatory InspectionSafetyChain Software
 
PSYCHIATRIC History collection FORMAT.pptx
PSYCHIATRIC   History collection FORMAT.pptxPSYCHIATRIC   History collection FORMAT.pptx
PSYCHIATRIC History collection FORMAT.pptxPoojaSen20
 
Q4-W6-Restating Informational Text Grade 3
Q4-W6-Restating Informational Text Grade 3Q4-W6-Restating Informational Text Grade 3
Q4-W6-Restating Informational Text Grade 3JemimahLaneBuaron
 
Sanyam Choudhary Chemistry practical.pdf
Sanyam Choudhary Chemistry practical.pdfSanyam Choudhary Chemistry practical.pdf
Sanyam Choudhary Chemistry practical.pdfsanyamsingh5019
 
Micromeritics - Fundamental and Derived Properties of Powders
Micromeritics - Fundamental and Derived Properties of PowdersMicromeritics - Fundamental and Derived Properties of Powders
Micromeritics - Fundamental and Derived Properties of PowdersChitralekhaTherkar
 
microwave assisted reaction. General introduction
microwave assisted reaction. General introductionmicrowave assisted reaction. General introduction
microwave assisted reaction. General introductionMaksud Ahmed
 
Grant Readiness 101 TechSoup and Remy Consulting
Grant Readiness 101 TechSoup and Remy ConsultingGrant Readiness 101 TechSoup and Remy Consulting
Grant Readiness 101 TechSoup and Remy ConsultingTechSoup
 
Arihant handbook biology for class 11 .pdf
Arihant handbook biology for class 11 .pdfArihant handbook biology for class 11 .pdf
Arihant handbook biology for class 11 .pdfchloefrazer622
 
Industrial Policy - 1948, 1956, 1973, 1977, 1980, 1991
Industrial Policy - 1948, 1956, 1973, 1977, 1980, 1991Industrial Policy - 1948, 1956, 1973, 1977, 1980, 1991
Industrial Policy - 1948, 1956, 1973, 1977, 1980, 1991RKavithamani
 
_Math 4-Q4 Week 5.pptx Steps in Collecting Data
_Math 4-Q4 Week 5.pptx Steps in Collecting Data_Math 4-Q4 Week 5.pptx Steps in Collecting Data
_Math 4-Q4 Week 5.pptx Steps in Collecting DataJhengPantaleon
 
URLs and Routing in the Odoo 17 Website App
URLs and Routing in the Odoo 17 Website AppURLs and Routing in the Odoo 17 Website App
URLs and Routing in the Odoo 17 Website AppCeline George
 
Organic Name Reactions for the students and aspirants of Chemistry12th.pptx
Organic Name Reactions  for the students and aspirants of Chemistry12th.pptxOrganic Name Reactions  for the students and aspirants of Chemistry12th.pptx
Organic Name Reactions for the students and aspirants of Chemistry12th.pptxVS Mahajan Coaching Centre
 
mini mental status format.docx
mini    mental       status     format.docxmini    mental       status     format.docx
mini mental status format.docxPoojaSen20
 
18-04-UA_REPORT_MEDIALITERAСY_INDEX-DM_23-1-final-eng.pdf
18-04-UA_REPORT_MEDIALITERAСY_INDEX-DM_23-1-final-eng.pdf18-04-UA_REPORT_MEDIALITERAСY_INDEX-DM_23-1-final-eng.pdf
18-04-UA_REPORT_MEDIALITERAСY_INDEX-DM_23-1-final-eng.pdfssuser54595a
 
Presentation by Andreas Schleicher Tackling the School Absenteeism Crisis 30 ...
Presentation by Andreas Schleicher Tackling the School Absenteeism Crisis 30 ...Presentation by Andreas Schleicher Tackling the School Absenteeism Crisis 30 ...
Presentation by Andreas Schleicher Tackling the School Absenteeism Crisis 30 ...EduSkills OECD
 
Hybridoma Technology ( Production , Purification , and Application )
Hybridoma Technology  ( Production , Purification , and Application  ) Hybridoma Technology  ( Production , Purification , and Application  )
Hybridoma Technology ( Production , Purification , and Application ) Sakshi Ghasle
 

Recently uploaded (20)

Código Creativo y Arte de Software | Unidad 1
Código Creativo y Arte de Software | Unidad 1Código Creativo y Arte de Software | Unidad 1
Código Creativo y Arte de Software | Unidad 1
 
SOCIAL AND HISTORICAL CONTEXT - LFTVD.pptx
SOCIAL AND HISTORICAL CONTEXT - LFTVD.pptxSOCIAL AND HISTORICAL CONTEXT - LFTVD.pptx
SOCIAL AND HISTORICAL CONTEXT - LFTVD.pptx
 
Kisan Call Centre - To harness potential of ICT in Agriculture by answer farm...
Kisan Call Centre - To harness potential of ICT in Agriculture by answer farm...Kisan Call Centre - To harness potential of ICT in Agriculture by answer farm...
Kisan Call Centre - To harness potential of ICT in Agriculture by answer farm...
 
Presiding Officer Training module 2024 lok sabha elections
Presiding Officer Training module 2024 lok sabha electionsPresiding Officer Training module 2024 lok sabha elections
Presiding Officer Training module 2024 lok sabha elections
 
Mastering the Unannounced Regulatory Inspection
Mastering the Unannounced Regulatory InspectionMastering the Unannounced Regulatory Inspection
Mastering the Unannounced Regulatory Inspection
 
PSYCHIATRIC History collection FORMAT.pptx
PSYCHIATRIC   History collection FORMAT.pptxPSYCHIATRIC   History collection FORMAT.pptx
PSYCHIATRIC History collection FORMAT.pptx
 
Q4-W6-Restating Informational Text Grade 3
Q4-W6-Restating Informational Text Grade 3Q4-W6-Restating Informational Text Grade 3
Q4-W6-Restating Informational Text Grade 3
 
Sanyam Choudhary Chemistry practical.pdf
Sanyam Choudhary Chemistry practical.pdfSanyam Choudhary Chemistry practical.pdf
Sanyam Choudhary Chemistry practical.pdf
 
Micromeritics - Fundamental and Derived Properties of Powders
Micromeritics - Fundamental and Derived Properties of PowdersMicromeritics - Fundamental and Derived Properties of Powders
Micromeritics - Fundamental and Derived Properties of Powders
 
microwave assisted reaction. General introduction
microwave assisted reaction. General introductionmicrowave assisted reaction. General introduction
microwave assisted reaction. General introduction
 
Grant Readiness 101 TechSoup and Remy Consulting
Grant Readiness 101 TechSoup and Remy ConsultingGrant Readiness 101 TechSoup and Remy Consulting
Grant Readiness 101 TechSoup and Remy Consulting
 
Arihant handbook biology for class 11 .pdf
Arihant handbook biology for class 11 .pdfArihant handbook biology for class 11 .pdf
Arihant handbook biology for class 11 .pdf
 
Industrial Policy - 1948, 1956, 1973, 1977, 1980, 1991
Industrial Policy - 1948, 1956, 1973, 1977, 1980, 1991Industrial Policy - 1948, 1956, 1973, 1977, 1980, 1991
Industrial Policy - 1948, 1956, 1973, 1977, 1980, 1991
 
_Math 4-Q4 Week 5.pptx Steps in Collecting Data
_Math 4-Q4 Week 5.pptx Steps in Collecting Data_Math 4-Q4 Week 5.pptx Steps in Collecting Data
_Math 4-Q4 Week 5.pptx Steps in Collecting Data
 
URLs and Routing in the Odoo 17 Website App
URLs and Routing in the Odoo 17 Website AppURLs and Routing in the Odoo 17 Website App
URLs and Routing in the Odoo 17 Website App
 
Organic Name Reactions for the students and aspirants of Chemistry12th.pptx
Organic Name Reactions  for the students and aspirants of Chemistry12th.pptxOrganic Name Reactions  for the students and aspirants of Chemistry12th.pptx
Organic Name Reactions for the students and aspirants of Chemistry12th.pptx
 
mini mental status format.docx
mini    mental       status     format.docxmini    mental       status     format.docx
mini mental status format.docx
 
18-04-UA_REPORT_MEDIALITERAСY_INDEX-DM_23-1-final-eng.pdf
18-04-UA_REPORT_MEDIALITERAСY_INDEX-DM_23-1-final-eng.pdf18-04-UA_REPORT_MEDIALITERAСY_INDEX-DM_23-1-final-eng.pdf
18-04-UA_REPORT_MEDIALITERAСY_INDEX-DM_23-1-final-eng.pdf
 
Presentation by Andreas Schleicher Tackling the School Absenteeism Crisis 30 ...
Presentation by Andreas Schleicher Tackling the School Absenteeism Crisis 30 ...Presentation by Andreas Schleicher Tackling the School Absenteeism Crisis 30 ...
Presentation by Andreas Schleicher Tackling the School Absenteeism Crisis 30 ...
 
Hybridoma Technology ( Production , Purification , and Application )
Hybridoma Technology  ( Production , Purification , and Application  ) Hybridoma Technology  ( Production , Purification , and Application  )
Hybridoma Technology ( Production , Purification , and Application )
 

2024-04 - Nesma webinar - Benchmarking.pdf

  • 3. Nesma - Software Measurement Standards and Improvement Nesma is a non-profit international software measurement organization, founded in 1989, focused on: ▪ Spreading knowledge about software measurement and software metrics; ▪ Act as a Body of Knowledge for the industry regarding the use of software metrics in all business areas; ▪ Remain independent, objective and not-for-profit; ▪ Research the applicability of software metrics in all business areas; ▪ Connect relevant organizations in the industry that Nesma feels are expert in one of the areas where software measurement and metrics are important; ▪ Produce relevant guidelines, reports and other information products that are useful for the software industry; ▪ Produce a platform where people can discuss issues they experience with software measurement and metrics or where they can exchange ideas and/or knowledge. Nesma is Gold Partner of International Software Benchmarking Standards Group, partner in the International Cost Estimation and Analysis Association (ICEAA) Software Special Interest Group and partner with the China Software Process Improvement group.
  • 4. Introducing me Harold van Heeringen ▪ >25 years experience in IT, >20 years in software measurement and metrics. ▪ Ex-Sogeti – 17 years – Metrics desk: FPA, metrics, estimation, benchmarking. ▪ IDC Metri – 8 years – Principal Consultant and Practice Lead IT Intelligence services. ▪ ISBSG – Immediate Past President, data collection. ▪ NESMA – President. ▪ SIG ICEAA Software – Board member. 50 years young. Living in Veendam, the Netherlands. Married, 3 children. Passions: playing speed chess, skiing, travelling, fitness, mountain biking, playing padel.
  • 5. Topics for today ▪ Introducing Benchmarking ▪ Key benefits of Benchmarking. ▪ Typical metrics used in benchmarking. ▪ How to do a benchmark. ▪ Typical results of a benchmark. ▪ Q&A This webinar is being recorded! And uploaded to the Nesma YouTube channel
  • 6. Introducing Benchmarking Benchmarking is the practice of comparing your organization's processes, performance metrics, and strategies against those of industry leaders or similar companies. It's essentially a way to gauge your own performance by looking at how others achieve success. The key aspects of benchmarking are: ▪ Comparison: It involves comparing your performance indicators (KPIs) against established benchmarks or the practices of leading companies in your industry. ▪ Focus: The focus can be on various aspects like efficiency, quality, cost, customer satisfaction, or even specific processes like application development or maintenance. ▪ Goal: The ultimate goal is to identify areas where you can improve your own practices, optimize resource allocation, and ultimately achieve superior performance.
  • 7. Benchmarking AD and AMS performance Benchmarking Application Development (AD) and Application Maintenance & Support (AMS) processes. ▪ Up to 70% of the IT budget is often spend on AD and AMS processes and/or services. ▪ However, most organizations/management lack understanding of the value for money and/or improvement potential. ▪ Especially organizations with external teams and/or maintenance contracts don’t know if the delivered value for money is in line with market expectations. ▪ Current industry practices: ▪ AD: Hourly rate cards, Blended rates ▪ AMS: fixed price or ticket-based pricing (incidents, problems, service requests). Benchmarking offers many benefits: ▪ Understanding the value for money delivered by external teams. ▪ Identify areas for improvement in your development & maintenance processes. ▪ Compare your performance against industry leaders & similar organizations. ▪ Set realistic goals and targets. ▪ Reduce costs and enhance application quality & reliability. ▪ Adjust supplier contracts pricing and quality KPIs to reflect updated market pricing. ▪ Output-based pricing of AD teams, using market average KPIs. ▪ Stay competitive!
  • 9. Benchmarking Process Decide on Peer Group and BM Scope
  • 11. Peer Group Selection – Application Development Choosing the right peer group is crucial for effective application development benchmarking. Here are some key factors to consider when selecting your peers: ▪ Focus on your specific industry: Benchmarking against companies in your industry provides the most relevant comparison as they face similar challenges and opportunities. For example, an e-commerce company wouldn't want to benchmark against a manufacturing plant. ▪ Consider the types of applications you develop: If you build mobile apps, compare yourself to other companies creating mobile apps. This ensures a more accurate picture of development processes and performance metrics relevant to your application type. ▪ Match your organization's size: Selecting peers of similar size (number of employees, revenue) creates a fairer comparison. Large enterprises have different resource allocation and development approaches than smaller startups. ▪ Account for development methodology: If your team uses Agile, compare against other Agile development shops. Benchmarking against a Waterfall development team might not provide meaningful insights. ▪ Account for development technology: If your team develops in Java, compare the team performance against other teams that use the same technology. ▪ Align with your strategic goals: If your primary focus is on rapid development and innovation, benchmark against companies known for their agility. If security and compliance are top priorities, compare yourself to organizations with a strong security track record. ▪ Access to benchmarking data: Consider the availability of relevant data for your chosen peer group. Industry reports, research organizations, and even professional networks can be valuable sources of benchmarking data for specific industries and application types.
  • 12. AD Benchmark – How? An example! Initiation ▪ Select the Scope: for instance, a new Development Project or a release of an agile team. For this example, we select a release of 2 sprints (1 calendar month) ▪ Determine the Peer group: for the example an Agile team, financial industry, Java development. Data Gathering ▪ Gather the user stories that were initiated and completed in this release. ▪ Collect the effort hours spent and the cost of this effort (per function/role). ▪ Collect the defects found in this release. Data Analysis ▪ To measure the output (value) delivered, use a standard for functional size measurement to objectively size the output. Especially in agile development, functionality may also be modified or removed from the application during the releases. Recommended is the Nesma standard: Easy Functional Sizing (to be released soon). ▪ Analyze the effort, cost and defects. If necessary, normalize the data to reflects the actual scope. For instance, if there is effort in the numbers that should not be there (e.g., training, spike, etc.), remove that effort/cost. ▪ Analyze the defects found, and the impact of the rework of resolving the defects. ▪ Calculate the main benchmark metrics: Project Delivery Rate (PDR: Hours/FP), Cost Efficiency (EUR/USD per FP), Delivery Speed (FP per month) and Defect Density (Defects/1000 FP).
  • 13. Data Analysis example Team Effort % Cost % Requirements 56 5% 5.880 € 5% Design 90 8% 11.200 € 10% Development 493 44% 46.816 € 44% Test 314 28% 27.910 € 26% Implementation 67 6% 6.854 € 6% Scrum Master 101 9% 8.770 € 8% Total 1.120 100% 107.430 € 100% Performance metric Value UoM Functionality Delivered 124 FP Defects 21 PDR 9,0 Hours/FP Cost Efficiency 866 € EUR/FP Delivery Speed 124 FP/month
  • 14. ISBSG: The Gold Standard in Software Benchmarking The International Software Benchmarking Standards Group (ISBSG ), founded in 1997, is a non-profit organization dedicated to establishing and promoting industry standards for software development and maintenance benchmarking. They provide a comprehensive data repository of real-world project metrics from leading organizations worldwide. Mission: “To improve the management of IT resources by both business and government, through the provision and exploitation of public repositories of software engineering knowledge that are standardized, verified, recent and representative of current technologies” Nesma has been a Gold Partner of ISBSG since its establishment in 1997. This long-standing partnership signifies our deep commitment to: ▪ Reliable Benchmarking Data: Nesma leverage ISBSG data to allow our members to use the most up-to-date and reliable industry data for benchmarking, estimation, outsourcing, performance measurement, research and analysis, etc. ▪ Advanced Benchmarking Expertise: Nesma shares extensive knowledge of ISBSG data and methodologies, allowing our members to deliver insightful analyses and actionable recommendations. ▪ Continuous Improvement: Nesma actively collaborates with ISBSG to contribute to the evolution of software benchmarking standards and best practices.
  • 15. Peer Group Selection – ISBSG data 11800+ data points of new development and enhancement projects, releases and sprints. 253 columns with project data attributes. PDR = hours per FP (inverse of universal concept of Productivity)
  • 16. Peer Group Selection Filter the data using criteria: ▪ Data Quality Rating = A or B. ▪ Project Year: >2016 ▪ Industry Sector: Finance ▪ Primary Programming Language = Java ▪ Count Approach = Nesma ▪ Development Methodology = Agile Development This results in a peer group of 43 data points. The figure shows the distribution of these 43 data points regarding the descriptive statistics. Usually, we refer to the P25 as Peer Max (best productivity), the Median is Peer Average reflecting the industry average Productivity, and the P75 as Peer Low. Our example: PDR is Peer Low, therefore there is significant room to improve the Productivity. Example project: 9,0 h/FP
  • 17. Other Analysis and Benchmark possibilities Analyze and Benchmark: ▪ Project Delivery Rate Cost Efficiency, Delivery Speed, Defect Density: index! ▪ Benchmark Hourly rates of external parties. ▪ The percentage effort per function/role. ▪ Rework due to Defects Combine the analysis results. For instance, low productivity can be caused by: ▪ Low percentage of requirements effort resulting in poor requirements quality. ▪ Bad programming practices may result in high defect density, resulting in a lot of rework. ▪ Idle team members because the product owner has not completed the user stories in time. ▪ Rework due to high percentage of modified functionality (unclear product owner). ▪ Slow implementation process resulting in higher than usual implementation effort. ▪ Etcetera. The benchmark is the starting point for understanding the reasons why and to improve and input for the Action Plan. 0 0,2 0,4 0,6 0,8 1 1,2 Productivity Index Cost Efficiency Index Delivery Speed Index Defect Density Index Team
  • 18. Compare teams based on indices Industry average (different for each team)
  • 19. Take Aways ▪ Benchmarking is an important process to understand your performance against peers. ▪ Application Development is often the most important value creation function. ▪ The industry is not doing a good job: Hourly Rates benchmarks and T&M contracts. ▪ Application Development output (functionality delivered) can be measured using objective ISO standards for Functional Size Measurement (FSM). ▪ Metrics based on these measurements can be benchmarked to (ISBSG) industry data. ▪ Organizations that implement these types of metrics and benchmarks are able to identify high-performing and low-performing teams. ▪ This knowledge is the starting point to improve, using an action plan!
  • 20.
  • 22. Elevate Your Expertise in Software Measurement & Estimation Join the Global Community of Nesma Professionals! • Access a network of experts: • Learn from experienced practitioners. • Collaborate on projects and initiatives. • Gain valuable resources: • Free Research publications, white papers, case studies. • Free Standardized measurement methods and guidelines (FPA standard). • Large discounts on ISBSG data! • Boost your career: • Professional development opportunities & certifications. • Increased industry recognition and credibility. • Access and contribute to the ICEAA Software SIG. • Expand your network: • Connect with potential employers and clients on our free annual physical networking event! • Contribute to shaping the future of the field. • Stay informed: • Gain insights into industry trends and challenge. • Sign up now: Membership (fee: 125 EUR per Year).
  • 23. ISBSG data and discounts for Nesma members Nesma members get discount on ISBSG data subscriptions. ▪ Developments & Enhancements: 11800 data points of new application developments and releases. ▪ Maintenance & Support: 1921 data points of application Maintenance & Support. ▪ Corporate Subscription: All (updates of) the Development & Enhancements data + all the Maintenance & Support data ▪ Data Subscription: Subscription to only D&E or Only the M&S data. ▪ Productivity Query Tool: High-level analysis tool on a subset of the D&E data. ▪ All ISBSG reports are free for Nesma members. Check for more information here: https://nesma.org/publications/isbsg-data-and-reports/isbsg-project-data-subscription/ ISBSG offer Non-Member Nesma Member Discount % ISBSG data subscription 1.830 € 1.525 € 305 € 17% Corporate subscription 4.575 € 3.500 € 1.075 € 23% PDQ tool 120 € - € 120 €
  • 24. Thank you for attending this webinar! ▪ Haroldvanheeringen Become a Nesma member now! Annual fee is only €125 https://nesma.org/members/registration-form/ Connect with the Nesma community, including free downloads of all digital products + free access to a physical member meeting/network event! large discounts on ISBSG data! Nesma: http:// www.nesma.org Harold.van.Heeringen@nesma.org