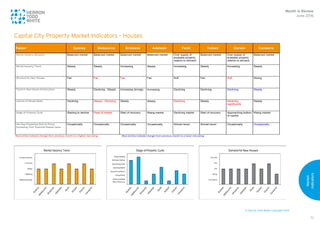
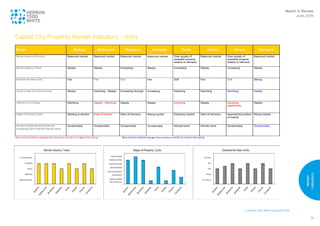
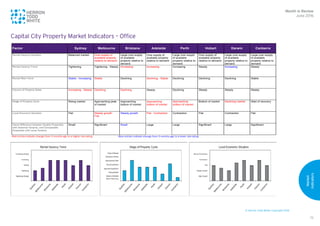
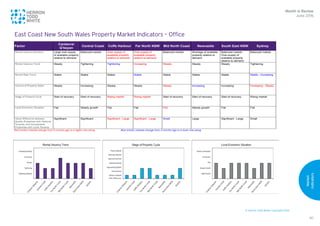
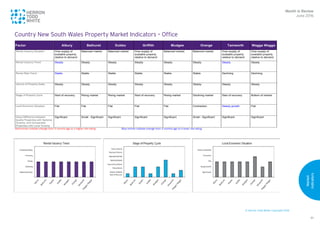
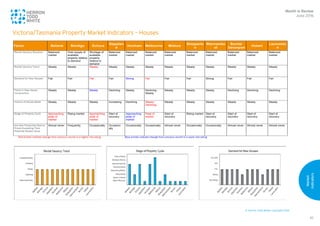
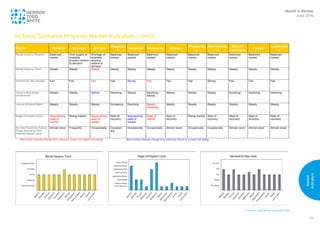
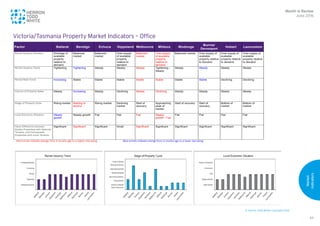
June 2016
Month in Review
Feature – 2016: Half time score	 3
Commercial – Office	 4
Residential	22
Rural	59
Market Indicators	 71
Contents
3
Here we are – a work in progress. It’s a painting with
the outline sketched, ready for the hue’s and shades
to fill in their spaces and point us toward a glorious
ending set to fire up the nation’s enthusiasm for
property – or so it should be.
Unlike the end of the annum, when December brings
a sense of hitting the reset button in preparation for
the next 365 days, June says, “Take a knee and let’s
see what we can do to bring this thing impressively
home.”
Unfortunately for all those who’d been hoping for a
sense of excitement in the air, this financial year’s
start brings with it a Federal Election to deal with.
Many in the media are calling it a long, drawn-out
affair with all the excitement of sloths having a slow
race through treacle. It’s a historic reality that when
elections are called for the running of our country,
property activity slows – but for what reason it’s hard
to pinpoint. Sure, negative gearing is a big debate in
this upcoming poll, but the election of either party
is unlikely to bring the fall of the empire. We are a
stable democracy that has yet to come under the
spell of a dictatorship, so standing back and waiting
for a result before you buy or sell seems, for the most
part, pointless.
There’s also issues beyond just deciding who gets
a bed in The Lodge. Unemployment numbers,
manufacturing woes, mining hangovers and a
general downturn in a once booming property
market are all playing their part across the country.
To demonstrate just how diverse our nation and
it’s property is, we’ve called upon the clever folk at
Herron Todd White throughout the nation to tell us
how their markets are tracking now we’ve hit the
half way point of the year. There is nothing that can
replace the on-the-ground experience of a local,
independent professional… and we’ve got a company
full of them! No matter where you are, from coast-to-
coast, there’s a valuer at our firm who knows your bit
of geography like it’s their own kingdom.
If you like to step beyond residential investments
then this month’s contributions on the office sector
are sure to please. We’ve honed in on rentals to see
what’s happening come EOFY. What are the rent
variations between prime and secondary property?
What drives office rents in your area of interest? Is
there an overall expectation that rents are on the
move – one way or the other? So many questions
answered as well as a general market wrap of the
office space.
So there it is readers – a half time show worth
watching. Take it all in, but don’t forget this is just the
tip of the iceberg. Our team will stay with you as we
steam towards year’s end – just give them a call from
the corporate box and watch them perform.
2016: Half time score
There' something about the mid-year breather.
Month in Review
June 2016
Feature
Commercial
National Property Clock
June 2016
Office
Entries coloured purple indicate positional change from last month.
Liability limited by a scheme approved under Professional Standards
Legislation. This scheme does not apply within Tasmania.
This report is not intended to be comprehensive or render advice and neither
Herron Todd White nor any persons involved in the preparation of this report,
accepts any form of liability for its contents.
Peak of
Market
Approaching
Peak of Market
Rising
Market
Start of
Recovery
Bottom of
Market
Starting to
decline
Declining
Market
Approaching
Bottom of Market
Bendigo
Darwin
Alice Springs
Emerald
Gippsland
Mackay
Orange
Brisbane
Adelaide
Perth
Adelaide Hills
Barossa Valley
Gladstone
Rockhampton
Iron Triangle
Hobart
Burnie/Devenport
Cairns
Launceston
South West WA
Townsville
Wagga Wagga
Wide Bay
Canberra
Albury
NSW Central Coast
Griffith
Horsham
NSW Mid North Coast
Mildura
Newcastle
South East NSW
Sunshine Coast
Tamworth
Wodonga
Sydney
Ballarat
Bathurst
Coffs Harbour
Dubbo
Echuca
NSW Far North Coast
Gold Coast
Mudgee
Toowoomba
Melbourne
6
Overview
The backbone of any commercial investment is
its lease agreement. Without a solid tenant and
reasonable returns, you’re left holding a substantially
less appealing piece of real estate.
This month, we’re taking a look at office space
around the nation and drilling down into the area of
rentals. Not only are we studying the sector location
by location, but there’s observations comparing
prime to secondary, plus an outlook on what to
expect over the rest of the year.
Sydney
Key trends throughout Sydney are continuing to
drive change in both the CBD and metropolitan
office markets. Major infrastructure projects and
secondary office space conversions are at the
forefront of this change. The NSW government is
expected to spend $68.6 billion over four years on
planned infrastructure projects including the Sydney
Metro and North West Rail Links.
The Sydney CBD office market comprises 55%
prime grade space (premium and A grade) and
45% secondary grade space. At the beginning of
2016, Sydney CBD gross face rents typically ranged
from $735 to $1,070 per square metre per annum
for A grade buildings and between $550 and $750
per square metre per annum for secondary grade
buildings. Over the 12 months to March 2016, gross
face A grade rentals have increased by 3%, a result
of strong demand for prime space in the CBD.
Tightening of leasing incentives within the secondary
office market has been occurring, largely as a result
of a significant amount of stock being withdrawn or
earmarked to be withdrawn from the market over the
next number of years. A significant portion of stock,
primarily B and C grade assets, is being acquired by
the state government for construction of the Sydney
Metro rail network.
The Barangaroo Development continues to alter
the dynamic of the CBD commercial market with
strong tenant demand in the western precinct which
neighbours the city core and Barangaroo precincts
to the north. Approximately 38% of CBD leases
recorded in the 12 months to March 2016 occurred
within this precinct, being a strategic location for
businesses looking to service clients in both the city
core and Barangaroo.
An emerging tenant trend within the Sydney CBD
market is the growing demand from the IT and
communication sector, led by deals with major
technology companies such as Apple, Amazon,
Twitter and LinkedIn. The finance and insurance and
property and business services sectors continue
to make up the majority of tenant demand in the
Sydney CBD. These two sectors accounted for 60%
of leases signed during the past 12 months. These
tenants are contributing to the rise in prime grade
rentals seen in recent times.
Generally speaking, similar trends are being
experienced in the Sydney metro office markets
which include North Sydney, St Leonards,
Chatswood, Macquarie Park and Parramatta.
In line with the strengthening of the residential
market, vacancy rates in metro markets have
generally been experiencing a downward motion
which has been driven by a significant withdrawal
of underperforming office assets acquired for
residential conversion. Additionally, the Sydney Metro
rail network project will further amplify this trend
due to secondary office building acquisitions coupled
with stronger public transport links, in particular by
connecting these areas to the Sydney CBD.
Canberra
This comment will focus on the impact of the tenant
in maintaining capital value. There has been much
comment about the high value of transactions in
the ACT commercial office market. The product
being sold is solidly leased buildings with WALEs
in excess of seven years predominantly leased
to Commonwealth government departments or
agencies. The yields being achieved from the recent
spate of sales are in the order of 7.5% to in excess
of 8.5%. These yields and WALEs as part of a
composite national portfolio of properties boost the
average return.
Commercial
Month in Review
June 2016
New South Wales
7
To achieve long term WALEs in older buildings we
are aware that heavy incentives are being offered to
tenants. The incentives include substantial rent free
periods and capital support for fitout. One example
had a face rent of $410 per square metre, a new lease
term of ten years and the incentive package equated
to 30%. The capital value of the asset is protected
but at a much lower level of value had incentives not
been required.
Recent sales that illustrate the strength of the
market include:
73 Northbourne Avenue
Purchase Price $29.2 million
Leased Area 6,100 square metres
WALE
Yield Circa 8.75%
Australia Place, 14 Mort Street
Purchase Price $41.5 million
Leased Area 9,384 square metres
WALE New 10 year lease
Yield Circa 7.5%
An example of the difficulty experienced when a
tenant vacates and the property is sold with vacant
possession:
Gladstone Street Fyshwick
Sale 1 Sale 2
2007 Sale 03/16 (Under Contract)
Price $6.1 million $3.56 million
Area:
Office: 1,860sqm Office: 1,860sqm
Warehouse: 703sqm Warehouse: 703sqm
WALE circa 4 years WALE vacant
Yield circa 7.5% Yield vacant
It can be seen from the above that the term of the
lease is paramount to the value of a commercial
holding.
Illawarra
The Illawarra office market has shown clear signs
of improvement over the past two years with an
increase in sales volumes, demonstrating improved
confidence after a prolonged period of static
conditions. Investment transactions have increased
as investors are enticed back to the market by yield
arbitrage that is becoming scarce in the capital cities.
Most investors are still driven by good quality assets,
strong lease covenants and rental security. However,
price point is becoming less of a factor with demand
still evident for higher valued assets (plus circa $5
million). In addition to local buyers, the region is
attracting investors from Sydney, interstate and
overseas. Owner-occupiers remain active in the sub
$1 million price range.
Low interest rates, a recovery in the development
site market and the increased buyer depth has
resulted in yield compression despite rents largely
remaining stagnant. Low interest rates are a
significant driver in the local market and also have
made it more attractive for tenants to become
owners. The development of several large strata
titled mixed-use projects in the Wollongong CBD
may convert some existing and potential tenants to
owner-occupiers.
Commercial leasing conditions in the Illawarra region
have improved slightly with government tenants a
major driver in the leasing market. This is evident by
State Emergency Services leasing the former ATO
office building in the Wollongong CBD. Incentives
remain common with discounts between 5% and 15%
of gross annual rent usually required to attract a new
tenant. Incentives are usually in the form of a rent
free period.
There is growing evidence of a market split between
A grade space which has low vacancy rates and good
demand and lower quality B and C grade space which
have higher vacancy rates and modest demand.
All tenants however are driven by affordability and
therefore we see limited upward pressure on rents.
Commercial
Month in Review
June 2016
8
Newcastle
Midway through 2016 and we’re seeing a
continuation of high vacancy levels for C and D
grade office property. Perhaps surprisingly, vacancy
rates for A grade property have risen sharply from
their historically low levels of the past few years.
Figures as at January 2016 released by the Property
Council of Australia have shown that total vacancies
in Newcastle CBD office space have skipped out to
12.4%, the highest vacancy factor since 2010. This
is a sharp doubling of the vacancy factor over the
previous 12 month period.
Vacancy has increased in all office
grades and has jumped from 6.7%
to a worrying 25% for D grade
space in the 12 months to January
2016.
This D grade vacancy, while troubling, is contained
somewhat to the largely vacant office space within
the GPT / Urban Growth owned development site
centred around the Hunter Street Mall. There is
an unusual dynamic currently at play within the
Newcastle CBD office market as property for sale
is limited and office space vacancy is very high.
Investors are looking more at potential development
and change of use opportunities rather than straight
investment property as downward pressure on rental
returns is building.
Lismore
Lismore remains in an oversupply situation with
downward pressure on rents. This is more evident
in secondary locations. Superior quality space in
superior locations is generally holding. Secondary
locations experience extended letting up periods
with the need to offer additional fit-out or rent free
periods to obtain longer term leases.
General market levels are:
•	 Prime office – $300 to $350 per square metre
•	 Medium range accommodation – $200 to $250
per square metre
•	 Fringe – $80 to $150 per square metre
We would expect secondary locations to remain
difficult to lease. In addition, there is a 3,000 square
metre office complex under construction in the
Lismore CBD which is understood to have letters
of offer for a significant part. We understand these
tenants are predominantly relocating from other
locations and therefore will result in increased
vacancies throughout the CBD and further downward
pressure on rents.
Coffs Harbour
The commercial office market remains steady. There
is a gradual uptake of the oversupply from 2014 and
2015. There have been some recent redevelopments
of new small strata office space suited to owner-
occupation. Economic policy in regional NSW is
restricting the government sector, with limited
evidence of freshly negotiated leases or growth as
a consequence of the lack of expansion of existing
departments.
Market rental increase negotiations at reviews are
generally moving at CPI or 2% to 3% per annum.
There is some evidence of rent free incentives for
new leases.
General market levels are:
•	 Prime Office – $350 to $420 per square metre
•	 Medium range accommodation – $300 to $350
per square metre
•	 Fringe – $200 to $300 per square metre
Commercial
Month in Review
June 2016
9
Melbourne
The commercial transaction volume in Melbourne
has slowed down in recent months. Although the
Reserve Bank of Australia (RBA) Board reduced
the target cash rate by 25 basis points to a historic
low of 1.75% in May 2016, both local and offshore
investors appear to be holding off transactions until
the Federal Election in July and the uncertainties in
current financing and new government measures
become more clear.
Both the Foreign Resident Capital Gain Withholding
Payments introduced by ATO and the increase in
additional duty payable for residential properties
from 3% to 7% imposed on foreign investors in
Victoria will be effective from 1 July 2016. The new
withholding regime implies that where a foreign
resident disposes of Australia real property with a
market value of $2 million or above, the purchaser
is required to deduct 10% from the purchase price
and pay it to the ATO unless the vendor has a tax
clearance certificate. For foreign investors disposing
of property, this means their sale proceeds will
reduce by 10%. It is possible that these measures
may reduce foreign investment appetite in Australia
as foreign investors could become more cautious of
the Melbourne investment environment, particularly
if more measures targeting offshore investors are
implemented in the near future.
For CBD commercial sites with development
potential, transaction volumes have been slow since
the interim planning restrictions were introduced
in September 2015. This market segment has lost
momentum due to the uncertainty this has created.
Prospective purchasers appear to be more cautious
in the current planning environment and are willing
to hold off purchasing development sites until the
permanent planning controls are introduced in
September 2016. It is apparent at this stage however
that the interim planning restrictions have had
negative impacts on development land within the
CBD if planning approvals had not been secured prior
to the planning changes.
City fringe and inner suburban development sites
continue to benefit from the shift in developers’
interest from the Melbourne CBD. A number of
developers, both local and offshore, are willing to
pay premiums to secure prime development sites.
Competition is fierce for properties with holding
income and development upside. For instance, two
commercial properties at 10 and 12-16 Cecil Place
Prahran were sold in one line for $11.35 million,
reflecting approximately $8,923 per square metre of
improved land. The sale price was reported to have
been circa $2.85 million above the expected price.
As a result of the current economic conditions,
including record-low interest rates, we are
witnessing growing demand from owner-occupiers
in the Melbourne office sector. Deloittes Access
Economics reported that Melbourne experienced
the fastest white collar employment growth in
Greater Melbourne in 2015 over the past five years.
According to the Property Council of Australia’s
Office Market Report, Melbourne CBD’s office
vacancy rate improved in the 12 months to January
2016 to 7.7%, down from 9.1%, owing to the new
entrants into the market, expansion and relocations
to the Melbourne CBD. Tenant demand in the
CBD is mainly driven by the professional services,
information technology and financial services
sectors. Net face rents for prime and secondary CBD
office space ranges from $480 to $670 per square
metre per annum and $300 to $420 per square
metre per annum respectively, with an average
incentive of circa 25% to 30% and 27% to 33%
respectively.
Vacancy in St Kilda Road has continued to decrease
over the past 12 months to 8.9% as at April 2016. It
is reported that the office market stock has shrunk
by approximately 20% from its peak in 1992. The
subsequent withdrawal of office space has led to
a decline in secondary office vacancy levels. It is
anticipated that a further 130,300 square metre of
office space will be permanently withdrawn from St
Kilda Road over the short to medium term. Current
net face rent for prime and secondary office space
ranges from $300 to $350 per square metre per
Commercial
Month in Review
June 2016
Victoria
10
annum and $250 to $300 per square metre per
annum respectively, with an average incentive of
circa 20% to 25% and 20% to 30% respectively.
The decline in vacancy rate in the six months to
March 2016 to 5.29% from 6.2% in the inner
eastern suburbs as well as a year to year (March
2016) increase of circa 10% for average A grade net
effective rent in city fringe/inner east, reflect the
growing demand for office space by both tenants and
owner-occupiers. Despite the strong demand in the
inner east due to proximity to public transport and
employment base, the lack of supply of new office
space over the past year is the other reason behind
the strengthening rental rates. In addition to the
limited new commercial developments in the inner
east, a number of older commercial buildings with
development potential have also been purchased
by developers which further constrain the supply of
commercial office supply.
Rental demand is strong at present for city fringe or
inner-eastern office properties with good exposure
and accommodation. Demand however, is static for
secondary offices located in outer east or south-
east metropolitan areas. There is an influx of prime
grade and smaller space supply to the market owing
to new developments and tenants migrating to city
fringe or inner east for better accommodation and
infrastructure. Landlords of secondary commercial
buildings are offering big incentives to attract
tenants in order to compete with A grade and newer
prime grade offices.
Ballarat
The quality office market in Ballarat could best be
described as tight. The amount of A grade space
in the city is limited as is the pool of prospective
tenants who require large amounts of space and
have the capacity to pay for it. Consequently when
consumers of space enter or exit the market the
effects on the market can be material.
At present there is a significant under supply of A
grade space in the Ballarat CBD. We are aware of two
parties that have been attempting to secure A grade
areas of around 1,500 square metres for around six
months, however to date they have had little success.
This information has found its way to ears attached
to agents and landlords who will be all too happy to
pass it on to their tenants at market review time.
Macro economic drivers of office rents include the
health of the corporate sector and overall economy.
As Australia’s economy transitions from mining and
commodity production to a science and technology
base it would be fair to surmise the demand for
quality space will continue to grow.
On a more local level the state government
is showing a positive attitude toward the
decentralisation of Victoria to regional centres such
as Ballarat, Bendigo and Geelong. Upgrades to the
Ballarat train line and the Ballarat West employment
zone are part of the slated $30 million to be injected
in the area. This should also have a positive impact
on demand for space.
Overall within the market there
is an expectation that rents are
increasing and will continue to do
so over the short term.
For several years now rental rates in the area for
quality space have hovered between $250 and $300
per square metre. However the past six months have
not seen many holdings of A grade space transact for
less than $290 per square metre.
Rates for secondary space vary to a larger extent
than A grade space. There is a lot more of this space
on the market and a lot more parties that require it.
It usually transacts for between $100 and $200 per
square metre depending on the lease covenants.
Echuca
Office rentals are likely to come under some
downward pressure in the short term with limited
demand and multiple options after the building
formerly occupied by Cosgriff Solicitors was vacated.
We note the construction of a new purpose built
accommodation at Sturt Street which is to be
owner-occupied by M&S Accountants who will vacate
Commercial
Month in Review
June 2016
11
their existing accommodation at Annesley Street.
Further development on Annesley Street is likely
with the former Bella Cibo Restaurant advertised for
redevelopment into office space. Rents for standard
office buildings can range from $200 to $300 per
square metre per annum depending on size, location
and quality of the building.
Mildura
Office rents in the Mildura CBD typically range
between $125 and $180 per square metre net,
depending on the size, standard and location of
the premises. The higher end is typically occupied
by national businesses, who often require more
modern, well presented premises, while the lower
end is typically occupied by local businesses or
organisations, many of whom have been long term
tenants. Rents have been stable in recent years, and
we would expect this to continue.
There are a number of vacant offices (mostly older
style) in Mildura and as a result there have not been
many significant new office developments in recent
times. New construction would only be contemplated
by a developer with a lease pre-commitment.
Many local businesses own their premises via
their self managed superannuation funds and this
contributes to a lack of churn in the local office
space.
Bendigo
In recent times Bendigo has seen little movement in
the office sales and leasing sector. New, high quality
office space in the CBD is highly sought after and is
typically let at rates of $300 per square metre and
above. Older style office accommodation is typically
let between $150 and $250 per square metre. The
variation between prime and secondary office space
rates per square metre is typically around the $100
mark.
Bendigo more recently has seen a rise in mixed use
development within the CBD incorporating retail,
office and residential space. Interestingly, the gap
between ground floor and first floor rates per
square metre is noticeably beginning to decrease,
particularly for buildings fitted with an elevator. Pall
Mall, View Street and Myers Street are locations that
have recently undergone or are undergoing this type
of development with relative success. The property
in Pall Mall for example has a steady not for profit
tenant with 700 square metres of office space on a
ten year lease.
A notable prime office sale at 71-75 Bridge Street
achieved an analysed yield of 4.38% and a sale price
of $7 million. This was an extraordinary sale where a
purpose built building was constructed with a below
average yield. The purchase was made by a local
organisation in August 2015.
A secondary class office sale located at 26-28
St Andrews Avenue sold for $1.6 million with an
analysed yield of 7.47% in November 2015.
The office market in Bendigo is relatively stable in
terms of supply and demand. There is a distinctly
limited supply of quality office space for lease
outside of the city centre as this sector is typically
owner-occupied.
Commercial
Month in Review
June 2016
12
Adelaide
Throughout 2015 and into 2016 the economic climate
in South Australia has been subdued. This has had a
dampening effect on commercial markets generally
and has had an impact on the Adelaide CBD and
fringe markets.
The announcement that Arrium is under the control
of administrators is another blow to an already
strained regional economy. Employing over 3,000
people this has a significant destabilising effect
throughout the state which is still dealing with the
continuing decline of the manufacturing sector.
Recent media reports indicate that modelling
undertaken by Flinders University has estimated the
state-wide economic impact of the Arrium closure to
be $770 million.
The announcement that Federal Government has
secured a submarine manufacturing deal which
supports local construction may potentially offer
some relief but the extent of the benefit remains to
be seen. Media reports are estimating that 3,000
jobs will be created with the construction of a new
factory imminent.
In an economic climate such as this, office leasing
continues to be a challenging environment. Agents
are reporting that there is little incentive for tenants
to act quickly with little competition in the market.
This is leading to a growing use of incentives which is
masking the true impact of the market stagnation.
This is particularly noticeable within lower grade
office space with vacancy growing as businesses
gravitate towards premium grade smaller
accommodation which is more functional and may
have a lower overall cost. That said, the vacancy rate
within premium grades in the Adelaide CBD at 7%
(Property Council of Australia data as at January
2016) is only considered low by comparison with C
grade being 16.5% and D grade accommodation at
over 20.5%.
While the vacancy rates aren’t very comforting more
concerning reports are from agents who are finding
the leasing market increasingly risk adverse making
it difficult to finalise agreements.
The general expectation is that rental rates
have not improved and are not likely to in the
immediate future, however some positive signs
are around. Employment statistics show a firming
of the unemployment rate from a national high in
September 2015 of 7.9% down to 5.7% in March
2016. Additionally the appeal of development within
the CBD is resulting in older lower grade office
buildings being converted to residential apartments.
The altered use of these building may eventually
contribute to a reduced supply of office space and
assist in increased rentals throughout the CBD.
Commercial
Month in Review
June 2016
South Australia
13
Brisbane
CBD Office Market
The Brisbane CBD is currently undergoing a
significant change and expansion through the
development of three buildings on the boundaries
of the CBD. With 180 Ann Street and 480 Queen
Street now complete and 1 William Street nearing
completion, we are beginning to see the impact of
these developments on the overall leasing market.
The latest Property Council of Australia figures as at
January 2016, report the current vacancy rate of the
Brisbane CBD to be at 14.9% but this will rise to near
17% once the new accommodation is added to the
supply figures. As premium office accommodation
continues to enter the market, we have seen a
tightening in vacancy rates and rental incentives
between premium grade buildings and older style, B
grade accommodation noting that B grade vacancy
rates were reported at 19.4%.
Prime vacancy rates are predicted
to increase to above 16.5% and it
is believed that this vacancy rate
will force further refurbishment or
withdrawal of older stock.
The January 2016 figures indicate that the market
has recorded its third consecutive year of negative
net absorption, reported at approximately 17,000
square metres. The upside to the current vacancy
rates is that prime office properties such as
Waterfront Place and Riverside Centre are able to
implement rolling refurbishment programs after
having maintained premium grade ratings for a
lengthy period without refurbishments. The rolling
refurbishment programs will allow the properties to
be repositioned within the market and capitalise on
the next round of anticipated major tenant moves
later in the decade.
Gross face rents have remained unchanged however
incentives have continued to increase, currently
ranging between 35% and 40%, which has resulted
in a decline in effective rentals. Incentives are
anticipated to remain high over the coming 12 to 24
months.
Another notable recent issue is that the CBD markets
are now being hit with significant increases in
statutory site values. These are generally between
20% and 30% however in some locations can be as
much as 70% to 80%. This will increase statutory
outgoings and further negatively impact on the net
income of owners over the next three years. Capital
values are therefore expected to remain stagnant at
best and may in some instances fall for second tier
buildings if there is no further yield compression.
Fringe CBD Office Market
Leasing activity has continued within the fringe
CBD locations in particular within the inner south
and urban renewal locales. The majority of recent
transactions has occurred within these locales due
to the provision of high levels of amenity, public
transport and proximity to the CBD. Overall vacancy
rates for the fringe CBD were reported by the PCA
in January 2016 at 12.5% while the inner south
and urban renewal locales reported vacancy rates
at 9.7% and 10.6% respectively. The Spring Hill
and Milton areas have continued to come under
pressure for residential conversion in particular with
the Spring Hill Neighbourhood Plan progressing
through the approval process. With a declining office
market, it is anticipated these areas will see further
withdrawals of stock as the highest and best use of a
number of these assets changes to residential use.
Due to the current leasing market within the fringe
CBD locations, demand from investors continues for
stock with a secure WALE and strong tenancy profile
but there is very limited good quality stock available.
Amenities, end of trip facilities, proximity and access
to the Brisbane CBD as well as public transport
continue to be the major drivers for tenants and as
such, we anticipate seeing a further differentiation
between the inner south and urban renewal locales in
comparison to the Spring Hill and Milton markets.
Commercial
Month in Review
June 2016
Queensland
14
Suburban Office Markets
With the exception of a few bright spots, (for
example, Eight Mile Plains and North Lakes), the
suburban office markets are best described as slow
and relatively stagnant.
Leasing activity has been generally flat, with
commercial accommodation currently remaining
vacant for extended periods. In some locations, local
agents report very little enquiry at all. Rental rates
within this market currently range between $200
and $400 per square metre of NLA gross per annum
while incentives generally range between 10% and
20%.
There is steady buyer demand from owner occupiers
for good locations, as they take advantage of the low
interest rate environment where interest costs are
well under leasing rates. Generally such properties
are less than $2 million, with a predominance of sub-
$1 million properties.
Investment yields continue to range between 7.5%
and 10% with properties reflecting secure WALEs
attracting a strong level of interest. One of the most
notable large office investment sales within the first
quarter of 2016 was 7 Brandl Street, Eight Mile Plains
for $25.5 million reflecting a WALE of 5.2 years and
a yield of circa 7.7%. However sales activity for high
value properties where there is a poor lease profile
is low.
Toowoomba
The office market in Toowoomba is predominantly
found in the CBD and fringe CBD areas with some
office use properties in established suburbs which
generally comprise former dwellings or former shops
converted to professional office or paramedical
facilities. A former bakery and small convenience
supermarket have recently been converted to
professional offices, located out of the CBD fringe
but on major arterial roads within five to ten minutes
of the CBD, with high exposure, easy access and good
on site car parking. Both projects have been driven
by owner occupiers.
Leasing demand in 2015 was considered moderate
with office rentals remaining relatively static. Gross
face rents for prime office buildings sit at around
$375 per square metre to $400 per square metre
per annum gross. Any new development would likely
require rentals at the upper parameter to be feasible.
Secondary office space continued to be low in line
with softer tenant demand, with rents showing a wide
range from circa $180 to $260 per square metre
per annum gross. The slow market conditions have
seen the introduction of some rental incentives as
landlords compete for tenants.
There have been no new major office building
developments in Toowoomba during 2015 or to date
in 2016, with only a small development recently
completed on the corner of Herries and Phillip
Streets. This building is partly owner occupied. The
lack of activity is seen as a result of limited demand
and need for extensive lease pre-commitment and
market leading rentals to make projects feasible. The
Department of Transport and Main Roads had been
sourcing a 2,500 square metre office tenancy within
the Toowoomba CBD or CBD fringe. A tenancy of this
size is considered very large by Toowoomba office
standards with the requirement most likely fulfilled
by the development of a new building.
The low interest rates have
resulted in a strong demand
for commercial properties from
investors, however the lack of
supply of quality, fully leased
properties has limited the number
of investment sales.
The limited investment sales have indicated yields
of between 7.5% and 8.5%. Other investment sales
of note were in Capital Place, a large modern office
building that was strata-titled. These units have sold
at prices ranging from $225,000 to $965,000 at
circa mid 8% net yields. Other larger office buildings,
Petard House and the James Cook Centre were
unsuccessfully marketed in 2014. Both were in the
Commercial
Month in Review
June 2016
15
$5 million to $10 million price bracket with a limited
number of potential buyers. The James Cook Centre
is now under contract due to settle 03 June 2016
for $11.65 million with an analysed yield of 9.69%,
including a 5% vacancy rate and a WALE of 2.8
years.
The sub $1 million price bracket however remains
strong with a significantly increased number of
buyers in this market segment.
Capital values for larger commercial buildings
increased slightly in 2015 and are now considered
stable. There has been strong demand from owner
occupiers for smaller offices in the $300,000 to
$600,000 price range. These offices are often
former houses converted for professional use and
provide easy access for employees and clients and
good off street car parking. A diminishing supply
within this segment has resulted in a slightly stronger
increase in values.
The Toowoomba office market is expected to remain
stable over the coming year.
Gold Coast
The Gold Coast is a coastal, metropolitan region with
an economy primarily driven by tourism, education
and construction. The commercial rental market
for office properties is heavily underpinned by
local businesses interrelated with the key economic
drivers. Southport remains a popular locale for the
legal profession, given that the Magistrates Court is
based in the business precinct. The Gold Coast City
Council over recent years has acquired several office
buildings in Bundall and has now generally relocated
all departments into this business precinct. There
are several long standing government departments
at Nerang, as well as some at Robina. Robina and
Varsity Lakes have seen the majority of office
development on the Gold Coast over the past ten to
15 years and as such, offer a more modern standard
of office accommodation in comparison to the older
established office precincts of Southport, Surfers
Paradise and Bundall. Broadbeach is the fifth office
precinct within the Gold Coast market, however
represents only a small percentage of the overall
supply. There are few dedicated office buildings
within Broadbeach, with more recent office supply
coming in the form of mixed use developments such
as The Oracle, The Wave and Sonata where the
office component encompasses the lower floor levels
generally above ground level retail floor space.
The office market on the Gold Coast is not terribly
large compared to the capital cities. The five office
precincts mentioned above are the subject of
the Property Council of Australia biannual office
survey. As at January 2016, the sum total supply
was 472,250 square metres, with a total vacancy
factor of 13.6%. While still high, this level is a vast
improvement on the high of 24.1% in January 2011.
Disparity remains between different grades of
office stock. The lower C and D grade categories
that make up 32% of the stock reflect the lowest
vacancy at 11%. B grade makes up 40% of the stock
and reflects a vacancy of 14.1%. A grade at 28% of
the stock reflects the highest vacancy at 15.9%. It
is noteworthy that the city’s total absorption rates
appear to be increasing, with higher grade stock
actually experiencing net absorption on par with the
secondary markets.
The positive absorption and broad decrease in
vacancy across the Gold Coast’s office precincts
would appear to have strengthened the rental
market, particularly over the past couple of years.
Many precincts have demonstrated moderate rental
uplift, with an accompanying generally decreasing
level of incentives offered. Where owners may have
been coerced to maintain rentals in a static position
in some cases, we have also noted that more often no
incentives have been provided.
As a general observation, across the board the
average rental level for C and B grade stock would
appear to fall within the range of $325 to $375 per
square metre per annum gross. Car parking is in
addition and will range from $100 to $150 per bay per
calendar month.
For smaller and more tightly held precincts such as
Broadbeach, the rental levels are higher at $425 to
Commercial
Month in Review
June 2016
16
$550 per square metre per annum gross, although
we have been advised of rental for lease renewals
in The Oracle of up to $600 per square metre
per annum gross. This space tends to be B grade
standard or above.
With very few additions to the
supply over the past several
years, we have seen an increase
in the number of entrepreneurial
investors purchasing older,
largely vacant office buildings for
refurbishment.
Examples include 50 Cavill Avenue in Surfers
Paradise, Kaybank Plaza in Southport and Lakehouse
Corporate Space at Robina. The intent of these
investors is to upgrade and then attract tenants with
competitively priced floor space.
The substantial A grade office building 50 Cavill
Avenue at Surfers Paradise had several leases
negotiated in early 2016 at levels around $450 per
square metre per annum gross. This is also the time
when purchase of the property by GDI Property
Group settled after a lengthy marketing campaign
at the behest of receivers and managers. GDI stated
they intend to commence a refurbishment program
and reinstate 50 Cavill Avenue as the Gold Coast’s
pre-eminent office building. We consider that going
forward, this building will see uplift in its rental rates.
In summary, the pendulum for the office leasing
sector is probably moving back more in favour of
landlords.
On 4 May 2016, the Reserve Bank of Australia further
slashed the cash rate by 0.25 percentage points to
a historic low target rate of 1.75%. The Gold Coast
has a high percentage of strata premises, which are
dominated by owner-occupiers. The RBA’s latest
monetary policy decision is likely to further stimulate
this dynamic. As a flow on effect, office occupants
may see it as more advantageous to buy their own
premises rather than lease.
Sunshine Coast
The rental rate for the Sunshine Coast office market
has generally remained steady over the past three
years. We note that over the past 12 months we
have seen a drop in overall vacancy levels, which
has begun to place some upward pressure on rental
levels.
Generally, we are seeing gross effective rents for
prime office complexes with good views from $440
to $500 per square metre, which has seen a circa
5% to 10% increase over the past three years. Our
secondary rates generally range from $350 to $425
per square metre for good quality space, however
have some issues around either location or lack
of views etc. Other, older B, C and D grade stock
typically ranges between $200 to $350 per square
metre depending on size and location.
While vacancy has begun to improve over the past
12 months, there is a significant level of stock still
to enter the market over the next 12 months which
will have significant impacts on vacancy levels. We
primarily see this impacting on the secondary type
stock that are good quality complexes, though do
not have the views of say the office holdings around
Cotton Tree and Maroochydore.
It will likely impact on complexes around areas like
the Kawana Business Village, Primary School Court
at Maroochydore and Carnaby Street, which in most
cases have good quality office accommodation,
though with limited or no real views. This stock will
compete with new stock in a central location at
Maroochydore and extensive incentives are likely
to enter the market of up to 25% of face rentals, as
seen in previous cycles.
We have recently seen some good activity in the
strata titled office market for holdings under
$1 million with an uplift in value levels for both
investment holdings and owner-occupier stock,
however, there appears to have been a slow down in
this market over the past two to three months as the
market begins to factor in the income supply of circa
Commercial
Month in Review
June 2016
17
15,000 square metres or approximately 10% of the
current market.
Wide Bay
The office rental market in Bundaberg has seen
stable values in the 2016 year to date. The modern
offices along Barolin Street and offices suited to
medical professionals have seen the highest rental
levels at between $300 and $450 per square metre
per annum. The total rental quantum on a per annum
basis is a strong contributing factor to the rental
rate per square metre above the circa $60,000 per
annum. Secondary office locations are scattered
around the CBD and range between $100 and
$200 per square metre. Secondary locations are
considered to be under downward pressure. The
preliminary data indicates that there has been a slow
start to the 2016 year for commercial markets in
general. The upcoming local infrastructure projects
may influence office rental markets to some extent,
while rental growth prospects are limited.
Gladstone
The office market for 2016 has remained relatively
flat in line with 2015, with tenants keeping hold of
negotiating power in new leases and when exercising
option periods. Over the past 12 to 18 months we
have seen some reductions in rental levels of about
30% and we anticipate this to continue until rentals
begin to flatten out. Tenants that previously occupied
upper levels with relatively little exposure are now
able to relocate to ground floor tenancies with street
frontage at comparable rentals. This has been a
result of falling demand for office accommodation
since peak workforce numbers on local LNG projects
were dramatically scaled back. Drivers for prime
rentals in Gladstone generally relate to location,
exposure and quality/presentation of the building
and tenancy.
Rockhampton
The Rockhampton office market has remained
relatively stable so far in 2016. Unlike metro
localities, it is difficult to classify office space in
Rockhampton, however we consider most prime
office rental rates are being achieved in central CBD
locations within modern or renovated buildings and
with good car parking allocations. We have seen
prime office rentals between $300 and $350 per
square metre gross, however the rentals can very
depending on how much car parking is included.
There is some good quality office accommodation
rented at a slightly lower $250 to $300 per square
metre gross range. Secondary office rentals are
generally $150 to $200 per square metre gross range
(depending on a variety of factors including size),
with characteristics typical of this office class being
in secondary locations or buildings, poor on site car
parking or being upper floor walk up office space.
The market for this walk up office accommodation is
becoming increasingly difficult to let due to increased
demand for disability access to tenancies. Overall,
we consider office rents to be generally stable,
with some slight downward pressure apparent on
secondary accommodation.
Mackay
Broadly speaking, demand for retail and commercial
space in the Mackay region is relatively soft. This
is predominantly due to the slowdown in the coal
industry resulting in loss of employment and concern
regarding the future of the local economy.
Commercial rental levels have eased considerably
since mid 2014 due to a combination of oversupply
and adverse local economic conditions. Lengthy
leasing up periods and rent free periods to attract
tenants has become common.
Some businesses have taken the opportunity to
purchase their own premises as owner-occupiers due
to low interest rates and the availability of properties
in the area.
Generally, rents for prime properties in the Mackay
CBD are in the range of $275 to $375 per square
metre gross and secondary properties are achieving
rents in the range of $160 to $275 per square metre
gross per annum. However, recently negotiated rents
indicate a fairly broad range and inconsistencies in
the levels at which tenants are negotiating. We have
witnessed some tenants negotiate bargains in recent
months. It is yet to be seen where the rents will
consolidate in these ranges.
Commercial
Month in Review
June 2016
18
Townsville
Townsville’s office market remains entrenched at the
bottom of the market cycle, with high vacancy rates,
low levels of business confidence and very little in the
way of local stimulus or broader economic drivers to
indicate any change in this sector's current position.
The CBD rental market continues to experience
weakness in demand with rental rates continuing
to suffer downward pressure as a result, triggering
increases in leasing incentives in order to attract
tenants. There is an on-going concern that current
short lease terms and high incentives are simply
attracting opportunistic tenants or new first time
businesses into the office market that will have little
commitment to the longer term.
Even though the office market remains slow, sales
that do take place especially at the higher end are
strongly priced and remain indicative of the higher
returns available in the market. These sales, including
the recent Tax Office building sale, demonstrate that
there is southern and foreign cash available and long
term confidence in the Townsville market, especially
compared to very competitive environments in the
major capitals with lower returns on investment.
These factors bode well for the future of the
Townsville market once it regains its normal traction.
Cairns
The Cairns office market is relatively shallow and
experiences limited sales activity. The market has
also experienced limited new development, with the
last large office building constructed in Cairns being
the State Government office tower completed in
2010. There are no known new developments in the
pipeline.
Commercial property sales in Cairns, inclusive of
retail and commercial office premises, remain well
below the peak levels achieved from 2005 to 2007.
Nevertheless the market has been slowly rebuilding
in sales volume since 2010. Prices paid for strata
titled premises have been relatively stable since 2010
at around $2,500 to $3,000 per square metre of
floor area.
Most new office space leasing demand is for smaller
areas and for modern, good quality green star rated
premises, however there is only a handful of such
buildings in Cairns. These buildings achieve high
levels of occupancy and are experiencing stable rent
levels typically of $350 to $400 per square metre
per annum. Demand for lesser quality space remains
limited and there is a large oversupply even of good
quality non-inner CBD and well exposed secondary
space. These conditions have placed downward
pressure on secondary rents and have seen the
emergence of incentives.
Overall there has been little change in the Cairns
office market during the past twelve months and we
see no evidence that the current situation will change
for the remainder of 2016.
Commercial
Month in Review
June 2016
19
Darwin
The Darwin office market remains quite weak with
little relief on the horizon. The Northern Territory
Government has vacated a number of buildings in
town and there does not appear to be any alternative
large scale lessees.
On 5 April 2016, the Northern Territory Government
announced it was seeking expressions of interest
for a new headquarters for the Department of
Health. The facility is expected to be constructed
in either the Darwin or Palmerston CBD and would
be expected to be in place by 2018 or 2019. The
Government sees a number of efficiencies in having
the department in one location.
Consistent with the Property Council of Australia,
we would strongly urge the Northern Territory
Government to consider refurbishment of an existing
development for this project rather than construction
of a new building. Existing space needs to be
absorbed back into the market rather than increase
supply at a time when the Darwin CBD office vacancy
rate exceeds 20%.
The Planning Minister has agreed to consider Darwin
City Council’s CBD Master Plan as background
material for the NT Planning Scheme. The CBD
Master Plan includes a number of proposals to
manage the city’s growth especially in regard to
future transport links, infill housing, parking and
public open space. The plan includes some bold
proposals and it will be interesting to see which of
these (if any) become a reality over the next 20
years.
Commercial
Month in Review
June 2016
Northern Territory
20
Perth
Leasing conditions in the Perth commercial office
market remain stagnant amid weakening demand. As
resources-related companies continue to reduce staff
numbers and functions, demand for office space in
Perth has continued to fall over the past six months.
The size of the Perth CBD office market is some
1.646 million square metres of lettable space, of
which approximately 960,000 square metres, just
over half, comprises of prime (premium and A grade)
space and the remainder of the 686,000 square
metres is secondary (B, C and D grade).
The Property Council’s latest Office Market Report
found that the vacancy rate increased from
16.6% to 19.2% during the six months to January
2016. Nationally, the Australian CBD vacancy rate
increased to 10.9%. In West Perth, office vacancy
rose from 10.8% to 12.2% in the six months to
January 2016.
In the six months to January 2016, an additional
113,463 square metres of new office supply was
added to the Perth CBD market.
The current vacancy amounts to about 210 whole
floors of office space available for lease in the Perth
CBD market, assuming an average floor plate of
1,500 square metres.
Iron ore prices began to fall in September 2012 and
after they failed to recover, many projects began
to be put on hold. By late 2013, with office demand
beginning to fall, incentives began to rise, resulting
in a decline in effective rents. The current average
incentive offered in the Perth CBD is 40% to 50%
however in lower grade space this can be higher.
Current face rents in Perth are $500 to $700 per
square metre per annum net for Prime or A grade
and $300 to $400 per square metre per annum net
for B grade, showing a disparity of approximately
40% between office grades.
In December we predicted that owners would begin
to divest of their assets or portfolios and look for
other opportunities in other markets.
Sales in the Perth CBD in the six months since
December 2015 have amounted to $460 million,
which when compared to the five year 12 month
average of just $725 million shows that sales activity
is on the rise, especially when you consider that for
the whole of 2015, approximately $250 million worth
of real estate transacted in the Perth CBD.
We also predicted in December 2015 that tenants
would use this opportunity to renegotiate leases or
move to better space (with the landlord paying for
the fitout). This means that lower grade space will
suffer most as the flight will be to premium grade
locations and space. This again has proven to be
correct with a plethora of movement occurring
across town.
There is a significant amount of new supply entering
the market which remains uncommitted, adding to an
already high vacancy. There are no real indications
that the resource sector will suddenly re-engage and
fuel the demand for office space in Perth again. We
think that we are in the early stages of a medium-
term, stagnant office market. Space will need to
be converted (for example to hotel, residential or
educational use) or taken off-line and upgraded
before things start to improve in terms of vacancy
and rents.
From an investment angle, yields
have tightened to around 6% to
8% for prime grade assets and
higher for lower grade assets.
Perth has begun its transition from a mining town
into a tourism based town. When James Packer
finishes the expansion of his Crown Casino at
Burswood (which includes a new hotel), the Elisabeth
Quay on the Swan River is fully operational, offering
new hospitality venues, hotels and apartments,
other key infrastructure projects are completed
Commercial
Month in Review
June 2016
Western Australia
21
Commercial
Month in Review
June 2016
(such as the new stadium at Burswood and Northlink
development between the CBD and Northbridge) and
planned expansions of regional shopping centres, we
believe Perth will emerge as a tourism hub given our
closer links in time and distance to the Asian hubs of
Singapore, Malaysia and Indonesia.
This transition phase is predicted to take another five
years to complete, by which stage we hope to see an
improvement in the local economy.
South West WA
Given the lack of quality office space available in
the main towns in the South West and the continued
good demand for A grade space, rents have held
up very well. Rates of between $280 and $320 per
square metre are being achieved in both Busselton
and Bunbury, with higher rates for smaller areas
under 100 square metres.
Secondary office rates are achieving between $180
and $250 per square metre depending on location,
due in part to the greater supply of secondary office
space particularly in Bunbury.
A grade office space is expected to remain stable
until further space is developed. It is anticipated
however that there will be downward pressure on
rental values for secondary space, particularly for
space further away from the CBD.
Residential
National Property Clock
June 2016
Houses
Entries coloured orange indicate positional change from last month.
Liability limited by a scheme approved under Professional Standards
Legislation. This scheme does not apply within Tasmania.
This report is not intended to be comprehensive or render advice and neither
Herron Todd White nor any persons involved in the preparation of this report,
accepts any form of liability for its contents.
Peak of
Market
Approaching
Peak of Market
Rising
Market
Start of
Recovery
Bottom of
Market
Starting to
decline
Declining
Market
Approaching
Bottom of Market
Melbourne
NSW Central Coast
Dubbo
Newcastle
Sydney
South West WA
Toowoomba
Perth
Alice Springs
Darwin
Emerald
Gladstone
Mackay
Rockhampton
Bundaberg
Townsville
Brisbane
Hobart
Burnie/Devenport
Gippsland
Hervey Bay
Launceston
Mildura
Mount Gambier
Warrnambool
Whitsunday
Adelaide
Canberra
Adelaide Hills
Albury
Barossa Valley
Bathurst
Bendigo
Cairns
Coffs Harbour
NSW Far North Coast
Griffith
Iron Triangle
Mudgee Orange
Shepparton
Sunshine Coast
Tamworth
Wagga Wagga
Ballarat
Echuca
Gold Coast
Horsham
Ipswich
NSW Mid North Coast
South East NSW
Peak of
Market
Approaching
Peak of Market
Rising
Market
Start of
Recovery
Bottom of
Market
Starting to
decline
Declining
Market
Approaching
Bottom of Market
National Property Clock
June 2016
Units
Entries coloured blue indicate positional change from last month.
Liability limited by a scheme approved under Professional Standards
Legislation. This scheme does not apply within Tasmania.
This report is not intended to be comprehensive or render advice and neither
Herron Todd White nor any persons involved in the preparation of this report,
accepts any form of liability for its contents.
Melbourne
Dubbo
Gold Coast
Newcastle
Sydney
Brisbane
Ballarat
South West WA
Toowoomba
Perth
Alice Springs
Gladstone
Mackay
Darwin
Emerald
Rockhampton
Whitsunday
Canberra
Bundaberg
Townsville
Warrnambool
Adelaide
Hobart
Adelaide Hills
Albury
Barossa Valley
Burnie/Devenport
Cairns
Gippsland
Hervey Bay
Iron Triangle
Launceston
Mildura
Mount Gambier
Shepparton
Bathurst
Bendigo
Coffs Harbour
Echuca
NSW Far North Coast
Griffith
Mudgee
Orange
Sunshine Coast
Tamworth
Wagga Wagga
NSW Central Coast
Horsham
Ipswich
NSW Mid North Coast
South East NSW
25
Overview
There’s nothing like the end of the financial year to
give us all a chance to reassess our position. You can
check in on your strategy and ensure the second half
of 2016 can be as successful as possible.
As with previous years, we take stock during the
June Issue of Month In Review to see how markets
are tracking around the nation, and what you might
expect for the remainder of this annum.
Sydney
The residential property market in Sydney to date in
2016 has exhibited mixed performance throughout
different areas, price points and product types. There
has also been a shift in market performance and
confidence from the early post-Christmas months
through to the approaching mid-year point. Various
factors have had a role in influencing the local
market with the mid-year point set to be in a stronger
position than start of year predictions indicated.
At the start of the year, most areas appeared to
continue where 2015 left off with longer selling
periods, lower auction clearance rates, decreased
market confidence and in some cases lower than
expected sales prices. This phase continued through
to March when the market showed more positive
signs of stabilisation. Overall however auction
clearance rates remain below the levels of last year
with auction numbers also decreasing significantly.
The levels of property price growth demonstrated
throughout 2014 and 2015 have not continued
into 2016 in the Sydney market. Various market
influences continue to fuel the uncertainty
surrounding the local property sector including the
recent interest rate cut, the impending election,
possible apartment oversupply and restrictions on
foreign purchasers.
With the recent interest rate cut appearing to have
an initial positive impact on auction clearance rates
it must be remembered that most banks increased
their mortgage rates late last year by about 0.2%
points meaning the latest 0.25% point move from
the RBA only takes home loan interest rates slightly
lower than they were late last year. It is perhaps too
early yet to tell if this will have any ongoing effect
or if the previously tightened lending criteria and
regulatory restrictions will continue to constrict the
mortgage market with many consumers already
feeling the pressure of high mortgage repayments. It
was reported by Moody’s recently that home buyers
in Sydney spent an average of 35.6% of their pay on
mortgage payments, the highest in the country and
higher than the average over the past ten years.
The previous decline in investor activity appears
to have shifted with the latest ABS lending finance
data revealing a surge in residential investor activity.
Loans for this group increased by 30% in March
allowing $5.5 billion in lending, the highest monthly
total since September last year. This could be partly
due to the impending election with the future
of negative gearing being questioned. Signs are
emerging that the prospect of changes to negative
gearing in 2017 is stimulating investors in Sydney’s
housing market who appear keen to secure property
under existing conditions, indicating that investors
could be nervous that negative gearing will stop for
all but new properties.
With regards to levels of new stock in the city,
CoreLogic has recently released a report revealing
that record high unit construction is set to increase
settlement risk. With apartment construction set
to hit record highs over the next two years, latest
figures from CoreLogic show a big disconnect in
the volume of stock expected to settle over the
next 12 to 24 months to the average number of
unit sales annually over the past five years. This
could culminate in an oversupply of units in many
areas which would add further misery to an already
slowed unit market. Coupled with this is that three
of the four largest banks have announced they will
no longer be lending to home buyers from overseas
which not only increases settlement risk, but will
also affect future demand from the slowing foreign
purchaser market.
As we attempt to gauge what is happening in the
various local sub-regions the consensus appears
to be consistent. The market performance in most
Month in Review
June 2016
Residential
26
areas started the year slow however stabilisation has
occurred as we approach the mid-point of the year
with some products and price points achieving subtle
levels of market growth. In general it appears that
the unit market, particularly in the inner city fringes,
is taking longer to stabilise with many indicators
suggesting that growth in this sector may still be
hampered by oversupply, restrictions on foreign
purchasers and possible negative gearing changes.
As a summary of the various sub markets within
Sydney we provide the following comments:
South
As a region, the southern suburbs have showed signs
of decline and reduced market activity in the later
months of 2015 through to March 2016 when they
began to stabilise. The fringe suburbs of Engadine,
Loftus, Bangor and Menai have shown a noticeable
decline in sales prices since the peak of the market
in October 2015, with properties in the sub-$1 million
range suffering. Similarly, townhouses and units
under $1 million in many areas have seen a decline
particularly in the suburbs of Hurstville, Mortdale,
Oatley and surrounding areas.
An example of this is 14/17 Newman Street, Mortdale
where a 3-bedroom townhouse sold for $862,500
in March 2016 compared with the sale of a similar
townhouse in similar condition in the same complex
for $905,000 in October 2015. The high influx of new
development in the Hurstville region has also had a
negative effect on overall values.
In early 2016 in southern Sydney there have also
been some strong results for brand new products
over established homes. The choice between brand
new versus older style on a larger parcel appears to
show a preference for a new product over extra land
with strong demand for new duplex style property.
Recent activity includes a duplex at 673 Kingsway,
Gymea which sold for $1.365 million.
This activity can be property specific as there are
examples including the following which highlight the
weaker position at this mid $1.5 million price point:
•	 6 Waratah Street Bexley is a duplex which sold
in April 2016 for $1.65 million after previously
trading in May 2015 for $1.66 million;
•	 The sale of 46a Parthenia Street in Dolans
Bay for $1.95 million in November 2015 did not
proceed and the property has since sold for
$1,850,500 in March 2016 showing the decline in
this region.
•	 43 Lomandra Place, Alfords Point sold for
$1.685 million in March 2015 and has just resold
for $1.67 million.
East
In Sydney’s east, market activity and market
confidence has increased since the last quarter of
2015 and early 2016 with one of the main drivers in
this region being the lack of quality stock. As building
and renovation costs remain high in this region, we
have seen renovated family homes achieving solid
results, especially in beach side locations with price
ranges of $2 million to $4 million. An example of this
is a house once made famous by The Block television
show located at 10 Tasman Street, Bondi, which
was purchased at auction on the show in March
2013 for $1.37 million and recently sold in May 2016
for around $2.5 million with only the addition of a
swimming pool since the previous purchase. Again it
is the smaller sized investment units under $1 million
which appear to have been the hardest hit since
the market peak. Prices for many units at this price
point have shown signs of flattening with limited
growth throughout 2016. Less popular complexes or
locations or units on busy roads require extended
selling periods.
Inner West
In Sydney’s inner west and city fringe areas we have
seen mixed results throughout the first half of this
year. The year started very slowly with limited stock
across all sectors making it hard to gauge how the
market was performing. Auction clearance rates
in these areas continue to perform well however
Month in Review
June 2016
Residential
27
the limited stock has played a part in this. We have
observed the $2 million plus market performing
well with large allotments still a sought after asset.
A recent sale at 27 Park Road, Marrickville on 693
square metres achieved $2.3 million with the dwelling
appearing to require full renovation. The $1 million
to $2 million price bracket appears to have stabilised
again following a period of decline at the end of
2015 through to early 2016. This varies in different
areas as shown at 108 Warren Road, Marrickville,
which sold in May 2016 for $1.247 million after being
purchased in October 2015 for $1.185 million and
undergoing a bathroom renovation. Little growth
has been noted here. A recent sale in May 2016 at
34 Belmore Road, Enmore for $1.9 million showed
approximately 7.5% growth over the 14 previous
months when it sold for $1.77 million in February
2015. Again it is the unit market which has suffered
most in this area. Suburbs with a high supply of
average and low quality unit stock such as Ashfield,
Dulwich Hill and Marrickville have seen this sector
suffer since mid to late 2015. This product in the
sub-$1 million price point is yet to show any great
recovery with demand here appearing to have
suffered the most. Suburbs closer to the city are also
showing unit markets performing below average.
We note 405/209 Albion Street in Surry Hills which
sold in June 2015 for $707,000 has just resold in
May 2016 for $715,000 after updating the kitchen
appliances.
Western Sydney
The property market as a whole in Western Sydney
has bounced back from the nervous times of late
2015 to early 2016. While no longer surging ahead
as it did for the first three quarters of 2015, sales
results are still relatively strong and local agents are
reporting good levels of interest in appropriately
priced property.
It is too early to tell what effect the calling of the
federal election has had on the market. Given
property seems to be a hot topic in this election,
we may see another slight easing in the market as
policies remain unclear. In saying that, the cost of
money remains low and supply is not yet reaching
demand, certainly in the outer west of Sydney.
Vacant land and house and land packages within
planned estates continue to be popular in the market
and are seen as being both affordable and providing
capital growth into the future. Recent land releases
in Jordan Springs on the fringe of Penrith have seen
strong sales results with record prices for vacant
sites in the estate.
A property has recently sold in The Ponds for $2
million, smashing the previous record sale in the
suburb. The Ponds is situated in the Blacktown
LGA and is a less than 10 year old planned estate.
CoreLogic RP Data figures indicate that the median
house price has risen there by 57% in the past
three years, 18% in the past year alone. Granted
the property in question is arguably a one off,
architecturally designed and built to a very high
standard. It does show however that consumer
confidence remains at strong levels.
Acreage and rural lifestyle
properties in the outer ring of
metropolitan Sydney remain
popular, with increases in capital
values and strong sales results
evident throughout the first half of
2016.
This is in part driven by buyers re-entering the
acreage market after having sold off their previous
holdings, located closer to Sydney in the growth
centres.
Parramatta
The Parramatta unit market will be one to watch with
caution over the next 12 months, as buyers off the
plan in late 2015 and early 2016 paid premiums to
secure a unit in a number of new developments. Any
further downward shift in the market may see these
premiums remain unabsorbed by the market.
Month in Review
June 2016
Residential
28
Northern Sydney
In the main, the northern suburbs of Sydney have
been tracking along in a similar fashion to the
majority of Western Sydney. We have noticed that
suburbs surrounding planned infrastructure continue
to grow. An example is Forestville, located within
close proximity to the Northern Beaches Hospital,
currently under construction. The median house
price for this suburb is currently $1.65 million
(according to RPData CoreLogic) and continues to
strengthen from January’s $1.56 million after a lull
in December. Values in the Ryde area have softened
and stabilised after 12 months of rapid growth,
particularly for below average stock. Quality well
priced properties are still achieving strong results but
are taking slightly longer to off-load than the peak of
the market, although still within long term averages.
A recent sale of a duplex at 68A Champion Road,
Tennyson Point for $3.44 million highlights that
quality property is still achieving strong results.
Prestige Market
The prestige residential market in Sydney is generally
considered to comprise properties with values in
excess of $3 million. These properties tend to be
located within the eastern suburbs and eastern
beaches, lower and upper north shore or northern
beaches, with some waterfront localities in the
southern suburbs and the larger rural residential
estates to the north-west of Sydney.
Initial concern with the Sydney prestige residential
market leading into 2016 was whether the upper
end would feel the same deterioration in market
confidence and demand as the greater residential
market. Leading into June 2016, it would seem that
this is not the case. Our discussions with leading
local agents report limited stock levels across the
board. Along with this reduced supply, it appears
that buyer demand remains consistent and auction
clearance rates remain high.
The recent reduction in interest rates by the RBA is
not expected to provide any significant enhancement
to the prestige market, although the reasonably low
Australian dollar makes Sydney prestige residential
property attractive to overseas purchasers.
The expected slow down in demand from high
net wealth overseas purchasers does not seem
to have transpired, although we would consider
that purchasing decisions by local and overseas
high net wealth buyers is now occurring at a more
conservative level, with a higher level of due
diligence.
However, with the Federal Election scheduled for 2
July 2016, the prestige market may show a moderate
dip in activity as savvy purchasers and vendors await
the outcome and evaluate the overall impact on the
local economy.
A recent sale of note is a near $80 million purchase
in Vaucluse. This property includes four separate
properties (13, 13A, 15, and 15A Coolong Road)
which have been purchased in one line and once
amalgamated, will form a near 4,270 square metre
waterfront site with a north-eastern aspect over
Vaucluse Bay. This represents the most expensive
amalgamation of Australian residential property
to date and surpasses the sale of James and Erica
Packer's non-waterfront estate which sold in 2015 for
$70 million.
Canberra
Near record low interest rates and low
unemployment levels have resulted in continued
strength in the ACT economy and property market,
particularly the residential housing sector. Despite
some market uncertainty in the lead up to the 2016
Federal election and possible restructuring and
downsizing of the Australian public service, the
ACT property market and broader economy have
remained resilient.
The impact of the removal of Mr Fluffy asbestos
contaminated homes resulting in increased demand
and market participants for standard dwellings has
had a positive effect on the ACT housing market.
Accordingly, demand for residential property remains
strong.
Month in Review
June 2016
Residential
29
Given current stock levels for sale and rent, softening
dwelling commencement numbers and increased
demand levels, we anticipate the residential market
in the ACT to tighten over the short term with prices
to firm. Small segments of the market including units
along the Flemington Road corridor in Gungahlin and
properties in less sought after locations or providing
inferior accommodation are expected to remain soft.
In the 2016 March quarter,
Herron Todd White research
shows the median prices for
standard housing and medium
density housing at $575,000 and
$410,000 respectively.
Illawarra
The Illawarra residential property market has
continued its reasonably strong growth through
2016 to date. Local real estate agents are advising
that they are generally experiencing good activity
with many properties selling above reserve or asking
price. Continued record low interest rates combined
with a limited supply of properties on the market
have contributed to this trend.
The bottom end of the market is seeing continued
capital growth, with some tailing off at the top end
with fewer listings coming to the market. Units,
houses and rural properties are all selling.
Auctions are still the flavour of the day, as it is
difficult for agents to price properties in this buoyant
market.
Prices in new residential unit complexes in
Wollongong are steadying as are those in older
developments. We are still cautious about unit prices
generally in the CBD and North Wollongong as new
units are turned off later this year. Although all are
reported sold, it is the re-sale market which may
suffer some softening.
Vacant land in the new southern estates of Shell
Cove, Flinders, Calderwood and Horsley are also
showing appreciable rises in the past six months with
generally good take-up.
Many of the new unit complexes are selling off
the plan even before any construction has begun.
Investors are keen to purchase new units as a result
of low interest rates while also benefiting from
government incentives.
First home buyers are snapping up vacant parcels
in these new estates and also benefiting from low
interest rates and government incentives. Overall the
fierce competition between investors and first home
buyers combined with the low interest rates and the
limited supply of properties on the market is driving
market prices upward. Sydney buyers are entering
the market more and more as they are driven out by
the hot house prices in Sydney.
Although confidence is still as high in the market
as it was at the beginning of the year, from our
conversations with both vendors and purchasers, the
sentiment is that the current level of market activity
is bound to slow down soon. Some local agents are
predicting the market to ease towards the end of the
year, despite interest rates remaining low.
Supply in all areas is increasing as tends to occur
when confidence is high and this will tend to regulate
prices. This will result in more properties on the
market, longer selling periods and auction clearance
rates declining.
The areas which have seen the most growth are
generally those where buyers and lenders should be
most cautious. Some areas south of Wollongong have
experienced a substantial increase in value over the
past 18 to 24 months for instance and may be pegged
back in any price correction scenario. As always the
top end will be the most susceptible to any slowing
in the market. Another sector which has suffered in
the past when things turn awry is the beach house.
Buyers off-loading the beach house to ensure they
can keep up the mortgage payments on the principal
residence is a situation we have seen before in this
coastal region.
Month in Review
June 2016
Residential
30
Unemployment is still high in the region with talk
that both extractive and manufacturing sectors
have some redundancies to go. This will also affect
confidence and have an impact on prices.
Southern Highlands
The Southern Highlands residential property market
has seen a marked increase in activity in both
volume and prices over the past eighteen months.
There has been a noticeable increase in activity
by investors with rental levels increasing. The
increasing price trend is very strong at the lower to
middle price brackets, up to $2 million. Properties
over $2 million are steady and also trading more
briskly. There has been good land sales activity in
the now established residential subdivision precincts
such as Renwick Estate (Mittagong), Bingara Gorge
(Wilton) and more recently smaller more affordable
lots at Darraby Estate (Moss Vale). This uptick
in activity has seen the emergence of residential
infill developments in the townships of Bowral and
Mittagong, with established larger land lots being
subdivided into smaller allotments which are keenly
sought after. New construction activity has also
been evident, most commonly project style homes
within these new residential estates. There has also
been renovation and extension activity in the well
located, older style and character homes within the
townships of Bowral and Mittagong. The increase in
prices has been at a steady rate and not as a spike in
pricing. If interest rates remain at these historically
low levels, we consider these market increases to be
sustainable and should continue over the next six to
twelve months.
The Southern Tablelands region is increasing slightly.
Goulburn has seen steady to increasing trends
over the past five years. There have been good
land sales in the new, modern residential estates
in Goulburn, including the Belmore Estate, Merino
Country Estate and the Mistful Park Estate. There is
good construction of new homes activity. Goulburn
is rich in heritage architecture and there is also
good renovation construction activity in these older
character homes. The market in Crookwell is also
steady to increasing slightly.
The rural residential property market (2 to 100
hectares in land size) is steady to increasing slightly
throughout the Southern Tablelands, with good
activity from Canberra commuters and rural lifestyle
buyers from Sydney.
Newcastle
The property market in most parts of the region still
remains strong and active.
The recent RBA interest rate cut to 1.75% will ease
pressure on mortgagees, especially for first home
buyers, however reports of tighter lending practices
which includes lowering EMV thresholds on new loan
applications may off set the benefits of this rate cut
for some.
Many areas of the region have experienced positive
growth over the past 12 months. Interestingly the
median house price in Newcastle’s LGA remains
stable from 12 months ago at around $557,250 (April
2016). While unit median prices have increased to
$487,500 (April 2016) as new, high quality unit stock
becomes available in Newcastle’s CBD locations.
Around Newcastle, local agents are reporting higher
volumes of stock entering the market, as owners and
investors seek to capitalise on the current market
highs. We believe the market is currently at the top
of the property cycle and how long it stays there
will largely depend on macro economic drivers and
Sydney property market influences.
While the back half of 2016 will see more high quality
units hit the market in and around the CBD, These
units are starting around from $300,000 for a
1-bedroom unit and up to $1.2 million for a smart
3-bedroom unit. Agents are reporting good pre-sale
transaction rates.
Residential properties in popular holiday destinations
such as Port Stephens have remained in high
demand and it's too early to see trends to show
otherwise. Agents in this location are still reporting
good buyer interest and low available supplies. While
around Lake Macquarie some agents are reporting
some softening buyer interest resulting from tighter
lending practices, although buyer demand is still
strong.
Month in Review
June 2016
Residential
31
The mining and resource industry downturn has seen
parts of the Hunter Valley property market exposed
to job losses and reductions in rental rates, in many
cases, houses have been discounted in order to
achieve a sale. Sadly, housing market prospects in
these towns dependant on the mining industry do not
look likely improve in the short to medium term.
At the time of writing, Williamtown’s contamination
issue again dominates the front page of the
Newcastle Herald. Unfortunately for many living
within the identified contamination zone the
nightmare of this situation continues to roll on – but
at what cost to all stakeholders involved?
With market commentary surrounding negative
gearing, a looming federal election, tighter lending
practices, Donald Trump and global economic
conditions dominating the headlines it seems the
second half of 2016 will be one full of bravado and
political rhetoric. How this influences the local
property market in the short term remains to be
seen, however the fundamentals remain strong in the
local market.
NSW Central Coast
A Changing Region
Our region is of one the recipients of the state
government's vision of the future. By Proclamation
on 12 May 2016, our region's two councils become
one. No longer do we have a Gosford City Council and
a Wyong Shire Council - we now have a Central Coast
Council.
We are one. The friendly rivalry, banter, one-
upmanship and finger pointing between our former
councils is no more. The models tell us to expect
strength and huge savings for our region as a
single council. We must give thanks to our state's
government for saving us. And we didn’t even ask.
Property Matters
The northern end of our region has seen a rise in
the median value of around 4.7% since the year
started and around 9% over the past twelve months.
Activity in Woongarrah, Hamlyn Terrace and Wadalba
typifies the market sentiment and we notice that a
majority of sales are occurring in the $500,000 to
$600,000 range. Demand for new housing continues
from last year with house and land packages being
well represented. Prices have been rising with
packages (4-bedrooms, 2-bathrooms, 2-car garage
on small blocks) regularly being purchased in the
early to mid $500,000s. From what we can see, the
distribution between owner-occupiers and investors
seems to be fairly even. Yields are estimated to be
around the 4.5% mark at present.
We have been seeing more $700,000 plus sales in
Woongarrah and Hamlyn Terrace, which we attribute
to demand driven by those exiting the Sydney
market. When looking at data provided by CoreLogic
RPData though, the median value for Woongarrah at
present is $540,000 which is down on the previous
two months and indicative of the slight volatility of
this specific market. The increase in developer sales
indicates there is some jostling between developers
in these areas as they secure sites for ongoing
development.
When we think of barometer suburbs, those which
are a good indicator of market sentiment, we often
take a look at Budgewoi. It has at times found itself
on the top ten default suburbs in New South Wales.
A look at CoreLogic RPData statistics shows us that
sales in Budgewoi have increased for the past two
years, but slowed for the first half of 2016 and this is
a telling statistic.
Still at the northern end, the beachside suburb of
The Entrance is known for its volatile unit market
in previous property market cycles. Statistics tell
us that sales volumes are up, but interestingly, the
median value has been quite steady overall.
High end sales at the northern end of the region can
be translated to mean those properties sold in excess
of $1.3 million and there have been a few. A majority
of these sales are beach or lake front properties, but
we say the first half of 2016 is yet to see the sale of a
trophy property.
Over a number of years, the northern end of our
region has seen ongoing development. Much of this
Month in Review
June 2016
Residential
32
activity has been the Warnervale Release Area with
timing of development keeping pace with the will of
the government, the availability of funds and mood
of the people within it. Foreign investment has played
a large part in activity in recent times, but this has
slowed considerably in response to pressure being
applied to lenders.
There has been a lot of activity
in the property market at the
southern end of the region,
particularly when looking at
approvals for new units.
It is estimated that around 245 units have been
approved this year in and around the Gosford CBD.
Approvals have been granted over the past several
years for several thousand units in the Gosford
CBD and while highly unlikely that all of these will
be constructed, it will only take the simultaneous
commencement of several large complexes to put
considerable pressure on the local market. Anyone
looking at buying a unit in Gosford should be aware
of this.
Once again though, the slowing of foreign investment
is likely to have an effect on the local market and
generally speaking, real estate activity has been
up and down. In speaking to real estate agents, it
is apparent that while their buyer databases are
expanding, securing new property listings is their
biggest challenge. Some are indicating that the lack
of stock coming onto the market may be an early sign
of the market slowing and while this could be true,
our valuers are still seeing an encouraging number of
instructions for sale properties.
According to CoreLogic RPData, there has been a
rise in the median value of close to 7% over the past
six months.
Where some parts of the region may have slowed,
the same cannot be said for the peninsula areas of
Woy Woy, Umina Beach and Ettalong Beach. Sales
rates have been reasonably consistent and prices
still appear to be on the rise. It is now becoming a
regular occurrence for $900,000 plus sales here
and we wonder how long this part of the region can
continue on this path and what will happen when it
does eventually stop.
We think those looking to break into the market at
the southern end of the region should take a good
look around the Wyoming, Lisarow, Kincumber,
Bensville and Empire Bay areas. These are still
comparatively affordable areas with potential to
benefit from the rising market. Most of these areas
have older development, but if trends seen in what
have elsewhere become popular suburbs, then
we consider some of these suburbs could be the
ticket. Asking prices in any of these suburbs are
generally starting in the low $400,000s for older
style dwellings in need of a makeover, with partially
renovated or dressed for sale properties in the high
$400,000s and mid $500,000s.
When we talk about trophy sales at the southern
end of the region, we are generally referring to
sales above the $4 million mark. There were a few
noteworthy sales towards the end of the 2015, but
to date in 2016, it has been a bit quiet. A modernist
home with great views at Killcare designed by
Casltespeake Architects sold in April 2016 for a
reported $4.55 million and a renovated lakefront
property on a double block at Wamberal recently
sold for $4 million. We have also been made aware of
a beautiful horse property with a magnificent house
being sold for around the $6 million mark.
It has been a reasonably quiet first half of the year
for high end sales, but a much different story in the
$2 million to $4 million range with a number of sales
occurring in this space. This includes sales of small
rural residential and beachside properties.
NSW Mid North Coast
This month we are having a mid year review looking
at how the Mid North Coast is tracking.
The Mid North Coast area is continuing to experience
increases in sales activity of residential properties
and in turn rising values. This trend has somewhat
Month in Review
June 2016
Residential
33
eased for the higher price bracket properties,
however the lower price properties have continued
good growth throughout the first half of 2016, often
with multiple purchasers competing for the same
dwelling or unit.
The recent interest rate cut to 1.75% will not only
make homes more affordable, it should also enable
easier access to housing finance for first home
buyers, which will in turn assist the momentum
for growth throughout the lower to medium price
bracket in 2016. This interest rate cut comes at an
opportune time when an impending election often
slows down the property market with uncertainty
being a key factor.
The higher value, prestige and rural property
markets in the region remains steady. There have
been more sales numbers and values have increased
slowly, but the limited demand continues to keep
values steadier than the lower end residential
properties.
Looking at Localities:
Port Macquarie has seen good growth with sales
often occurring at or close to full list price after
minimal time on the market which indicates that the
market is still strengthening. Older style dwellings
close to town are favoured by purchasers and the
outer fringe suburbs are favoured for new dwellings
with higher than average construction occurring.
The rental market has eased slightly in 2016 with
some of the large infrastructure work coming to
completion compounded by a large amount of
dwellings being sold to investors for rental purposes
during late 2015. Fuelled by the recent opening of
the Charles Sturt University campus, investors have
been trying to get ahead of the game and have their
newly constructed villas, duplexes and dwellings with
granny flats fully rented prior to construction of a
recently proposed onsite student accommodation
complex.
For Port Macquarie the growth should continue
throughout the remainder of 2016 with the
continuation of the upgrade to the Pacific highway,
commencement of Kmart development and pending
further infrastructure development throughout the
local area.
Surrounding areas
Port Macquarie’s close neighbours have also seen
benefits with purchasers and tenants looking to
these areas to meet their needs and ease financial
stress. These areas include Lake Cathie, Bonny Hills
and the Camden Haven areas. While capital growth
is somewhat variable between areas, good rental
returns are being achieved.
Larger inland town centres such as Wauchope, Taree
and Kempsey have shown signs of price levelling
for the first half of 2016. However new subdivisions
within these areas are still experiencing good vacant
sales and construction activity, indicating that the
market in these areas is moving.
Further south, Forster and Tuncurry are more closely
linked to the Sydney market with a longer lag time
due to the large amount of holiday accommodation.
These areas remained stable when other Mid North
Coast areas took off over the past few years, but
they are now making up for lost time with significant
increases in demand and sale numbers over the past
12 months. This has, in turn, seen values rise, with
this market activity now extending into the prestige
and higher value residential and rural residential
market which is an indication of a strong rising
market and continuing confidence in the area.
Bathurst/Orange
During the Christmas and New Year period it wasn’t
clear how things would pan out in 2016. While the
market was rising prior to then it seemed to plateau
with no sales standing out to indicate any movement.
What has become clear since then is that values
in the larger centres of Orange and Bathurst have
shown upward movement, particularly for well
located central properties, sometimes with an eye
for redevelopment. Such sales give valuers an insight
into underlying land values in developed areas where
often there are no sales of vacant land.
In the suburban areas around Bathurst there are land
developments occurring in Kelso and Windradyne.
House blocks in these areas have typically been
Month in Review
June 2016
Residential
34
selling for $180,000. This is an increase from sales
one to two years ago which typically saw blocks
go for $140,000 to $150,000. Building costs have
generally remained steady which is more in line
with low inflation and limited growth in labour and
material costs.
There have also been strong sales for central
properties that are either established or for
redevelopment. 319 Lords Place, Orange is a circa
1900 renovated federation home with 4-bedroom,
2-bathrooms, detached garage and carport, on a
1,015 square metre block which sold for $825,000.
Just as important to note, CoreLogic RPData shows
that this was the listed asking price and the property
was on the market for only 36 days.
319 Lords Place, Orange
In Bathurst, a recent sale of note is 212 Piper
Street which sold at auction for $1.05 million.
It is a 2,023 square metre site with a renovated
compact 2-bedroom circa 1930 brick house. The
property was marketed as a development site with
potential for eight 2-bedroom dwellings. Such units
in Lithgow have been selling for $320,000 which
could potentially give a gross realisation of over
$2.5 million. I have a feeling that this is a relatively
sustainable growth trend which could continue for
some time in this region.
Clarence Valley
The Clarence Valley has several major infrastructure
improvements either planned or under construction,
including the Pacific Highway upgrade, Grafton Jail
and the second Grafton Bridge crossing.
The Pacific Highway upgrade is set to bypass
Clarence Valley’s major regional hub of Grafton.
Grafton is expected to remain the major regional
hub as this is where the most housing and work is
provided in the region. The passing traffic reductions
will have an effect on the town.
The towns of Maclean and Yamba have had strong
sales activity and have benefited from the Pacific
Highway upgrade. Not only will the upgrade provide
better access to these towns, the current work
undertaken for the upgrades have created plenty of
jobs.
The first half of 2016 has been positive for the
Clarence Valley regardless of the infrastructure
upgrades, however, the decline in the major city
markets is starting to have a minor flow on effect.
The capital city market decrease has reduced the
prestige residential sales.
With further interest rate cuts, there is potential
for an increase in value in the market, especially in
Yamba where there is a shortage of residences on
the market.
Byron Shire
2016 has brought strong buyer activity in the
$500,000 to $1.5 million range. There is especially
strong demand for vacant land in the urban
expansion areas which include Ballina, Lennox Head
and Wollongbar in some cases land selling within
days of stage releases.
The coastal areas are seeing sales steadying to
becoming firm and a slight increase in the slower
markets of Broadwater, Woodburn and Wardell.
With further interest rate cuts, there is potential for
increased value in the market and remaining steady
to strong for the rest of the year.
Lismore/Kyogle/Casino
The residential market within Lismore has shown
some minor improvement since the start of the
year, aided by a low interest rate environment and
Month in Review
June 2016
Residential
35
competitive mood between the main lenders. The
rural towns of Casino and Kyogle have been relatively
subdued in comparison with some brief flurries of
activity but nothing overly significant.
We have noted a distinct lack of sales activity in the
traditional 2-bedroom investment unit, particularly
the older style brick and tile units constructed circa
1980s despite the low interest rate environment and
relatively low price range i.e. $120,000 to $150,000.
The rural/residential market across the board in
all three Council areas has remained relatively
subdued with no significant increases noted in sale
price compared to the beginning of the year, unless
responsible renovation has been carried out i.e. not
overcapitalised.
Possibly the hardest hit has been the remote rural
bush block and the improvement 40 hectare rural
lifestyle block with travel and maintenance costs
becoming important factors to consider.
All in all, a relatively quiet six months.
Coffs Harbour
The market on the Coffs Coast continues to remain
strong on the back of record low interest rates and
renewed consumer confidence which has seen values
rise over 2015 and 2016.
The strong local rental market continues to be
maintaining demand for lower priced homes and
units (sub $500,000) while the mid to upper
sections of the market have also increased in
activity especially in the more traditional beach side
localities.
The rural residential market appears to be making a
comeback with noticeable increase in sales activity
for the well located properties close to Coffs Harbour
and typically within the $500,000 to $1 million price
ranges. There have been several sales in excess of $1
million which have occurred with the most notable
being a property in Boambee (8 kilometres south of
Coffs Harbour) which sold for $2.275 million being
an executive style residence with second home set
amongst botanical style gardens on 1 hectare of land.
The upper end sector ($1 million plus) as always
is limited in the local market by the amount of
purchasers able to secure property of this value
with prospective buyers generally coming from ‘out
of town’ or interstate and dependent upon greater
economic market conditions at that time.
Sales activity has shown an increase in the number
of sales occurring at or in excess of full asking
price which is indicative of a strong market where
demand is greater than supply. We caution that these
increased levels of demand may not be sustainable
over the long term which may make the current
market somewhat more volatile. Any increase
in interest rates, decline in economic activity or
decrease in market sentiment could see a softening
in the market in the future.
The ‘blueberry’ industry continues to expand which
has traditionally been centred on the regional town of
Woolgoolga with expansion of this industry into more
traditional rural residential localities such as Bucca
to the north of Coffs Harbour and Boambee, Bonville
to the south. Prices still being achieved for these
properties are considered to be above sustainable
rural residential values with premiums paid for
land which has the characteristics for blueberry/
agricultural production such as permanent water,
aspect, slope and cleared land.
In short, the market remains strong fuelled by
continuing low interest rates, resurgence in
development, strong rental returns (lower market
sector) and continuing consumer confidence. The
commencement of large scale Pacific Highway
upgrade north of Corindi Beach to Ballina also
serves as positive factor in terms of short term work
opportunities; increased rental market and reduction
in future travel times coming from Queensland.
Month in Review
June 2016
Residential
36
Melbourne
The General Election
The major talking point is negative gearing where
the interest being paid on the loan plus the expenses
associated with renting the property is greater than
the rental income and therefore loss making. In
terms of investment, in addition to the expectation of
capital appreciation, the tax law allows deduction of
this loss against income, allowing the investor to use
negative gearing as a tax benefit.
The Government has openly said that there will be
no change to its policy on negative gearing in the
short term. However it does acknowledge that it
needs to be addressed in some form in the future.
On the other hand, Labor wants to reduce negative
gearing to only newly constructed properties,
however current investors using negative gearing
can continue to have negatively geared investment
properties. The party will also cut the Capital Gains
Tax to 25% rather than 50%.
The purpose of the proposed new policies is to try to
combat housing affordability, especially in Melbourne
and Sydney, and allow more people to become home
owners. However some commentators believe that
cutting negative gearing will result in a major rise in
rents as current investors look to get a greater return
from their investment. The other major concern is
speculation that there will be a flurry of investors
purchasing properties in the next month in a bid to
secure negative gearing benefits before the potential
change of government.
The property market is one of the biggest markets
in Australia and the outcomes of any possible policy
changes are hard to gauge at this stage.
Interest Rate Reduction
The RBA has reduced the cash rate by 25 basis points
to 1.75%. This occurred on 4 May 2016 and brings the
interest rate down to a historic low, well below the
average of 4.92% from 1990 to 2016 (source: RBA,
2016).
It is commonly thought that interest rate reductions
can stimulate the property market as lower
borrowing costs may increase demand for properties.
However, so far this has not been the case for
Melbourne this time around. The auction clearance
rate of 74.3% for Saturday, 14 May was steady but
lower than the rate of 76.8% for the same weekend
last year (source: Domain, 2016) concluding that
the interest rate cut is yet to provide a substantial
increase in demand for housing.
Furthermore, the RBA does not expect that the
decrease in the interest rate will cause a property
boom. The Reserve Bank Governor, Glenn Stevens,
has stated that in reaching its decision, "the board
took careful note of developments in the housing
market, where indications are that the effects of
supervisory measures are strengthening lending
standards and that price pressures have tended to
abate" (source: RBA, 2016).
National Australia Bank Chief Executive, Andrew
Thorburn, stated “I think interest rates are so low
anyway, whether it’s 2% cash rate or 1.75%, people
aren’t going to go and buy another house based on
that” (source: The Sydney Morning Herald, 2016).
There is speculation that the interest rate cut may
have more of an effect on the lower end of the
market, however, this has not been seen as yet
(source: Domain, 2016). Over the coming weeks we
are likely to see whether or not the interest rate
cut has had a notable or a minimal effect on the
Melbourne housing market.
Overseas Buyers
With the Foreign Investment Review Board (FIRB)
estimating that up to 20% of real estate transactions
in Australia are to overseas buyers (source: RBA,
2016), any lending restrictions to overseas buyers
have potential implications for this buyer group.
The June 2016 quarter has seen the big four banks
tightening lending criteria to overseas buyers to
varying degrees. On 18 April, CBA reduced the
maximum LVR from 80% to 70% for temporary
residents living in Australia and paid in Australian
dollars. It also announced that it will no longer lend
to temporary residents with overseas income. This
follows ANZ’s cessation in April of loan applications
Month in Review
June 2016
Residential
Victoria
37
based solely on foreign income as well as a limit of
70% on construction. Westpac and its subsidiaries
St George, Bank of Melbourne and Bank SA stopped
lending to non-resident and temporary resident
buyers entirely on 27 April.
NAB further tightened its lending criteria from 14
May with a new LVR of 60% (previously 70%) and
foreign income can now only account for 60%,
down 25% from 80%. Citibank has also placed
restrictions. While the Bank of Bendigo and Adelaide
saw an increase in loan applications in the immediate
aftermath of the restrictions placed by the big four,
it has also since stopped processing overseas loan
applications (source: Australian Financial Review,
2016).
These tougher lending criteria are prompting some
commentators to issue warnings about settlement
risk where overseas buyers who have already paid a
deposit to purchase a property may find themselves
unable to secure finance to settle the purchase.
This risk pertains in particular to off the plan unit
sales as this is the type of property most frequently
purchased by overseas property buyers (source:
CoreLogic RP Data, 2016; RBA, 2016).
This risk sits alongside further factors - the number
of overseas property buyers is declining due to a
weakening Chinese economy, tighter lending rules
from APRA (the Australian Prudential Regulation
Authority) and surcharges and higher stamp duties
introduced by the Victorian State government in
2015 and 2016. In addition, the Australian Securities
and Investment Commission (ASIC) is investigating
fraudulent mortgage application documentation
used by Chinese buyers to purchase an estimated
$1 billion of property in Australia amid reports that
forged employment and income statements can be
purchased for as little as $200 (source: AFR, 2016).
Melbourne Apartment Market
The apartment market for central Melbourne has
started to soften for the first part of 2016. According
to CoreLogic RP Data, there was a 0.5% drop in unit
prices for the first quarter of 2016, including a fall
of 0.9% in March. Based on figures provided by the
REIV, Melbourne CBD had a 17.2% drop in the median
unit price while Docklands had a 6.7% increase in
the median price and Southbank had a 6.3% median
price rise.
Melbourne v Other Capital Cities
Victoria is Australia’s fastest growing state, with
a net growth rate of 1.7% in the year leading up to
March 2016. This has seen the state overtake New
South Wales which had a growth rate of 1.4%. With
the steep price of housing in Sydney, home buyers
are finding it unaffordable and are looking to other
capital cities such as Melbourne. Melbourne is
expected to overtake Sydney as Australia’s largest
city by 2056. The driving factor behind this is
Victoria’s strong economy. Migration to Victoria
is currently greater than that to any other state in
Australia. In the year to September 2015, Sydney
gained the most migrants of any state with 87,800,
but lost 95,300 residents, whereas Melbourne
is reported to have gained the second largest
amount of migrants at 73,500, but only lost 62,400
residents.
Population Growth by State (Source: ABS, 2016)
Melbourne is expected to overtake Sydney in 2016
as the best performing capital city in terms of
market growth in house values with property price
growth expected to hover around 8% in Melbourne
while Sydney is expected to see growth of about
4%. Comparing Sydney’s median house price of
Month in Review
June 2016
Residential
38
$995,804 at the end of the March 2016 quarter
with Melbourne’s median house price of $713,000,
housing is evidently more affordable in Melbourne.
The decline in the resources sector has also seen
the recent deflation of Western Australia’s property
prices with the median house price falling 4.7%
over the year leading up to March 2016, whereas
Melbourne’s median house price has had a steady
growth over the past few years since the GFC
demonstrating the strength of Melbourne’s economy
and overall property market.
Median House and Unit Prices (Source: Domain, 2016)
Market Surprises
4 Robertson Street, Toorak
Recently listed on the Melbourne property market
is this Toorak mansion, comprising 18 rooms, 7-
bedrooms, 7-bathrooms, 3-kitchens, a dining room
that seats 18 people, a den for business meetings,
a separate office, formal sitting rooms, landscaped
gardens, a 25 metre outdoor pool and spa. The
Toorak mansion, which was formerly owned by the
Smorgon Family, is predicted to become Victoria’s
most expensive home. The record is currently held
by a Portsea cliff top home that sold for $26 million
in 2010. According to agent Marcus Chiminello,
Robertson Street is expected to reach between $26
and $30 million.
4 Robertson Street, Toorak (Source: RealEstate.com.au, 2016)
Mansion in Tarneit
Wealthy businessman and local Wyndham City
councillor Intaj Khan plans to build a $9.5 million
mansion on ten acres in Tarneit. The home will boast
16 bedrooms, a 30-seat home cinema, two swimming
pools, a 7-car garage, tennis court and helipad
(source: Domain, 2016).
Tarneit, 27 kilometres west of Melbourne’s CBD, is a
modern suburb dominated by relatively new housing
estates. The majority of homes have been built in
the past six years in a high density pattern with block
sizes in some estates below 400 square metres.
There is strong competition among developers in
Tarneit and a large amount of englobo land available
for further housing in this precinct. The average price
for a family home in Tarneit is roughly $415,000.
Due to these factors, Khan’s plans may seem bizarre
and may come as a surprise to many, and getting his
money back in the future could prove difficult.
Month in Review
June 2016
Residential
Tarneit Mansion (Source: Domain, 2016)
39
Ballarat
The Ballarat residential market has had a strong start
to the year with steady volumes of sales. The higher
price bracket of $700,000 and over has performed
well with strong demand. Lake Wendouree has
performed well with high demand and high prices
achieved. Period style housing and large allotments
are proving to be highly sought after and are
achieving premium prices. This market has shown
some success with auctions and short periods on
the market. A notable auction result was 6 Service
Street, Lake Wendouree, a deceased estate, which
achieved $1.215 million.
The lower end of the market, sub $300,000,
continues to perform well, providing opportunities
for investors and first home buyers. Suburbs in this
market that have been performing well are Ballarat
East and the southern areas of Wendouree, close
to the schools and shopping facilities. Demand and
availability within this bracket remains constant with
good rental returns.
The unit market in Ballarat is beginning to slow
with an increased supply of unit developments. The
unit developments are strongly driven by investors
where rental returns are strong. The low interest
rates continue to fuel investment interest, however
possible changes to negative gearing following the
forthcoming election have the potential to affect the
investment market such as unit developments which
provide minimal capital growth.
The mid bracket of $300,000 to $600,000 has been
slower to date with continual supply of new land
estates and the option of building new houses. Within
this bracket the stronger performing suburbs are
Brown Hill and Lucas. Delacombe has remained fairly
static with the oversupply of new housing estates
coming to the market.
Overall, the Ballarat region has had a strong and
reliable start to the year and is expected to continue
in this manner for the rest of the year. The election
may slow real estate transactions for a short period
but it is unlikely to create any dramatic changes to
the sector.
Echuca
The local residential markets have continued to
bubble along relatively strongly mostly on account
of a lack of supply. Sales in the standard mortgage
belt of $350,000 to $450,000 and new homes are
ticking along at average rates. There have been
several strong sales in Moama including a record
sale in Perricoota Run (under contract) significantly
in excess of $800,000 after the previous record
of $745,000 which was relatively short lived. The
strong performer has been rural residential holdings
with what seems to have been a run of relatively
strong sales in and around Echuca after a relatively
strong period of demand.
Gippsland
Five to six months into 2016 and the property market
is considered stable with minimal movement in
prices. An impending election can cause trends and
actions to be conservative, however discussions with
local real estate agents reveal optimism heading into
the next six months, with evidence of long listings
starting to sell. Below is a summary of the cities and
towns throughout Gippsland.
Sale
This niche market with the strength of the RAAF Base
maintains positive results. Sale has limited areas
to build, which therefore strengthens established
markets throughout central and east Sale. Rentals
are as high as they have ever been. It's currently
a buyer's market and is a good time to invest in a
strong stable market.
Traralgon
Land prices are very affordable with a high supply
of land. The construction industry is strengthening,
with high opportunities to build quality homes at
affordable prices. We have also seen three sales
between $700,000 and $800,000 in the past 12
months.
Month in Review
June 2016
Residential
40
Morwell
The market has recovered in recent times after
a slow 2015. The new Heritage Estate is popular
with high quality homes and new houses selling
quickly when on the market. At the lower $100,000
to $150,000 end, investors can achieve 8% plus
returns, however the low quality of homes and the
demographic profile are considered a risk.
Trafalgar
Surprise packet number one - Trafalgar is bucking
the trend, with land prices increasing with demand
for new estates and high quality builds. Sales of
$500,000 plus are occurring more often in 2016.
Warragul/Drouin
This is a stable market with increasing demand
for new construction. Land estates are developing
quickly with increased demand. Just over an hour
from the city, the Warragul and Drouin markets are
definitely ones to watch. We also note two new real
estate agencies have opened in Drouin in the past six
to 12 months.
Koo Wee Rup
Surprise packet number two – approximately 45
minutes from the city, Koo Wee Rup is seeing
Increasing demand for new residential estates. Within
12 months, land values have jumped from $190,000
to $220,000.
Phillip Island and the Bass Coast have seen steady
numbers of listings and properties are selling within
a reasonable period, however, there has been no
noticeable increase in market values. Phillip Island
and Bass Coast have seen stable growth in the
construction of new dwellings and vacant land.
Rural localities consisting of small holdings have seen
limited sales with stable market values throughout
the district.
Venus Bay has a higher than average number of
properties, both dwellings and vacant land, listed
for sale. After some fluctuation in values over the
previous few years, the market appears to have
stabilised and no noticeable change in value has been
noted in the past six to 12 months.
In summary we are in a buyer's market, with many
options for the investor and plenty of opportunities
to build the dream home at a reasonable price.
Mildura
The residential market in Mildura has maintained
a steady pace so far this year, with most listings in
the $250,000 to $450,000 price bracket selling
within three to six weeks. However despite the
steady activity, values have stayed about the same,
suggesting that we have a reasonable balance of
buyers and sellers at this main local price point.
Demand appears strongest for modern homes, with
older, dated homes receiving less interest. Homes
up to $500,000 are meeting the strongest demand,
and it is clear that there are fewer buyers currently
competing for homes above say $600,000. This
might suggest fewer professional people have
moved to Mildura in the past six months. It is hard to
say whether this is a definite trend or just a blip in
activity.
Most local builders are busy, with
a number of recently released
residential subdivisions providing
an adequate supply of serviced
sites for local buyers.
Most of the building is currently for owner-occupiers
and low interest rates are likely to be assisting this
activity. Land values have held up well, with some
increases evident in preferred subdivisions. Prices of
over $100,000 for a serviced lot are becoming more
normal, with developers forced to pass on higher
headworks charges.
Month in Review
June 2016
Residential
41
Brisbane
We Queenslanders love half time – it’s good for one
of two things:
1.	A chance to take a breather from running so many
tries over in the first half.
2.	An opportunity to collectively agree we’ll take our
foot off the brake and romp home in a come-from-
behind win.
We maroons thrive of being underrated and then
over preforming, and it’s hoped this will translate into
our property market as 2016 progresses. Now is the
opportunity to take stock and see how we’re tracking.
Certainly near city property is doing well. The solid
foundation of owner-occupier real estate continues
to see good performance in suburbs sitting within
5 kilometres of the CBD. It’s our market’s best
performer – particularly detached housing – with
most of the past 18 months demonstrating terrific
gains. That said, consolidation began in early 2016
and prices seem to have stabilised. We can probably
expect more of the same as we travel beyond June
with performance being flat to slightly rising.
Step a touch further out and property in the 5 to
10 kilometre band has experienced uplift in value.
It’s probably evident of the capital growth 'wave
effect' which we experience with almost monotonous
consistency in Brisbane. As those suburbs closer in
become relatively expensive, buyers begin pushing
further out and bolstering values in these next-wave
areas. This market has also been flattening in 2016,
although areas close to infrastructure and facilities
continue to perform best.
If you’re flirting with real estate at the urban fringe,
there’s been little love in return. Supply is strong and
demand is steady… and this is set to continue for
some time yet. Don’t expect unbridled capital gains in
these areas in the foreseeable future.
There has been a lot of talk about our inner city unit
market with an oversupply situation that’s graduated
from 'looming' to 'inevitable'. This sector is a huge
concern. There are still heaps of projects that are yet
to come online or are in the planning phase. They are
also predominantly investor driven and this could be
a recipe for a lot of heartache – particularly as a large
percentage of buyers are interstate and international
investors. Add to this the tighter restrictions on
lending to foreign investors and you can see where
it might all be heading. As we’ve been saying for
some time – in terms of inner city units, the best per
formers are, and will continue to be, those projects
designed with owner-occupiers in mind.
If you’re wondering how tenant demand is tracking,
we can confirm current data shows vacancy rates
for houses at 2.5% and units at 3.2% (unit vacancy
increased by 0.3% year-on-year). The combined
vacancy rate for all property types is 2.7%. The
general rule is any result below 2% demonstrates an
under supply of rentals, 2% to 3% seems balance,
and over 3% represents oversupply. From the
numbers above, it’s easy to recognise where the
weak sector is in the market.
Rental yields are also tracking
fairly steadily with most housing
achieving 4.5% to 5% gross, while
units sit around five to 5.5%.
Steady but not stunning.
While there’s still reasonable sales activity within the
big, well-serviced residential estates (e.g. Springfield
Lakes), most smaller land subdivisions are seeing
a rise in sales to investors. This usually indicates
developers are beginning to slow down production,
particularly in areas such as Redbank Plains.
In case you’re wondering, we have also observed
(qualitatively) an increase in mortgagee-in-
possession work, although it’s not at concerning
level.
So overall, the Brisbane property market is fairly
stable and with the election now looming, we’ll be in
a holding pattern until after the July poll. Typically,
the market in Brisbane is strongest when Sydney
Month in Review
June 2016
Residential
Queensland
42
and Melbourne prices increase to a point where
owners offload their holdings down south and head
to the Sunshine State where they can buy a bigger
home and still have plenty of cash left over. We’ve
yet to see that occur because our State’s job market
is performing below expectation. A recent report
put our unemployment rate behind all other state’s
except South Australia. Confidence is the major issue
and until there are signs of an improving economy
and jobs growth, our market will remain pretty static.
Toowoomba
In Toowoomba, the residential market has shifted
from stable to showing the early signs of regressing.
For the first time since 2011, the median house price
has decreased from $378,000 in the last quarter
of 2015 to $359,000 in the first quarter of 2016. In
line with this, the volume of sales has also declined.
However, while investor interest appears to be easing
parallel to the slowing market indicators, the capacity
for long term capital gain remains attractive to first
home buyers, upgraders and renovators due to
Toowoomba’s relatively affordable price points.
Across Toowoomba, following the declining mining
and coal seam gas industries and associated job
losses, the property market has passed its peak
with agents reporting reduced buyer enquiry and
extended selling periods. However, while some
sectors are performing better than others, there is
no specific property type outperforming the broader
market. Price segmentation over the 2016 financial
year shows the majority of sales recorded – that is
41% of all house sales – to be between $300,000
and $400,000, the price point which encompasses
the median house price and consistently proves
most active, while sales less than $300,000 and
sales between $400,000 and $500,000 constitute
approximately 20% of all house sales.
Overall, the relatively strong sales and price growth
demonstrated in 2015 have not been met with
equal enthusiasm in the first half of 2016. A cooling
of the market may stabilise before a significant
decrease in value occurs with the construction of the
second range crossing and the QIC shopping centre
development acting as catalysts for future economic
growth across the region.
Gold Coast
Activity across the Gold Coast is erratic depending
on the property type, buyer profile and vendor
circumstances.
Houses within the central and coastal suburbs
(Paradise Point to Palm Beach and east of the M1) are
still attracting strong buyer demand. The wheels are
still turning also for house and land packages sold via
the investment market.
However, the volume of valuations for both refinance
and purchas has definitely dipped over the past
two months. Whether this is a result of concerns
about the capital city markets, opinion that some
price brackets are over heated, a looming Federal
Election or a combination of all, it is the topic of many
conversations.
"Will the Commonwealth Games create a boom
on the Gold Coast?" and "Will there be a Games
hangover?" are questions that are being asked
regularly. Our view is that a boom is unlikely given
the current state of play, and bust is not expected
provided prices do not continue to grow through to
2018.
One thing that has become apparent is that some
sectors are slowing more than others. During a boom
market the last sector to see gains has historically
been acreage housing and old highrise units. It is also
not unusual for these two sectors to be the first to
stall as the market slows, which is the case according
to our current experience.
The central Gold Coast housing market up to $1.35
million appears to be the strongest in terms of price
growth and volume of sales. The market, however,
over $3 million is very slow apart from four recent
sales over $10 million of which three have been to
international buyers.
Northern Suburbs
While the levels of market activity in the central north
zone of the Gold Coast are generally stable, it does
appear quieter than this time last year.
Month in Review
June 2016
Residential
43
In saying that, there is a hive of activity around
Southport in the Priority Development Area with
a number of new mediumrise residential buildings
either recently completed or under construction.
These buildings are offering compact style units
which have mainly appealed to investors at attractive
price points around $400,000. These units are
renting out between $420 and $470 per week and
have quite manageable Body Corporate fees of
around $50 per week.
Agents have been reporting that
older established units (duplex
and townhouses) are spending
more time on the market than
six months ago and this could be
attributed to the new affordable
stock available in Southport and
Biggera Waters.
The housing market is robust up to $700,000 in
most areas. We are finding renovated dwellings
through Ashmore, Southport, Biggera Waters and
up around Paradise Point are achieving premium
prices if the quality is there. Local selling agents
are reporting that a lack of quality stock is keeping
competition healthy.
In terms of affordability, around Coombabah for
example, there are opportunities for first home
buyers. A notable sale on Allinga Street, which is a
quiet street near the river. It comprises a single level,
circa 1960, older style, fibrous cement sheeting with
2-bedroom and 1-bathroom and has fibrous cement
roof and a 2-car detached carport. The living area
sizes is 99 square metres with an outdoor area of
60 square metres. The dwelling is located on a near
level, regular shaped, inside lot situated at road level
with a land area of 506 square metres. The property
sold for $400,000. Most properties will need work
around this price range however they have good
opportunity for capital growth.
There have not been any surprises as such in the
central north area of the Gold Coast, the interest rate
drops have supplemented what seems to be a rare
period of stability.
M1 Corridor
With new estates continuing to spring up throughout
Coomera and Pimpama the majority of transactions
within these suburbs are to the investor market.
Interstate investors account for the bulk of sales,
however investors with a Chinese origin are starting
to increase in frequency. House and land packages
still continue to be the most popular product with
prices for both the vacant land component, and
building contract varying wildly. It is not uncommon
for build costs to range between $1,150 to $1,500
gross per square metre for a similar product.
Likewise, there is also a wide range in purchase
prices for vacant allotments with your typical 400
to 450 square metre allotments selling for between
$230,000 to $260,000. In some of the smaller
estates we have seen a single builder exercising 'put
and hold' options on the entire estate which excludes
the owner-occupier market.
Eagleby, an established southern Logan suburb, still
continues to be popular with southern investors with
investor demand outstripping that of the owner-
occupier. Prices in this suburb have accordingly seen
an upward momentum over the past 18 months.
Despite the domination of investors in the suburbs
of Coomera and Pimpama owner-occupier demand
has remained strong, albeit confined to estates
such as Gainsborough Greens and Parkside for new
product. An example of a house and land package
that recently sold in Gainsborough Greens is 14
Girraween Street which was priced at $492,504
and comprised a 4-bedroom, 2-bathroom onground
dwelling with a good quality fitout, 185 square metres
of living situated on a 420 square metre regular
shaped allotment. Established estates such as
Coomera Waters and Genesis have also continued to
be favourites with owner-occupiers due to the higher
quality dwellings located within, and the higher ratio
of owner-occupiers to investors.
Month in Review
June 2016
Residential
44
Eagleby has seen a recent increase in owner-occupier
activity as buyers are being priced out of suburbs
closer to Brisbane, however, investor transactions
still dominate this particular suburb.
Southern Gold Coast/Northern NSW
The market for the majority of residential property
types continues to strengthen on the southern Gold
Coast and northern New South Wales with reduced
selling periods, stronger market demand and less
stock available.
This is also evident in the rental market with property
manager's reporting strong levels of enquiry by
prospective tenants within the first few days of
a property being offered for lease. As a result,
the rental prices being achieved have improved
considerably over the past 12 months, as have the
returns/yields to investors.
While there are a small number of investors buying
units in the southern area, the market seems to be
dominated by owner-occupiers looking to move to
the beach side suburbs. A number of the properties
are being sold to local buyers rather than interstate
investors.
Scenic Rim
The north-west and western portion of the Gold
Coast offer both good value for money and return on
investment, especially with the current low interest
rate environment.
Investors and owner-occupiers alike are still active
within all the new growth areas of Yarrabilba,
Jimboomba Woods and Flagstone.
Land values are still rising steadily with the majority
of estates reporting good enquiry with limited new
stock available. Developers appear to be focused on
both sectors of the market, with Lend Lease recently
offering 'completed' land to target to the owner-
occupied market. This eliminated the construction
lead in time and waiting for the issue of titles before
being able to settle and start building. Sales within
the estate are now predominantly to the owner-
occupier market with the average 450 square metre
allotment selling for around $190,000 to $200,000.
Moving a bit further west, Flagstone has recently
released their land to the west of the Brisbane-
Sydney Railway and are reporting good interest.
This precinct will appeal to the lower end of the
market, sub $400,000 and, in time, will include
shopping and medical precincts as well as passenger
rail to the Brisbane CBD. There is a release of land
located directly opposite the Flagstone Primary and
Secondary Schools which sold for around $145,000
for a 375 square metre lot.
Heading South, established housing in Beaudesert
remains an owner-occupier market with the majority
of sales occurring from $280,000 to $360,000.
There are a number of estates being released
within the area over the next six months or recently
released including Oakland Estate, balance of Scenic
Rise and Banksia Greens, and these will target both
the owner-occupier and investor. The Bromelton
State Development Area is due to start construction
by the end of the financial year and this is expected
to have a positive effect on demand within the
immediate area.
Sunshine Coast
In the first half of 2016 the Sunshine Coast market
has tracked along reasonably well after a pretty slow
start in January. We have had a reasonable start to
the year with good activity in most sectors. Some
grey clouds have however started to appear on the
horizon which is not a major cause for concern as
yet, but is something to be aware of.
The upcoming federal election has the potential
to be a bit of a game changer. The various policies
being proposed, including the reduction in negative
gearing, have the potential to significantly impact
the property market. Combined with the general
uncertainty of an election period, the decline in
confidence could have a significant impact.
Entry level properties in most sectors continue
to perform well, typically those along the coastal
stretches and areas close to amenities. This is
the case for housing and units as well as entry
level prestige dwellings. Time on the market
Month in Review
June 2016
Residential
45
has decreased and improvements in values have
occurred. We do not believe there have been any
major problems with this market other than limited
stock levels that has effectively curbed sale volumes
with some resistance to new pricing.
The unit market has the additional facet of body
corporate fees. Complexes that have fairly low body
corporate fees have done pretty well however if
body corporate fees are high, the market drops
away. Larger permanent style units and also larger
townhouses and small lot housing have improved on
the back of empty nesters wanting to downsize.
We have seen an improvement in the rural
residential market however it has certainly been
at a slower pace than that of the housing and unit
markets. Some reasonable buys remain given the
discretionary nature of these properties with the
ability to purchase at below replacement.
When looking at the prestige market, entry level
has performed fairly well but above say $1.5 million
the market tends to thin out quickly. As with all the
markets but more so in the prestige market, it is very
much reliant on the specifics and circumstances of
the property, the purchaser and the vendor. Any
properties that have issues or are overpriced will
tend to sit.
The Sunshine Coast University Hospital continues to
be a massive driver. It was due for completion in late
2016 but has been delayed to 2017. There are other
projects on the agenda such as the new Maroochy
Town Centre and Aura from Stockland (formerly
Caloundra South) but these projects are market led.
Jobs and more importantly, creation of jobs, will be
critical for the coast going forward.
Hervey Bay
Based on our market research from 1 October 2015
to 31 March 2016, the median price for property in
Hervey Bay on an allotment size not greater than
1,500 square metres is $320,000. This is an increase
of $10,000 for the same period 12 months ago. The
average price for the period is $329,199 compared to
$316,697 for the same period last year. The volume
of sales is lower by approximately 83 sales which
could be a result of not all 2016 sales being recorded.
Entry level property is continuing to be affected by
house and land package deals creating a price ceiling
for existing, established stock. Developers continue
to supply product with approximately eight estates
releasing further stages. Until stock levels decline,
there is likely to be limited growth in this market.
The end of the $12,000 grant for new land or new
house and land packages under the Building Better
Regional Cities Program grant on 30 June 2016 may
see some slow down in sales rates for the eligible
estates.
Rental demand appears to have stabilised after a
period of growth, however supply remains tight.
Generally a new 4-bedroom, 2-bathroom home can
achieve in the range of $350 to $370 per week rent.
There appears to be increasing confidence in the
higher priced market with approximately 25 settled
sales over $600,000 since 1 October 2015. We
are also aware of a recent contract at $1 million
for a Dundowran Beach property and another at
$940,000 for an Esplanade property in Urangan.
Emerald
In the first quarter of 2016 we saw another softening
in the market across the Central Highlands which
includes the towns of Blackwater, Emerald, Capella,
Clermont, Moranbah, Dysart and Middlemount.
The first half of 2016 was predicted to show us
exactly where we are at after a massive scaling back
in the resource sector. Things now appear to be near
the bottom for the time being if not already there.
The local resource sector has been relatively stable
with no drastic employment or wage cuts recently.
There has actually been some slightly positive news
on the horizon but this has only been talk so far. The
Adani project continues to linger in the background
Month in Review
June 2016
Residential
46
and if it was to go ahead it should definitely stabilize
our markets and put a definite halt on the slide and
possibly a line in the sand where we can say it has
bottomed.
Strata units and multi-unit
properties across the region have
been the hardest hit. We are
seeing some vacant land sales in
the fully mining dominated towns
at $15,000 to $20,000.
These are mostly being purchased by speculators.
We are seeing values back near 2004 and 2005
levels just after the boom began.
There does not appear to be any possible capital
growth in our markets for the foreseeable future
but some purchasers are starting to speculate and
prepared to buy and sit. Even a small boom in the
resource sector down the track could see some
handy capital growth returns for those purchasing
in the current market. Some say it will definitely
happen, it's just a matter of when.
Bundaberg
The residential market for houses and units has
remained steady and consistent over the past six
months with overall confidence being subdued. The
rate of mortgagee in possession valuations has
remained steady and is tracking to current market
expectations.
There are a few major upcoming developments in
the pipeline including commercial and residential
developments along with the waste water treatment
plant and plasterboard manufacturing plant at
The Port. As these developments move forward
confidence in the market should lift throughout 2016.
In the outer rural residential sector, sales have been
occurring on a slow to static basis over the past six
months. Affordability is considered to be a major
factor. Buyers are mostly owner-occupiers with
the majority of sales under $250,000. Residential
housing predominantly consists of older dwellings
of various styles and standards, as well as larger
rural residential home sites on the outskirts. Overall,
properties in rural locations appeal to a smaller
market sector and typically take a longer time to sell.
Gladstone
The Gladstone property market and local economy
have continued on a downward trend for the first
half of 2016. Major employers in the region have
cut hundreds of jobs in the past six months. Rio
Tinto Yarwun has just completed the latest round
of redundancies and NRG (power station) and QAL
(refinery) completed their cost cutting measures
earlier in the year. In addition, there are still several
thousand local employees working for Bechtel on
Curtis Island, most of whom will be without work
within 12 months. New job opportunities in Gladstone
are very weak and without a major project on the
horizon, the Gladstone economy is likely to remain
subdued.
These job losses have had and will continue to have
a direct effect on the already over-supplied property
market in the Gladstone region. Despite early signs
of stabilisation at the end of 2015, the market for
established housing appears to be continuing to fall
in 2016. Sales of units and townhouses have picked
up marginally over the past several months however
value levels are showing very significant declines in
value. A few examples include:
•	 A part renovated high set home in the established
suburb of Kin Kora sold in July 2015 for $410,000.
It sold again in March 2016 for $363,000
representing a $47,000 loss (11%) in just under
nine months.
•	 A penthouse unit in a marina front medium rise
complex previously sold for $1.525 million in 2011
and sold for $810,000 in 2016 reflecting a 47%
discount.
•	 An older, central suburban townhouse which
previously sold for $295,000 in 2011 is now under
contract for $75,000, reflecting a 75% discount.
Month in Review
June 2016
Residential
47
Vacancy rates in the Gladstone region have
continued on their upward trend. The most recent
data indicates a vacancy rate of approximately 11%.
With the number of recent job losses, it is expected
that this rate will continue to climb. This rate has also
had a flow on effect to rental levels which continue to
decline.
Current market conditions feature a significantly
large number of properties for sale and for rent,
significantly declining rental levels and high vacancy
rates. The market remains liquid albeit there has
been a relatively low number of sales over the past
six months. Mortgagee in possession sales activity
is also increasing. These factors are adversely
impacting the marketability and value of all property
in Gladstone.
Rockhampton
As predicted in January, to date 2016 has proven
to be a difficult year for the Rockhampton and
surrounding residential markets. We have continued
to experience a slow down in almost all sectors of
the market with the overall number of sales reducing
and values softening. A genuine lack of investors has
seen the market relying on local first home owners
and young couples upgrading from their first or
second home.
Selling agents have reported extended marketing
periods with a notable lack of interest whether it be
at open homes, internet or phone enquiry. The key
message out there is that if you want to sell your
home it has to be priced accordingly and the first two
to four weeks is the key. Anything after that and you
risk sitting on the market indefinitely and having to
lower your list price significantly. As predicted it is
the lower end of the market (sub $250,000) which
seems to be at risk with a massive oversupply of
listings and limited buyers.
Again recent investor suburbs such as Gracemere
and Zilze are still very slow. Unfortunately the
number of mortgagee sales has continued with sale
prices often resulting in significant decreases. Once
again better quality properties which have been well
maintained and are located in sought after locations
(parts of Norman Gardens, Frenchville and The
Range) seem to be more saleable although they also
need to be priced accordingly.
Looking forward, the Federal electron will present an
opportunity for local stakeholders to raise concerns
and call for solutions to the resource and local
industries but the time for these promises to come to
fruition is often longer than expected. 2016 will likely
remain slow however there is some thought amongst
the punters that we are now at the bottom of the
market and from here there can only be one way up.
Mackay
In January this year we wrote “There is still a
relatively negative outlook among buyers and sellers
in the Mackay region and market evidence suggests
that property values are still declining in the short
term. It is difficult to see any growth in values in 2016
without some big momentum shift in the Mackay
economy. However it is hoped that some levelling will
occur towards the mid to latter half of 2016.”
The first half of 2016 has been pretty tough for the
Mackay property market on the back of a difficult
2015. The negativity seen in the market place is
still evident, with property values still declining in
the first six months, albeit at a much slower rate
of decline than seen in the past two years. On the
positive side, we have seen increased sales volumes
(although at lower value levels) and the REIQ March
Quarter Vacancy Report states that rental vacancies
have dropped from 9.3% to 8.1%. This is a significant
improvement and the lowest vacancy rates seen
since 2014.
The downturn in the market has provided
opportunities not seen in Mackay in over ten years.
Previously, Mackay had one of the highest median
house prices in regional Queensland, with housing
affordability a major challenge. With the large fall
in values and historic low interest rates, we have
seen among others, first home buyers re-enter the
Month in Review
June 2016
Residential
48
market, able to buy average style highset homes in
established suburbs for low $200,000s.
The main issue for the Mackay market is the negative
sentiment. As stated in January, without some major
momentum shift in the Mackay economy, it is difficult
to see any growth in the market in the short term.
Whitsundays
The first half of 2016 has seen residential entry level
units weaken with limited activity. There still however
appears to be steady sales in the family entry market,
with some out of town property investors creeping
into the market.
The residential lifestyle properties appear to be
holding steady.
We have seen some beach front
land sell in excess of $1 million
however the upper level unit
market appears to be slow with
very limited market activity.
There are new land developments just coming onto
the market with beach fronts and good views, so
make sure you tune in to future editions of the Month
in Review to see how these go.
All in all the Whitsundays appears to be holding
steady.
Townsville
At the halfway mark for 2016, Townsville’s residential
property market remains at the bottom of the market
cycle and continues to languish with low buyer and
business confidence and job security concerns all
impacting property market sentiment.
Talk and concern around the job losses of 800
people from QNI and the flow on effect to other local
businesses has somewhat dominated the market
during the first half of 2016 as it seeks some form of
traction. With payments reportedly starting to trickle
through to some of these workers, let’s hope it can
provide some financial relief to these families and
ease some of the anxiety within the property sector.
Demand within the new home and new unit markets
remains low, compounded by ongoing affordability
concerns with buyers only purchasing property they
consider affordable based on their current economic
circumstances and the ongoing cost differential
between established versus new housing.
The rental vacancy rate remains elevated above
balanced market conditions with our latest rent roll
survey for April showing a trending overall vacancy
rate of over 6%. Anecdotal evidence suggests that
people who have lost jobs and have been unable
to find employment again in the region have left
Townsville and have left the rental market or placed
their homes into an already saturated rental market.
Furthermore the current high unemployment rate is
not attracting new people to the area to absorb this
oversupply of rental stock.
It is likely that the remainder of 2016 will be subdued
in the residential property sector as the low levels
of sentiment filter through. There are definitely
positives in the market if you are looking to enter the
owner-occupier market for the first time with soft
median houses prices and anxious vendors making it
very much a buyer's market.
Month in Review
June 2016
Residential
49
Adelaide
The outer northern suburbs (Playford council area)
comprising areas close to Elizabeth and the Holden
manufacturing plant continue to experience negative
sentiment with the effects of the imminent closure of
the plaint in 2017 yet to transpire. Chicken producer
Ingham has recently announced it will spend $275
million doubling the size of its South Australian
operations. This will create an additional 850 jobs
with the company looking to target workers set to
lose their jobs in car manufacturing. The expansion
will hopefully create new direct and indirect jobs for
South Australians with Ingham focusing on two key
areas – northern Adelaide and the Murraylands. We
will monitor the market in coming months to track
the impact this has on the northern property market.
Detached housing under $450,000 within 15 to 20
kilometres of the CBD is experiencing reasonably
good demand. This is likely to be attributed to this
price point being an affordable option for investors
and first-home buyers. The unit and apartment
market remains relatively flat. In the CBD, two
large apartment developments (Vue and Vision
on Morphett) have been recently completed with
pending settlements. We will be monitoring the effect
this increase in supply has on this market segment
particularly regarding rental property supply.
Popular beachside suburbs such as Henley Beach and
Grange are also experiencing good demand. The sale
of a renovated bungalow in Grange attracted a high
level of interest when sold at auction in March. The
property which sold for $1.51 million offered good
quality accommodation on a substantial allotment
along with a swimming pool and entertaining area.
Source: realestate.com.au
Quality housing in suburbs within ten kilometres of
the CBD continues to experience good demand. A
renovated symmetrical cottage in Evandale (some
four kilometres from the CBD) sold at auction in
April. The auction was attended by over 80 people
with 20 registered bidders. With an initial price
guide of $715,000, the property eventually sold for
$898,000.
Source: realestate.com.au
There are a number of new infrastructure projects
currently underway in Adelaide including the Torrens
to Torrens project, O-Bahn busway extension and
Darlington road upgrades. All of these projects have
recently commenced.
Month in Review
June 2016
Residential
South Australia
50
There is ongoing investment to improve South Road.
The Torrens Road to River Torrens Project (Torrens
to Torrens) will deliver a four kilometre non-stop
roadway (incorporating three kilometres of lowered
motorway), between Ashwin Parade, Torrensville
and Pym Street, Croydon Park, providing significant
travel time saving to commuters and freight. The
total project cost is in the vicinity of $896 million.
The Department of Planning, Transport and
Infrastructure website states that the concept design
includes:
•	 A four kilometre non-stop section of roadway
(incorporating the lowered road section) between
Pym Street, Croydon Park, and Ashwin Parade,
Torrensville
•	 A three kilometre section of lowered non-stop
motorway from Pym Street, Croydon Park to
Gawler Avenue, West Hindmarsh
•	 Parallel surface (at-grade) roads along the length
of the lowered motorway to connect most local
roads and arterial roads to South Road
•	 An overpass of the Outer Harbor railway line
•	 Intersection upgrades at Pym Street, Torrens
Road, Hawker Street, Port Road and Grange Road
•	 Improved cycling and pedestrian facilities
•	 Landscaping and noise barriers (where required)
Source: www.infrastructure.sa.gov.au/nsc/torrens_road_
to_river_torrens_project and t2talliance.com.au
This improvement is unlikely to benefit any specific
suburb with the greatest benefit likely to be for
industry with improved travelling times and ease of
movement.
The DPTI website states that: "The O-Bahn City
Access Project builds on the State Government’s
significant investment in a stronger public transport
network. The primary objective of the O-Bahn
City Access Project is to improve travel times and
reliability for users of the O-Bahn service between
the end of the busway at Gilberton and Grenfell
Street and to reduce traffic congestion and delays,
particularly on the Inner Ring Route.
The project will extend the O-Bahn system from the
end of the busway at Gilberton into the cross-city
priority (bus) lanes on Grenfell Street. The project
will include the creation of centrally aligned priority
bus lanes along Hackney Road and a dedicated bus
tunnel from adjacent the National Wine Centre to
near Grenfell Street, providing quicker, more reliable
access for O-Bahn buses into the city."
Month in Review
June 2016
Residential
Source: http://www.infrastructure.sa.gov.au/public_
transport_projects/o-bahn_city_access
51
The Darlington Upgrade Project should see travelling
times reduced for the southern suburbs. It is the
next step in the upgrade of Adelaide’s North-South
Corridor and will deliver an upgrade of approximately
3.3 kilometres of the existing Main South Road,
including:
•	 A non-stop motorway between the Southern
Expressway and Tonsley Boulevard
•	 A lowered, non-stop motorway passing
underneath Flinders Drive, Sturt Road, Sutton
Road/Mimosa Terrace and Tonsley Boulevard
•	 Grade separation of the Main South Road/Ayliffes
Road/Shepherds Hill Road intersection
•	 Main South Road (at grade) service roads along
both sides of the lowered motorway to provide
connections to Flinders Drive, Sturt Road and
most local roads
•	 Full free flow interchange at the Southern
Expressway/Main South Road with dedicated
ramps providing direct access to the new
motorway and Main South Road
Source: http://www.infrastructure.sa.gov.au/nsc/
darlington_upgrade_project
All of these projects will provide Adelaide with
improved roads and infrastructure. Given the
continued urban sprawl, improved access to the city
is a positive for property owners situated away from
the CBD. The general effect these projects are likely
to have on property prices will be evident once the
projects are finished in the next couple of years.
The Darlington Upgrade project in particular will
improve accessibility to the CBD for suburbs south
of Darlington and users of the Southern Expressway.
The impact on property values will not be evident
until completion of the project in the next couple of
years but it is likely to be positive.
Mount Gambier
The property market in Mount Gambier is currently
relatively stable. There has been a slight decrease in
house sales for the first quarter in 2016 compared
to the first quarter of 2015, however sales are still
noticeably higher than they were in 2011 when sales
levels had softened. The chart below shows that
in the first quarter of both 2014 and 2015 sales
numbers were up on previous years dating back
to 2009/10. This is a positive sign for the Mount
Gambier housing market. Sales numbers tend
to indicate that the Mount Gambier market has
stabilised and we are returning to the sales numbers
experienced in previous years when there was more
positivity in the local property market.
Month in Review
June 2016
Residential
52
Sales evidence indicates that most of the dwellings
sold in Mount Gambier in the first quarter of 2016 are
in the price range of $250,000 to $300,000. This is
a reflection of the first quarter of 2015.
The price range of $250,000 to $300,000 is
affordable for owner occupiers entering the market
and for investors looking at property that provides
a stable rental return. Dwellings under $150,000
are generally in less sought after locations and have
limited market activity. Dwellings over $500,000
are at the top end of the market and have a reduced
market segment.
Unit sales for the first quarter of this year are also
similar to the first quarter of 2015, with the most
popular range being $150,000 to $200,000.
The upper price range in Mount Gambier is showing
good signs, with dwellings between the price range of
$400,000 to $450,000 having doubled compared to
the first quarter of 2015 and with three houses selling
for over $500,000 this quarter. In the first quarter
of 2015, there was only one sale for $500,000. The
three properties that sold for over $500,000 in the
first quarter of 2016 are listed beside.
5 Queens Avenue, Mount Gambier – $580,000
24 Power Street, Mount Gambier – $567,000
10 Dawn Court, Mount Gambier – $560,000
There is an optimistic outlook for the remaining half
of 2016 and overall, we are expecting this year to be
quite similar to last year with no major fluctuations in
the local market.
Month in Review
June 2016
Residential
53
Tasmania’s state economic data continues to remain
relatively stable with unemployment at 6.6%, up
slightly (0.2%) since the end of 2015 but 0.8%
lower than at the same time last year while the
gap between Tasmanian and the national average
unemployment rate has widened. The Australian
Bureau of Statistics measure of job vacancies for the
state remained stagnant for the past year departing
from the national average where gains were made.
Building approvals continue on a downward trend and
are somewhat lower than at the same time last year.
This cooling could be attributed to the shrinking
First Home Builders Boost (FHBB) grant. The grant
was reduced from $20,000 on 31 December 2015
to $10,000 on 1 January 2016 for first home buyers
or builders of new residential dwellings. Some land
developers appear to have anticipated this cooling
towards the end of 2015 and were attempting to
bring forward demand with advertised incentives
such as new cars and gift vouchers. Incentives were
also extended to the building industry and are still
being offered.
Tasmania’s future economic focus continues to
be predominantly education, tourism and food
production. Educational developments include a
$10 million redevelopment of Latrobe High School;
approval by Hobart City Council of a $90 million
University of Tasmania performing arts hub; and
a $3.6 million refurbishment of the South Hobart
primary school.
In tourism, the following developments have recently
been announced; government funding for several
regional festivals and tourism events; a $40 million
runway extension at Hobart; an increased number of
Qantas flights into Hobart; a $2 million upgrade of
the South Cape Track; Regional Tourism assistance
to help development and expansion on Bruny Island
for a visitor experience centre by Bruny Island tours
and expansion of Bruny Island Cheese Company’s
cellar door; a $300 million capital works project to
be implemented over ten years to upgrade the Sandy
Bay shopping precinct; road and pedestrian access
improvements within Hobart.
Recent agricultural developments include: assistance
to rebuild and monitor the affected Pacfic Oyster
Mortality Syndrome industry; approval of the
Southern Highlands irrigation scheme; opening of
the Blue Banner pickled onion processing plant in
Ulverstone; investment by Bosch into a Tasmanian
agricultural technology company enabling them to
expand their operations and develop a global outlook
with global licensing.
The Tasmanian residential property market continues
to experience small annual increases in sales volumes
across the state and in some areas, stock shortages
have seen some capital growth in the major
population centres. Statewide centrally located
suburbs that contain a good range of facilities, larger
infrastructure such as shopping centres, educational
and health institutions and public transport tend to
be popular with renters and purchasers alike and are
viewed as having the best capital growth potential.
Kingston, Howrah, Blackmans Bay, Glenorchy, New
Norfolk and Sandy Bay are suburbs where the
greatest sales volumes have occurred recently in the
south, while in the north the suburbs of Riverside,
Newstead and Newnham have experienced the
greatest recent volumes of sales. In the north-west
region, Devonport has seen the greatest number of
sales.
Month in Review
June 2016
Residential
Tasmania
54
Darwin
As we near the mid way point of 2016, there is not a
lot to cheer about in the Darwin residential property
market. The market started to come off some 18
months ago, although 2016 appears to have seen the
worst of it. There isn’t one specific factor that single-
handedly changed the market direction; it appears
to be numerous factors working simultaneously on a
micro and macro level, creating great uncertainty in
the market.
On a local level, the removal of the first home owners
grant (FHOG) on existing property at the end of 2014
had an immediate impact on older unit stock that
was usually a popular entry level property for first
home buyers. Most notably older units in Palmerston
felt the pressure first, sales evidence showing a unit
purchased at the height of the market at the start of
2014 is now worth 25% less some two years later.
As promised by the government,
a large amount of land has been
released over the past few years
to ease property prices and with
the FHOG’s only being available
on new stock, this became a more
appealing option to young buyers.
With most of the new estates such as The Heights,
Durack, Bellamack and Muirhead now complete or on
their final stages, the majority of the available land
can be found at Zuccoli. Sales of vacant land have
eased and prices have come back as developers try
to attract people into the market.
You can’t talk about the property market in Darwin
without mentioning Inpex and the phenomenon
it created. A large supply of workers arrived on
Darwin’s doorsteps some years ago needing a place
to rent. The injection of people to the population
was so rapid, rents sky rocketed with people willing
to pay above market to secure a roof over their head.
Developers, excited by the high demand and limited
supply, began construction but Rome wasn’t built in
a day. The delay of the new stock meant we had to
ride out the high rentals until the new stock became
available. Fast forward to mid 2016 and final touches
are being put on some of the brand spanking new
units in town ready to be occupied but rents have
fallen and there are very few investors in the market.
Many of the pre-sold units are already worth less
than their initial purchase price.
On a broader scale with mining quieting down,
activity across the equator in China easing and banks
tightening up their purse strings, Darwin has felt the
effects like the rest of Australia. All as the Reserve
Bank of Australia announces another interest
rate cut trying to inject some stimulation into the
economy.
Unfortunately for home owners in the top end, no
one has been immune to the falling market with sale
prices coming back and more worrying the volume
of sales down a dramatic 31.6% (REINT RELM) from
March 2015 to 2016.
Unfortunately there is no silver lining at this stage.
We don’t know if we’ve hit rock bottom yet and
there isn’t any big project on the horizon to spur on
the market again. With both Federal and Territory
elections scheduled for mid year, it’s safe to say we
are in a wait and see period.
Alice Springs
It has been more of the same in Alice Springs
following the removal of the First Home Buys
Grant for existing dwellings in December 2014. Low
transaction numbers are having a significant impact
on the market, particularly at the lower priced entry
level segments. There were only 339 sales in the
broader Alice Springs market in the year to March
2016, down from 480 in the previous corresponding
period and down significantly from the mid 2000s
which saw sales numbers in excess of 700 per
annum.
There are positives however, with the new
development at South Edge nearing completion
Month in Review
June 2016
Residential
Northern Territory
55
and sold out featuring 2-bedroom, 1-bathroom
townhouses ranging from $335,000 to $380,000.
Other areas performing well are in rural residential
with four settled sales in excess of $750,000.
The golf course area (Desert Springs) also performed
well with four sales in excess of $750,000. A
renovated 3-bedroom, plus study and 2-bathroom
rendered brick dwelling transferred at $830,000
(pictured below) and a rural residential property is
currently under contract (advised unconditional) at
$1.25 million.
The upcoming election will be important for the
local market which does not have any incentives for
first home buyers for entry level properties such as
older style units and houses under $500,000 both
of which have experienced significantly lower sales
volumes.
Month in Review
June 2016
Residential
56
Perth
As forecast, we find ourselves at the mid point of the
year and still wondering if the market is approaching
the bottom of the cycle or whether the decline in
activity will continue for the remainder of 2016.
According to the Real Estate Institute of WA, sales
activity in the March quarter decreased by some
33%, from 8,798 in the December quarter to just
5,852 in the first quarter of 2016. Over the same
period of time, listings on the market increased by
6% to 15,277, well above historical averages and
some 3,000 to 4,000 above a balanced market. It is
likely that this figure may continue to increase over
the traditionally subdued winter period.
Interestingly, first home buyers
have increased their presence in
the market and comprised 45%
of all activity in the quarter, a
figure that is a almost unheard
of in the absence of a substantial
government grant.
This activity assisted to decrease the median sale
price from $545,000 in the December 2015 quarter
to $520,000 at present.
Bucking the trend, the median sale price of vacant
land has increased by 13.1% over the previous 12
months and by 8.9% in the March quarter, with the
majority of transactions being for smaller allotments
– possibly related to the heightened level of first
home buyer activity. In fact, we remain very cautious
about the market for vacant land, particularly in
urban fringe localities, as the differential between
established housing prices in sought after areas and
new house and land packages in inferior localities
continues to dissipate.
Similarly, areas which have traditionally attracted
significant levels of investor interest are struggling to
find their feet. A combination of a lack of confidence
and restrictions in lender financing have put the
brakes on many areas previously targeted by
investors and speculative developers. This situation
becomes more dire in several regional centres where
many lenders are restricting financing on a postcode
basis, severely limiting the ability of potential buyers
to secure finance and therefore exacerbating the
decline in values. Established housing in many well
established localities is approaching land value in
comparison to the prices being asked (and paid) in
some outlying, traditional first home buyer areas.
Many agents are indicating an uplift in enquiries
over the past four to six weeks, however we have
been through several of these mini cycles in different
areas over the previous 18 months. The difference
in this instance may well be the latest interest rate
reduction by the RBA. We have received feedback
from several finance brokers that their clients were
or are waiting for fixed rates to be reduced before
committing to an upgrade of property or location.
This may result in some pent up demand and a spike
in activity, however we caution that we do not expect
values to improve in the short term.
Amongst all the negative statistics, we are seeing
many positives in the current market – assuming
you are a buyer who has a stable financial position.
Many desirable areas have seen downward pressure
on values, hence we are hearing about (and seeing)
many contracts that appear to be well below current
market parameters and indicate a level of bargain
buying occurring from forced sellers. Given the high
level of first home buyer activity in the market, we
anticipate a wave of trade up transactions to occur
throughout the remainder of 2016.
South West WA
Throughout the South West of Western Australia
there is a reduced level of sales with a weakening of
values throughout the lower and middle segments.
The top end of the market continues to be
problematic, with continuing weak demand and an
over supply of properties for sale, coupled with a
lack of prospective purchasers in that value range,
resulting in downward pressure on values.
Month in Review
June 2016
Residential
Western Australia
57
The rural residential market is also continuing to slow
with the majority of sales being below $1 million. This
market is also experiencing extended selling periods.
Vacant land values have now started to level after
seeing a correction throughout the first half of 2016.
Building activity has continued to weaken over the
past six months, however the month of April saw an
increase in the number of new homes sold, indicating
a levelling out.
Rents have fallen significantly in the past 12 months,
particularly in the outerlying residential estates.
Smaller lot developments in the new subdivisions
have become popular due to their affordability and it
is anticipated that this will be a trend going forward.
This is showing in the move away from larger homes
to the smaller, better appointed homes on small
blocks, with limited gardens and the ability to lock
and leave.
Overall it is likely the property market in the South
West for the remainder of 2016 will be slow. The
swings of the Perth market during the past several
years have been missed in the regions but we would
recommend caution as the slow down in the state
resource sector, continued weakness in Perth and
general economic uncertainty could promote more of
a widespread downturn throughout the market.
Esperance
As we head towards the middle of the year, it is time
for a mid year review of the market performance in
the Esperance district. In short, quiet is the best way
to describe it. Small bursts of activity then nothing
have been the norm for the past six months and a
smoother spread would be welcomed.
2015 slowed in the final months and there really
hasn’t been any traction since then. Part of the
reason is seasonal with cropping programs well
underway after a reasonably traditional break to
the season however there seems to be a generally
cautious sentiment with prospective purchasers
delaying activity until the signs of broader economic
improvement are consistent. With there still being
relatively low interest rates and a broad spread of
affordable housing, it is hoped that the lack of recent
activity is only temporary and that regular volumes
will return in the near future.
The residential market in Esperance has seen low
sales volumes across the board however values
for the most part indicate consistency. Values in
the lower socio economic areas have marginally
improved as purchasers realise these areas provide
some of the most affordable housing in the region,
are well located close to schools, shopping and
recreational facilities and can provide the best
return on investment for residential property with
correspondingly high rentals relative to capital
outlay. A higher volume of sales in excess of
$200,000 have occurred compared to the same
period last year.
The mid tier market of say $300,000 to $450,000
has seen consistent activity and this range is well
represented in volumes and values with a relatively
stable correlation between supply and demand.
Sales over $500,000 have improved over the
corresponding time last year with some sales
interspersed through the $600,000s, $700,000s
and $800,000s price ranges. Prestige residential
property is limited in this area and we have seen two
sales in excess of $1 million compared to none over
the same period last year.
Rural residential lifestyle properties have maintained
their consistency in sales volumes with realised sales
over all price ranges noted. Lower end property with
modest houses and negligible outbuildings have
achieved prices within the $400,000 to $500,000
range with other sales pushing upwards to the
$900,000 range for more substantially developed
properties.
The satellite localities of the Esperance shire have
had little to no activity over the first half of the year
due to limited supply.
Encouragingly, the small coastal town of Hopetoun
has seen sales volume increase slightly over varying
value ranges which is giving some hope that values
Month in Review
June 2016
Residential
58
there may have stabilised. There is still an issue with
an extensive oversupply of property, especially rural
residential land, but in time it is hoped that supply will
gradually reduce and allow values to recover.
To the north, Norseman is still struggling with
uncertainty over local mining operations however
sales volumes have been strong in comparison to
recent years, although at the low end of the market
with most transactions typically ranging between
$30,000 and $45,000 for established homes,
which is actually a minor improvement over the
corresponding period last year. A general consensus
is although there is a lot of uncertainty in the local
market, Norseman still provides some of the most
affordable housing in the state, if not the country,
for an isolated town having a moderate level of local
services.
So, market activity over the first half of the year has
been quiet. Some more notable transactions have
occurred on the back of lower sales volumes and if
seasonal conditions remain strong, overall sentiment
will still be cautiously optimistic for this region.
Month in Review
June 2016
Residential
Rural
60
Overview
With all the activity in the rural property market
and the continuing reduction in interest rates (good
for borrowers, not good for investors), this month, I
set the team the challenge to think about what they
would do if they had a lazy $10 million to invest into
the rural sector. There is, however, a specific dairy
review from David Leeds in Victoria, in lieu of the $10
million task, given what is currently unfolding in the
sector and implications for values.
Some interesting thoughts and scenarios have
been provided which you can read below, however, I
thought I should also consider the question of if that
lotto ticket did indeed materialise, what would my
game plan be the first $10 million?
So what do I think? Firstly, I have more of an investor
mindset than operator, given the job I do. As an
investor, I am thinking about property cycle as part
of my outlook. Based on the Herron Todd White
grazing property index, we are towards the start of
the next upward run in land values, being about eight
years up, followed by eight or so years negative to
flat growth. If this trend from 1980 is correct, the
immediate market is looking sound to invest. While
it would be great to buy into the family business, my
brothers may have a different idea. So where would I
place my dollars?
The beef sector has kicked on the back of the
commodity outlook; this is one to watch. However,
the jump in values in some regions may impact the
return outlook in the shorter term. Permanent tree
crops have experienced strong growth in values,
underpinned by good export opportunities and sound
commodity pricing. However, the almond prices have
reduced approximately 40% in the last six months,
so it will be interesting to see where this lands. If,
however, water is secure, the regular cash flow
outcomes do appeal on a long-term basis.
The poultry market is possibly the most stable
(chicken meat). While fundamentally, it only has
domestic demand, this demand has a long history
of around 3% per annum growth in demand.
Furthermore, supply and demand are largely in
balance and as one grower recently reflected to
me, “we do not get droughts in the chook sheds”.
Returns in the range of 7% to 12% per annum are not
uncommon in this market.
In the cropping and dairy sectors, global supply
forces the pricing on these commodities to levels
where, in my view, make a return more volatile. With
the build-up of grain stockpiles, this may take some
time to adjust.
The sheep industry is, for me, the one where the
reduction in the national flock (along with New
Zealand reduction) and also the changing focus from
wool sheep to a meat sheep, or indeed the meat wool
hybrid, provides opportunity for diversification. Both
wool and lamb/mutton markets are reflecting the
reduction in the national flock and therefore, supply
and demand are more in balance. Sheep are also
a global commodity, without, in my view, the same
exposure to supply opportunities, as beef, grain,
diary and sugar. The other aspect of this country
type is typically, they are mixed farm operations.
Therefore, I get some cropping opportunity and
maybe even some land development, or there is the
chance to run an organic product, which is a growing
market within the broader sheep meat market.
As for my lazy $10 million, I would look to the sheep
sector and have poultry as the other target, for now.
Reading the contributions from the team, it makes
one think about investment money and moving into
a multi-commodity investment which seeks to get
the best mix of yield and growth investments within a
portfolio managed by good operators. I wonder how
far away one of these may be in the offering.
My challenge is however, as a non-operator, I
would be looking to find good farming families with
structure; a plan for growth; and clarity on their
succession plan in order to form a relationship to
invest alongside that structure which would provide
mutually beneficial outcomes and give the family the
opportunity for growth with equity capital not debt
capital.
Month in Review
June 2016
Rural
61
So back to work to see how to get the $10 million
together, as my lotto ventures are about as good as
my tips at the races (on the maybe one day a year I
actually have a bet).
Enjoy the read from the team.
Contact:
Tim Lane – 07 3319 4403
National Director, Rural
Southern Queensland
While all the hype seems to be at the big end of town,
there are many smaller family farming operations
kicking some well earned goals in the agricultural
space at present. There has been a noticeable
increase in property transactions across most price
brackets though it is those sales in the sub $10 million
that really show the level of optimism and confidence
in a range of different agricultural sectors at present.
Those in a position to do so are capitalising on
low interest rates, generally improved commodity
prices and positive market sentiment by increasing
not only their stake in land but also relevant
infrastructure, research and development. It is this
type of investment that will improve efficiencies and
production output for their respective enterprises.
If I had a lazy $10 million to invest I would be looking
at the various options currently out there.
One of them would be looking for a smaller though
successful business model that required capital
to further expand as opposed to starting from
scratch with many unknowns. There is value in the
businesses that have endured the tough times and
been innovative enough to survive and prosper
through varying market cycles. Humpty Doo
Barramundi is an example of such a business in
the aquaculture sector. The company has done the
hard yards and is now looking to expand production
significantly. In this case they may be able to self
fund expansion though it provides an example of a
successful business selling to a niche market that
seemingly can’t get enough of the quality product.
Within the past three years there have been
sales of some larger cattle grazing properties in
Queensland where the purchasers have been city
based individuals or companies looking to diversify.
In certain cases these parties have secured a pre
commitment to lease these properties back to larger
cattle companies with fully integrated business
models thus providing a return on investment for the
purchaser and the likelihood of capital gains through
further development and capital outlay. Under such
a scenario I would be hopeful of an investment yield
of 4% to 6% before capital gains depending on the
asset.
There have also been transactions where the
purchaser has chosen to source experienced local
managers to run a beef enterprise in their own right.
The return under this option is likely to be higher
which is reflective of the greater risk and input
involved.
In terms of land I think there is value in buying run
down or under developed properties in safer rainfall
areas and in reasonable proximity to markets. These
types of asset have the potential; they just need
the knowledge and capital for improvement. The
difficulty now is finding the right type of asset in the
improved market. At the bigger end of town there is
less competition though seemingly less large scale
fully integrated options available.
I have outlined several investment options which I
think all have merits. If I had to choose one I think
I would stick to what I know and try to purchase a
larger scale cattle grazing property in south-east
Queensland or north-east New South Wales. I think
there are opportunities to buy country in this region
between $3,000/AE to $5,000/AE depending on the
quality and development of the asset. I would then
look at stocking the property myself with cattle that
targeted a specific area of the beef market such as
Organic, Certified Grass Fed Beef or Wagyu. I would
also leave some funds in the bank for working capital
and future development.
Contact:
Digby Makim – Ph: 07 4622 6200
Month in Review
June 2016
Rural
62
Central QLD
We have been given the task of providing our opinion
of where we would place $10 million in capital in
the event we were so fortunate to have this type of
money at our disposal. This question is actually one
that we are often asked in passing conversations.
Will McLay and I (Michael Chaplain) have put our
heads together, and this is what we have come up
with:
There are plenty of areas around Central Queensland
that stand out from a lifestyle perspective - rolling
hills of wall to wall Buffel grass with the views only
inhibited by the odd scattering of Bottle Trees.
Districts such as the Dawson Valley, Bauhinia Downs
and Arcadia Valley certainly spring to mind as great
places to raise a family and produce prime beef (or
crops).
However as far as looking at acquiring assets
from purely an investment perspective, there are
additional factors that come into play.
First and foremost there needs to be a clear
investment scope, which sets out the how, when and
where of the investment approach and execution.
One of the primary considerations is what return on
investment (ROI) is required or anticipated, as well
as how this return is matched with an investment
horizon, meaning how long are you willing to wait
before realizing your return. For example, do
you want a higher annual return with a shorter
investment horizon, say five to ten years, or a lower
annual return over a longer investment period, say
ten to 20 years or longer?
The above scenarios may sound simple on paper,
however there is one primary variable that is
somewhat more difficult to predict than the supply
and demand equations and market cycles which most
other industry sectors do not have to contend with
- weather. Seasonal changes are almost impossible
to predict and can have a catastrophic impact
on the bottom line of an agricultural enterprise.
Most readers are now probably thinking “tell me
something I didn’t know”, but bear with us. Although
we cannot control or even predict (with any strong
degree of long term accuracy) the weather, we
believe you can structure an investment vehicle
which reduces the risk of low or negative returns
due to unfavourable seasonal circumstances or
commodities prices.
We believe investing in a cross section of
commodities would assist to deleverage the level of
risk of an agricultural investment. Bearing in mind we
are working with the industries and commodities that
are currently available within Central Queensland,
our three commodities of choice would be beef,
horticulture and one other non agricultural asset
(e.g. large industrial shed or commercial office space
with blue chip tenants). Our rationale behind these
three choices is as follows:
Beef
Beef cattle grazing assets which are lower to mid
range scale (about 2,000 to 6,000 adult equivalents)
are usually readily available in the market place.
Management of these assets is relatively straight
forward, however there is also a tenant market
for short and long term leasing. Cash returns are
generally low and seasonally dependant, which can at
times produce a negative yield. Recent publications
have suggested that the top 20% of producers are
able to produce sustainable cash returns in the order
of 4% to 6%. Beef assets have over recent decades
demonstrated a relatively low volatility with fairly
consistent underlying growth trends. It appears that
the market accepts this as appropriate offset to low
cash returns.
Horticulture
Horticultural production properties such as tree
cops or small crops are somewhat more intensive in
nature, require higher production inputs and demand
specialised management. These assets can however
provide far more rewarding cash yields when the
business component is appropriately operated.
Underlying land growth is not as proven as beef,
however double digit cash returns are common.
Investment in these industries can offer a good level
Month in Review
June 2016
Rural
63
of exposure to land and water assets, as well as
emerging export commodity markets.
Industrial or Commercial Real Estate
An off farm income stream provided by a passive
commercial investment would be complementary
to an agri weighted portfolio. Off farm assets offer
a more predictable cash flow which is not subject to
the prevailing season or commodity pricing. Be sure
to be well advised when entering this asset group
as market cycles and property specific features can
present dangers for investors.
Buyer groups for agri assets are generally limited
to owner operator families and corporate investors.
In this respect we believe that there is a market
void between these two groups, which could offer
investors the opportunity to target assets in a
less competitive market sector. If this exceeds
your capital limits then an alternative such as co-
investment could offer access to this space. Your
$10 million contribution to a larger pool of capital
(say $30 million), would allow entry into a higher, but
more economical scale asset (essentially making the
dollar extend further), while also giving co-investors
the security that their capital is in the hands of
someone who has a significant financial commitment
to the asset or business.
Conclusions
Based on the brief rationale provided above, we have
decided to allocate the following portions of our $10
million capital to each asset class:
•	 Beef – 60% ($6 million)
•	 Horticulture – 30% ($3 million);
•	 Industrial/Commercial Real Estate – 10% ($1
million)
We believe exposure to a cross-section of assets of
this nature would provide a more stable and resilient
cash yield while affording the ability to weather the
tougher periods and cash in the better years on each
asset type.
A well balance agricultural and non residential
investment portfolio can offer solid cash yields
with underlying assets growth, presenting a more
attractive opportunity than equities or listed
property trusts. This will require a substantial level of
research and potentially time.
Interested? Give us a call.
Contact:
Will McLay – Ph: 0428 612 457
Michael Chaplain – Ph: 0400 968 952
Mildura/Sunraysia
An investor looking to buy a large rural enterprise
will always contemplate how to balance risk and
return. The good news is that many of our key local
horticultural industries are currently experiencing
higher commodity prices due to a range of factors
including a lower Australian dollar, improved access
to some key export markets and reduced global
supply. In the short term, it looks more likely that a
decent return can be generated from crops such as
almonds, citrus and table grapes.
The bad news for an investor is that this
improvement has already created a spike in property
values, particularly in the almond and table grape
market sectors. We feel that values for these
enterprises are right near the peak at present.
Buyers also need to be mindful of the production
risks, which include the availability of irrigation
water and extreme weather events such as frost or
prolonged rain at harvest time.
For a buyer with a high appetite for risk, the timing
might be right to invest in a large scale wine grape
vineyard. The recent increase in the cost of leasing
temporary water has made many growers question
the economics of turning water into wine and we
are aware of several large local vineyards being
either mothballed or redeveloped to other crops. It
is inevitable that production in most inland areas
will continue to decline at a time when large wine
companies are reporting good profits. We do
not expect to see any rapid improvement in wine
grape prices, but at the same time some gradual
improvement now appears likely with some reports
suggesting supply and demand are now balanced.
Month in Review
June 2016
Rural
64
Wine grape returns at current levels are little more
than break even, however there is considered to be
a reasonable chance of vineyard value appreciation
in the medium term. But as an insurance policy,
prospective purchasers or investors should
be looking at vineyards with soil types which
could support other crops, to hedge against the
continuation of wine grape prices languishing.
Returns are probably too tight to share with a lessee,
so buyers considering this strategy might have to
assume the production risk, at least initially.
It is becoming more difficult to secure large scale
greenfield horticultural development sites. For
several years there was little interest in this activity,
however the big almond players have been scouring
the district over the past one to two years. Demand
for this type of property will always be cyclical,
however there could be potential to acquire and
land bank this type of property, generating some
return from dryland farming pending any future
development.
A strategy for a buyer with a lower risk profile
would be to consider purchasing dryland cropping
country in the southern Mallee district. Values
have appreciated dramatically in the more reliable
Wimmera region, further to the south, to the extent
that many Wimmera farming families are now priced
out of the opportunity to expand. Some are likely to
source land in other areas such as around Hopetoun,
Lascelles and Sea Lake if they wish to expand current
operations without paying the premium prices
currently being recorded in the Wimmera. This may
result in an uplift in values over the next few years in
these Southern Mallee areas.
There are examples of long term leases being put in
place for this type of country, providing returns of
around 6%. For a passive investment in agricultural
land, this could be a good opportunity.
Contact:
Shane Noonan – Ph: 0427 735 328
Murray Riverina
Recent cuts to Farmgate Milk Prices (FMP’s) by the
two major manufacturing milk processors in Victoria
have resulted in widespread concern around the
viability of the dairy industry.
While noting that the fundamental long term
outlook for these producers remains unchanged,
relative to where they were prior to the cuts (and
those supplying other processors will not be
directly affected), there are some major challenges
confronting producers and the broader industry to
manage the short and medium term consequences of
the cuts, particularly as they relate to cash flow.
To date, Murray Goulburn and Fonterra are the
only processors to announce cuts to their weighted
average or headline FMP for 2015/16 and at the
current time, neither have provided any guide
for the 2016/17 season. Consequently, the areas
most heavily affected by the cuts are likely to be
those where these processor have a strong supply
footprint, being Victoria, Tasmania and to a lesser
extent, South East South Australia and the Riverina
in NSW.
In more recent years, demand for milk products
have largely been driven by the components in milk
(Fat & Protein), rather than the volume, with a larger
proportion of Australia’s milk being manufactured
into some form of product for domestic or
international sale. To reflect the driver of demand for
the end product, processors moved some time ago
away from a volume based payment system (c/l) to
one which reflects the contribution of the component
of the milk with prices paid on a dollars per kilogram
of Milk Solids ($/kgMS) basis.
Broadly speaking, cuts in the final FMP for the
2015/16 season in late April/early May by both
processors were made from opening prices, in the
order of $5.60 per kilogram Milk Solids (kgMS), back
to approximately $4.75 per kgMS to $5 per kgMS.
Independent industry analysts are forecasting an
opening FMP in the order of $4.50 per kg MS, based
on current market metrics for the 2016/17 season.
The approach to the cuts and the mechanics of any
‘claw back’, have varied between processors.
Month in Review
June 2016
Rural
65
A review of Dairy Australia's Dairy Farm monitor
project annual report for 2014/15 across the
production regions, which will be mostly affected by
the cuts, demonstrates the following variance around
the headline FMP for the 2014/15 season, for the
sample farms across the regions. We have applied
the 2014/15 variance to the revised headline FMP for
the 2015/16 season with the next row recording the
average costs of production for the 2014/15 season
(total variable plus overhead costs including an
allowance for depreciation and imputed labour) as
follows:
N Vic SW Vic Gipps North NSW Sth NSW Tas SA
2014/15 Headline Final FMP ($/kgMS) 6.00 6.00 6.00 6.00 6.00 6.00 6.00
2014/15 Ave Milk Income (Farm Monitor
Sample Group)
6.09 6.16 5.88 7.62 7.28 6.19 6.35
Variance to Headline FMP 2% 3% -2% 27% 21% 3% 6%
Propose Headline FMP ($/kgMS) SAY 5.00 5.00 5.00 5.00 5.00 5.00 5.00
Adjusted FMP for variance based on
2014/15 Farm Monitor Sample Group
5.08 5.13 4.90 6.35 6.07 5.16 5.29
14/15 Cost of production (Fixed &
Variable costs)
5.53 5.42 5.15 7.55 6.11 5.04 6.34
Surplus/Deficit ($/kgMS) -0.46 -0.29 -0.25 -1.20 -0.04 0.12 -1.05
We note that several of the regions are broad
and give a slightly skewed result (e.g. South NSW
incorporates South East NSW which is more closely
aligned to North NSW, along with the Riverland
whose figures would more likely resemble those of
Northern Victoria along with South East SA, whose
figures are more likely to resemble those of South
West Victoria, than the average of SA which includes
some central SA producers).
Though not yet complete, a review of the 2015/16
season suggests that farm business cost structures
are likely to be higher when compared to the 2014/15
base year, for most suppliers. In the Northern
Victorian Irrigation Districts and the Riverina in NSW,
water prices have tracked significantly above 2014/15
levels, which has likely resulted in significantly higher
production costs for producers in these regions. This
is demonstrated by (by way of proxy for the broader
market) the Temporary trade price of Murray Zone 7
Allocation Trade below:
Source Victorian Water Register - http://waterregister.vic.
gov.au/water-trading/water-share-trading
Even assuming minimal increases across most other
cost line items (i.e. assuming the price of grain/hay
is not materially different to the 14/15 season and
subdued inflation across most other cost lines) the
Month in Review
June 2016
Rural
66
increased cost of water, in conjunction with difficult
seasonal conditions, suggest that the breakeven
price in Northern Victoria, in particular, is likely to
be higher in 2015/16 than what it was in the 2014/15
year ($4.99 per kgMS).
While noting the 2014/15 data is drawn from a
stronger milk price year (where cost structures may
have been intentionally higher to maximise on the
higher milk price), it is clear that even the upper end
of the revised FMP for the 2015/16 season is below
the cost of production for most dairy producers
(excluding Tasmania), based on the 2014/15 Dairy
Farm Monitor Report sample group. An allowance
for higher production costs in the 2015/16 season,
relative to the 2014/15 base year, indicates that
deficits will be larger than the figures provided
suggest.
A closing price ranging between $4.50 to $5.00 per
kgMS for the 16/17 season would result in further
deficits being accrued, assuming no significant
decreases in the cost of production. In Northern
Victoria and Southern NSW, the breakeven price may
come under further additional upward pressure as a
consequence of the soft outlook for water allocations
in the 2016/17 season.
Farmers will therefore need to make significant
business decisions as to which course of action to
take. Those who are willing to continue with adequate
equity are likely to need support from financiers
to plot a course through the coming period.
Whereas, those who are willing to continue but have
insufficient equity to fund the deficit, will need to
make alternative plans.
It is likely that those who are unable to find support
will precipitate additional supply in the property
market, in the absence of additional demand, land
prices are likely to slide down the demand curve
until equilibrium is reached with some potential for
distressed assets.
Historically, high prices for irrigation entitlements
across the irrigation districts may offset some of
the downward pressure for land values for those
with reasonable holdings of water. As a proxy
for the broader water market in the southern
connected basin, the following graphs of prices
for High Reliability Water Entitlements (Murray
Zone 7) demonstrates the relative strength in the
marketplace currently:
Conversely, sales activity across the north of Victoria
and the Riverina has been relatively strong over the
past 12 month period in the lead up to the milk price
cuts, notwithstanding strong market signals from
the global dairy markets (refer graph below), and an
Australian dollar which has been stubbornly high:
Source Global Dairy Trade Quarterly Report March 2016
- https://www.globaldairytrade.info/en/product-results/gdt-
events-reports/
This may have been a consequence of processor
guidance on FMP prices with an indicative final
FMP of $6.05 per kgMS from Murray Goulburn and
Fonterra in 2015/16; and despite Dairy Australia's
“Situation & Outlook” report in October 2015 which
reported that "in some peoples’ view, the announced
Month in Review
June 2016
Rural
Source Victorian Water Register - http://waterregister.vic.gov.
au/water-trading/water-share-trading
67
opening price of 2015/16 of $5.60 per kgMS was an
appropriate budgeting baseline".
For the reasons outlined above, the optimistic
outlook and relatively strong demand in the past 12
months has softened. Anecdotally, we are aware of
multiple transactions, which have been aborted or
shelved, for the time being, as long term industry
participants look for improved buying opportunities
which may arise under the current market conditions.
Those interested in exiting the industry (i.e. those
able but unwilling to fund the deficit; and those
willing to continue but unable to fund the short term
deficit) will need to carefully consider their options in
a property market which will invariably come under
downward pressure. Those with relatively limited
dairy infrastructure may be able to sell into other
relatively stronger alternative markets, for example,
to irrigated cropping or mixed cropping/grazing
enterprises. This will depend on the proximity of the
holding to alternative users, along with the nature of
existing layouts and the extent of the dairy specific
infrastructure at the property, which will ostensibly
be redundant for a purchaser interested in operating
the property for an alternative use.
Contact
David Leeds – Ph: 0418 594 416
Country NSW
One area that continues to be a topic of discussion
with many financial institutions is the implementation
and impact of properties being encumbered with
carbon credit schemes. While we have mentioned
these before we are beginning to see the change now
from carbon credit schemes which focused on the
locking up of areas that had the right to be cleared to
agreements now focusing on the regeneration of the
existing timber and scrub.
Initial discussions with some landowners that have
participated in these regeneration schemes indicate
that the underlying grazing capacity of the areas
outlined in the agreement are negatively affected.
One recent agreement saw 60% of a large grazing
property in far western New South Wales being
encumbered by a carbon agreement. Our initial
assessment of this agreement would indicate that
the only grazing allowed is crash grazing to help
reduce any susceptibility to bushfire. Effectively this
property has just lost 60% of its carry capacity with
these restrictions in place for 100 years. While you
might say why would a land owner do this? The cash
incentive over a ten year period is substantial and
equates to approximately 20% to 25% of the overall
asset value per year. While this appears to be a very
strong return, these returns are in effect less than
the returns shown from the initial carbon agreements
which saw landholders extinguishing property
vegetation plants which allowed wholesale clearing
to be undertaken. The main difference here is that
the properties with the clearing permits are able to
include all of the sequestered carbon in the growth
on the country, while the regeneration agreements
only account for the carbon sequestered each year
above the base level which is determined by the
carbon aggregator.
Until we have quantifiable market evidence there are
a number of plausible ways to approach these rural
properties.
1.	 Disregard the added value of the income stream
altogether
2.	 Determine the net present value of the projected
income stream and add it to the underlying land
value
3.	 Capitalise the income stream at an appropriate
risk rate
All of the above approaches to valuation would
need to take into consideration the impact on the
long-term grazing capacity of the property. For
the property mentioned above from a valuation
perspective the landowner has now effectively
dropped his carry capacity by 60% which will have
a very large impact on the asset value. We do not
see valuation approach three as a viable option
and currently until we have market evidence we
have little regard for the added value of the income
Month in Review
June 2016
Rural
68
stream, yet taking into account the long-term effects
on grazing on the property.
As a valuers our role is to take the view of a
prospective purchaser and this is where the difficulty
lies in the present market as we are unaware of any
sales of rural properties with these large income
streams in place and as such, we have no guidance
from the market at this stage. We believe there is
a valid argument that a property with an income
stream equivalent to 25% to 30% of its asset value
per year for ten years would achieve high levels of
interest from the market however the difficulty with
these carbon agreements is the associated risk that
comes from a force majeure (such as bushfire).
In cases where areas are burnt out by bushfires, the
effect on the agreement is to stop any payments
for the carbon credits associated with the timber
and growth on the property until the regrowth has
returned to a level that was similar prior to the
fire event. This may take a number of years and
as such while it looks relatively simple to assess
the income stream over a ten year period the
underlying risk is very difficult to quantify and until
we have demonstrated market evidence regarding
what risk levels landholders and prospective
purchasers are willing to apportion, we have been
taking a conservative approach to the impact of the
agreement on the property value.
The other aspect here is that these agreements
continue in place long after the income stream has
finished with most agreements in place for either
25 years or 100 years. There are obligations on the
landholder to maintain fencing, adequate roadways
and feral animal control for the duration of the
agreement which will have costs involved. So long
after the income has stopped the property will be
burdened by these additional costs to adhere to the
agreement. Again we do not have any guidance from
the market on how prospective purchasers will view
this long ongoing burden to adhere to the carbon
contract.
The one thing that we have seen in the past 12
months and assessing a number of these agreements
is that they are all slightly different and that each
one needs to be assessed individually. Some of
these agreements have upfront payments with small
annual continuing payments, while most of the ones
we deal with have an income stream over ten years
with most payments equal in nature over that period.
Where would I spend $10 million?
This is a question that we as valuers are asked often,
sometimes in the form of "where do you think the
best country is?" or "Where is the best value?" and
so on.
In terms of sheer bang for your buck it is hard to
go past the far western area of New South Wales.
While we have seen increases in dollar per DSE
rates over the past two and three years there are
still properties available in that $180 to $250 per
DSE range which compare very favourably to the
inside grazing country where these rates would be
between $350 and $500 per DSE. So effectively you
can purchase up to double the number of productive
units as compared to the inside country for the same
money. While this sounds simple the issue here is
isolation and transport costs of the end product.
Our experience is that many properties are now
effectively marketing their sheep or beef in a way
that allows for the purchaser to share some of the
freight burden. This does have an impact on general
achieved dollar per kilo rates however the low cost
of production from these areas and the naturally
organic nature of many of these properties allow for
market opportunities that are difficult to achieve in
the inside country.
Contact
Scott Fuller – Ph: 0427 077 566
Northern Territory
So, what can you pick up for $10 million in the Top
End? Had this question been posed at the same
time last year then it may have been a bit tricky to
answer, however now it’s a little easier with a clutch
of recent pastoral sales in the Top End, a handful in
Alice Springs and the odd freehold mixed farming
block sale.
Month in Review
June 2016
Rural
69
For cattle stations, $10 million will buy you a small
to medium scale (say up to 8,000 or 9,000 AE
carrying capacity) pastoral lease (excluding cattle
and plant) throughout most districts between say
300 kilometres and 500 kilometres from the Port of
Darwin.
The recent sale of Lonesome Dove in the Roper
District (748 square kilometres and 540 kilometres
from Darwin) to a local cattleman in March for $6.5
million (or around $4.5 million assessed bare) is
handy evidence, as is the sale of Humbert River in
the Victoria River District which recently transferred
from CPC to Heytesbury in a sale that was also
under $5 million (assessed bare) for a similar scale
operation. The sale under contract (and as already
reported in the press) of Hodgson River (1,100 square
kilometres and 600 kilometres from Port of Darwin)
also transacted around similar levels to a nearby
pastoralist (actual price still confidential).
These blocks are all breeder blocks for the live export
market and generally have productive capacity
rates ranging from five adult equivalent per square
kilometre to nine adult equivalent per square
kilometre over their developed areas (ie permanently
within three kilometres of water) and between three
and six adult equivalent per square kilometre across
the entire lease area. They all require a fair bit of
supplementation to maintain this level of productivity
and the prices paid (ranging from $750 per adult
equivalent to around $1,000 per adult equivalent)
indicate only modest increase from where market
expectations sat this time last year*. We are also
aware of a sub $2 million deal (assessed bare) for a
smaller than average scale pastoral lease south of
Katherine that will also sit between $700 and $800
per adult equivalent (assessed bare).
There are presently a couple of pastoral holdings
you could look at within 500 kilometres of Darwin
including Conways in the Roper District (1,392 square
kilometres, 180 kilometres east of Katherine), Flying
Fox, Roper District (895 square kilometres, 230
kilometres east of Katherine), Florina (575 square
kilometres, 50 kilometres west of Katherine), Middle
Creek (602 square kilometres, 180 kilometres
south of Katherine) and at a squeeze you could also
probably have a crack at Vermelha (2,039 square
kilometres, 190 kilometres south of Katherine). If
you want to include cattle, then for an average
quality herd for the region, in average proportions
of breeders to followers, you might be looking
anywhere between low $700 to low $800 per head.
Down in the Alice Springs districts last year’s sales
of Delny and Delmore Downs and MacDonald Downs
plus two other small scale leases we understand
are currently under contract, indicate that $800 to
$1,100/AE bare (again, based on the writer’s estimate
of carrying capacity) will buy you some of the
most efficient country (profit per kilogram of beef
produced) in the Northern Territory. As always, Alice
is a tightly held market and you may need to speak to
the right people to find out what is currently quietly
on the market.
In the Northern Territory freehold space the
question is more difficult to answer with the number
of commercial scale grazing, mixed farming or
horticulture blocks sales within the past five years
still able to be counted on two hands. Supply remains
tight however there is the odd freehold grazing block
around Katherine of a scale in excess of 10,000
hectares for sale at sub $5 million which could
potentially attract around $1,700 to $1,800/AE of
current carrying capacity (bare) for moderate quality,
forest country, fenced and watered and with bitumen
road frontage. For smaller scale blocks set up for
improved pasture grazing, that rate can jump up to
$2,500 to $3,000/AE (ex structures) if within 200
to 250 kilometres of Darwin. A small (1,500 hectare)
freehold block just south of Adelaide River, about
120 kilometres from Darwin improved with not much
more than a decent set of cattle yards, bore and
boundary fencing sold earlier this year and showed
around $4,500/AE or $750 per hectare for a lump
sum of less than $1.2 million. It would make a handy
little live export depot with its all weather access.
* Note: the writer’s assessed $/AE rates are
derived from his own sustainable carrying capacity
assessments (in order to maintain relativity between
his sales analysis) and may vary from other opinions
of carrying capacity.
Month in Review
June 2016
Rural
70
South West WA
If I had $10 million to invest in Western Australian
agriculture I would look at all the sectors (beef,
sheep, grains, dairy, poultry and pigs) as well as
different regions across the State. In order to not
'put all my eggs in one basket' I would also split my
investment into a number of properties.
To start with I recognise that all sectors of the
industry have their ups and downs with changing
commodity prices and competition. It is therefore
important to look past the current situation be it
up or down and focus on past trends and future
opportunities. Basically Western Australia is split into
three regions – the pastoral regions of the north and
east which is predominantly leased land, the wheat
and sheep growing areas which are generally 100
kilometres plus from the coast and stretch north and
east to adjoining the pastoral regions. Then finally
the areas with 100 kilometres from the coast which
include horticulture, dairy and grazing uses with
rural lifestyle and forestry interspersed. This is very
generalised but gives an indication for the purpose of
this scenario.
First we look at the pastoral region and investment
in beef and sheep. It has been widely reported that
there has been significant investment going into
the northern pastoral regions in the past 24 months
with some iconic properties selling to prominent
Australians and wealthy overseas parties. The
majority of these properties have been above
my budget and also would require a lot more to
develop them to their full potential. So with the beef
prices riding high and the future reportedly looking
bright I would consider an investment in a pastoral
property but it would have to be on a partnership
basis. The benefits of a partnership are that you get
the expertise of running this type of property with
your partner however you also take on the risk of
operating this type of property as well.
The wheat and sheep growing areas are varied and
to the majority have suffered from drought over
the past couple of decades. Some of the low rainfall
areas less than 300 millmetres have had some very
difficult times with droughts year on year eroding
equity and only recent rain events have given them
some hope for the future. The medium rainfall areas
have also suffered from drought conditions and
yields have been down. Recent years have seen
this area produce good results and market activity
has increased dramatically. The high rainfall areas
especially along the south coast have performed very
well over the past decade and this has been reflected
in the increase in land values across these areas. I
would definitely consider an investment in this area
but would have to be on a lessor basis due to the
high setup cost with machinery and infrastructure. I
would look at the medium rainfall area where you get
more land for your dollar and also is considered to
be where operators are looking to expand but do not
have the capital so renting land is their best option.
The coastal land is relatively expensive and most
operations require expertise for growing specific
crops or for more intensive operations. It is my
opinion that with beef and lamb prices being
relatively high, pork and chicken will become
more dominant in the Western Australian diet and
therefore I would definitely consider an investment in
either the pig or poultry industry if available. These
industries are very small at the moment in relative
terms and the potential for a new entrant to make
their mark is risky but potentially very lucrative. I
would make this investment on a partnership basis
with me supplying the infrastructure and animals and
a partner providing the expertise.
Therefore my investment model would involve
three regions and three industries. Two would be
on a partnership basis where the initial quantum
investment could be lower and I could use anothers
expertise to gain a return. It is difficult to estimate
a return on this basis without the exact investment
model however I would be looking for 10% to 15%
on my share given the higher risk of being involved
in the operational side. For the wheat and sheep
property I would be looking for a more modest return
of 4% to 5% on a three to five year tenancy basis
and also expect some capital growth as the market
recovers from the years of drought.
Month in Review
June 2016
Rural
Property Market Indicators
72
Disclaimer
This publication presents a generalised overview regarding the state of Australian
property markets, using property market risk-ranking scales. It is not a guide to
individual property assessments and should not be relied upon.
Herron Todd White accepts no responsibility for any reliance placed on the
commentary and generalised information. Contact Herron Todd White to obtain
formal, specific property advice on any matters of interest arising from this publication.
National Property Clock
June 2016
Office
Entries coloured purple indicate positional change from last month.
Liability limited by a scheme approved under Professional Standards
Legislation. This scheme does not apply within Tasmania.
This report is not intended to be comprehensive or render advice and neither
Herron Todd White nor any persons involved in the preparation of this report,
accepts any form of liability for its contents.
Peak of
Market
Approaching
Peak of Market
Rising
Market
Start of
Recovery
Bottom of
Market
Starting to
decline
Declining
Market
Approaching
Bottom of Market
Bendigo
Darwin
Alice Springs
Emerald
Gippsland
Mackay
Orange
Brisbane
Adelaide
Perth
Adelaide Hills
Barossa Valley
Gladstone
Rockhampton
Iron Triangle
Hobart
Burnie/Devenport
Cairns
Launceston
South West WA
Townsville
Wagga Wagga
Wide Bay
Canberra
Albury
NSW Central Coast
Griffith
Horsham
NSW Mid North Coast
Mildura
Newcastle
South East NSW
Sunshine Coast
Tamworth
Wodonga
Sydney
Ballarat
Bathurst
Coffs Harbour
Dubbo
Echuca
NSW Far North Coast
Gold Coast
Mudgee
Toowoomba
Melbourne
National Property Clock
June 2016
Houses
Entries coloured orange indicate positional change from last month.
Liability limited by a scheme approved under Professional Standards
Legislation. This scheme does not apply within Tasmania.
This report is not intended to be comprehensive or render advice and neither
Herron Todd White nor any persons involved in the preparation of this report,
accepts any form of liability for its contents.
Peak of
Market
Approaching
Peak of Market
Rising
Market
Start of
Recovery
Bottom of
Market
Starting to
decline
Declining
Market
Approaching
Bottom of Market
Melbourne
NSW Central Coast
Dubbo
Newcastle
Sydney
South West WA
Toowoomba
Perth
Alice Springs
Darwin
Emerald
Gladstone
Mackay
Rockhampton
Bundaberg
Townsville
Brisbane
Hobart
Burnie/Devenport
Gippsland
Hervey Bay
Launceston
Mildura
Mount Gambier
Warrnambool
Whitsunday
Adelaide
Canberra
Adelaide Hills
Albury
Barossa Valley
Bathurst
Bendigo
Cairns
Coffs Harbour
NSW Far North Coast
Griffith
Iron Triangle
Mudgee Orange
Shepparton
Sunshine Coast
Tamworth
Wagga Wagga
Ballarat
Echuca
Gold Coast
Horsham
Ipswich
NSW Mid North Coast
South East NSW
Peak of
Market
Approaching
Peak of Market
Rising
Market
Start of
Recovery
Bottom of
Market
Starting to
decline
Declining
Market
Approaching
Bottom of Market
National Property Clock
June 2016
Units
Entries coloured blue indicate positional change from last month.
Liability limited by a scheme approved under Professional Standards
Legislation. This scheme does not apply within Tasmania.
This report is not intended to be comprehensive or render advice and neither
Herron Todd White nor any persons involved in the preparation of this report,
accepts any form of liability for its contents.
Melbourne
Dubbo
Gold Coast
Newcastle
Sydney
Brisbane
Ballarat
South West WA
Toowoomba
Perth
Alice Springs
Gladstone
Mackay
Darwin
Emerald
Rockhampton
Whitsunday
Canberra
Bundaberg
Townsville
Warrnambool
Adelaide
Hobart
Adelaide Hills
Albury
Barossa Valley
Burnie/Devenport
Cairns
Gippsland
Hervey Bay
Iron Triangle
Launceston
Mildura
Mount Gambier
Shepparton
Bathurst
Bendigo
Coffs Harbour
Echuca
NSW Far North Coast
Griffith
Mudgee
Orange
Sunshine Coast
Tamworth
Wagga Wagga
NSW Central Coast
Horsham
Ipswich
NSW Mid North Coast
South East NSW
© Herron Todd White Copyright 2016
Market
Indicators
73
1
Capital City Property Market Indicators – Houses
Month in Review
June 2016
Capital City Property Market Indicators – Houses
Factor Sydney Melbourne Brisbane Adelaide Perth Hobart Darwin Canberra
Rental Vacancy Situation Balanced market Balanced market Balanced market Balanced market Over-supply of
available property
relative to demand
Balanced market Over-supply of
available property
relative to demand
Balanced market
Rental Vacancy Trend Steady Steady Increasing Steady Increasing Steady Increasing Steady
Demand for New Houses Fair Fair Fair Fair Soft Fair Soft Strong
Trend in New House Construction Steady Declining - Steady Increasing strongly Increasing Declining Declining Declining Steady
Volume of House Sales Declining Steady - Declining Steady Steady Declining Steady Declining
significantly
Steady
Stage of Property Cycle Starting to decline Peak of market Start of recovery Rising market Declining market Start of recovery Approaching bottom
of market
Rising market
Are New Properties Sold at Prices
Exceeding Their Potential Resale Value
Occasionally Occasionally Occasionally Occasionally Almost never Almost never Occasionally Occasionally
Red entries indicate change from previous month to a higher risk-rating Blue entries indicate change from previous month to a lower risk-rating
© Herron Todd White Copyright 2016
Market
Indicators
74
1
Capital City Property Market Indicators – Units
Month in Review
June 2016
Capital City Property Market Indicators – Units
Factor Sydney Melbourne Brisbane Adelaide Perth Hobart Darwin Canberra
Rental Vacancy Situation Balanced market Balanced market Balanced market Balanced market Over-supply of
available property
relative to demand
Balanced market Over-supply of
available property
relative to demand
Balanced market
Rental Vacancy Trend Steady Steady Increasing Steady Increasing Steady Increasing Steady
Demand for New Units Fair Fair Fair Fair Soft Fair Soft Strong
Trend in New Unit Construction Steady Declining - Steady Increasing strongly Increasing Declining Declining Declining Steady
Volume of Unit Sales Declining Steady - Declining Steady Steady Declining Steady Declining
significantly
Steady
Stage of Property Cycle Starting to decline Peak of market Start of recovery Rising market Declining market Start of recovery Approaching bottom
of market
Rising market
Are New Properties Sold at Prices
Exceeding Their Potential Resale Value
Occasionally Occasionally Occasionally Occasionally Almost never Almost never Occasionally Occasionally
Red entries indicate change from previous month to a higher risk-rating Blue entries indicate change from previous month to a lower risk-rating
© Herron Todd White Copyright 2016
Market
Indicators
75
1
1
Capital City Property Market Indicators – Office
Month in Review
June 2016
Capital City Property Market Indicators – Office
Factor Sydney Melbourne Brisbane Adelaide Perth Hobart Darwin Canberra
Rental Vacancy Situation Balanced market Over-supply of
available property
relative to demand
Large over-supply
of available
property relative to
demand
Over-supply of
available property
relative to demand
Large over-supply
of available
property relative to
demand
Over-supply of
available property
relative to demand
Large over-supply
of available
property relative to
demand
Large over-supply
of available
property relative to
demand
Rental Vacancy Trend Tightening Tightening - Steady Increasing Increasing Increasing Steady Increasing Steady
Rental Rate Trend Stable - Increasing Stable Declining Declining - Stable Declining Declining Declining Stable
Volume of Property Sales Increasing - Steady Declining Declining Steady Declining Steady Steady Steady
Stage of Property Cycle Rising market Approaching peak
of market
Approaching
bottom of market
Approaching
bottom of market
Approaching
bottom of market
Bottom of market Declining market Start of recovery
Local Economic Situation Flat Steady growth -
Flat
Steady growth Flat - Contraction Contraction Flat Contraction Flat
Value Difference between Quality Properties
with National Tenants, and Comparable
Properties with Local Tenants
Small Significant Small Large Large Significant Large Significant
Red entries indicate change from 3 months ago to a higher risk-rating Blue entries indicate change from 3 months ago to a lower risk-rating
© Herron Todd White Copyright 2016
Market
Indicators
76
1
East Coast New South Wales Property Market Indicators – Houses
Month in Review
June 2016
East Coast New South Wales Property Market Indicators – Houses
Factor Canberra Central Coast Coffs Harbour Far North NSW Mid North Coast Newcastle South East NSW Sydney
Rental Vacancy Situation Balanced market Balanced market Balanced market Balanced market Shortage of available
property relative to
demand
Balanced market Balanced market Balanced market
Rental Vacancy Trend Steady Steady Steady Steady Steady Steady Tightening - Steady Steady
Demand for New Houses Strong Fair - Strong Strong Fair - Strong Strong Fair Fair - Strong Fair
Trend in New House
Construction
Steady Steady Increasing Declining - Steady Steady Declining Steady - Increasing Steady
Volume of House Sales Steady Steady Steady Steady - Declining Steady Steady Steady Declining
Stage of Property Cycle Rising market Peak of market Rising market Rising market Approaching peak of
market
Peak of market Approaching peak of
market
Starting to decline
Are New Properties Sold at
Prices Exceeding Their Potential
Resale Value
Occasionally Occasionally Almost never Frequently Occasionally Occasionally Occasionally -
Frequently
Occasionally
Red entries indicate change from previous month to a higher risk-rating Blue entries indicate change from previous month to a lower risk-rating
© Herron Todd White Copyright 2016
Market
Indicators
77
1
Country New South Wales Property Market Indicators – Houses
Month in Review
June 2016
Country New South Wales Property Market Indicators – Houses
Factor Albury Bathurst Dubbo Griffith Mudgee Orange Tamworth Wagga Wagga
Rental Vacancy Situation Balanced market Balanced market Balanced market Shortage of available
property relative to
demand
Severe shortage of
available property
relative to demand
Balanced market Balanced market Balanced market
Rental Vacancy Trend Steady Tightening Steady Steady Tightening Tightening Increasing Increasing
Demand for New Houses Fair Strong Strong Strong Strong Strong Strong Strong
Trend in New House
Construction
Steady Steady Increasing Steady Increasing Steady Increasing Steady
Volume of House Sales Steady Increasing Steady Increasing Steady Increasing Steady Steady
Stage of Property Cycle Rising market Rising market Peak of market Rising market Rising market Rising market Rising market Rising market
Are New Properties Sold at
Prices Exceeding Their Potential
Resale Value
Occasionally Occasionally Occasionally Occasionally Occasionally Occasionally Occasionally Occasionally
Red entries indicate change from previous month to a higher risk-rating Blue entries indicate change from previous month to a lower risk-rating
© Herron Todd White Copyright 2016
Market
Indicators
78
1
East Coast New South Wales Property Market Indicators – Units
Month in Review
June 2016
East Coast New South Wales Property Market Indicators - Units
Factor Canberra Central Coast Coffs Harbour Far North NSW Mid North Coast Newcastle South East NSW Sydney
Rental Vacancy Situation Over-supply of
available property
relative to demand
Shortage of
available property
relative to demand
Balanced market Balanced market Shortage of available
property relative to
demand
Balanced market Balanced market Balanced market
Rental Vacancy Trend Steady Steady Steady Steady Steady Steady Tightening - Steady Increasing
Demand for New Units Fair Strong - Very strong Strong Fair - Strong Strong Fair Fair Fair
Trend in New Unit Construction Increasing Declining - Steady Increasing Declining - Steady Steady Declining Steady Steady
Volume of Unit Sales Steady Increasing Steady Steady - Declining Steady Steady Steady Declining
Stage of Property Cycle Bottom of market Approaching peak
of market
Rising market Rising market Approaching peak of
market
Peak of market Approaching peak of
market
Starting to decline
Are New Properties Sold at
Prices Exceeding Their Potential
Resale Value
Frequently Occasionally Occasionally Frequently Almost never Occasionally Occasionally -
Frequently
Occasionally
Red entries indicate change from previous month to a higher risk-rating Blue entries indicate change from previous month to a lower risk-rating
© Herron Todd White Copyright 2016
Market
Indicators
79
1
Country New South Wales Property Market Indicators – Units
Month in Review
June 2016
Country New South Wales Property Market Indicators - Units
Factor Albury Bathurst Dubbo Griffith Mudgee Orange Tamworth Wagga Wagga
Rental Vacancy Situation Balanced market Balanced market Balanced market Shortage of available
property relative to
demand
Severe shortage of
available property
relative to demand
Balanced market Balanced market Balanced market
Rental Vacancy Trend Steady Tightening Steady Steady Tightening Tightening Steady Steady
Demand for New Units Soft Strong Strong Strong Strong Strong Fair Fair
Trend in New Unit Construction Steady Steady Increasing Increasing Increasing Steady Steady Steady
Volume of Unit Sales Steady Increasing Steady Increasing Steady Increasing Steady Steady
Stage of Property Cycle Start of recovery Rising market Peak of market Rising market Rising market Rising market Rising market Rising market
Are New Properties Sold at
Prices Exceeding Their Potential
Resale Value
Occasionally Occasionally Occasionally Occasionally Occasionally Occasionally Occasionally Occasionally
Red entries indicate change from previous month to a higher risk-rating Blue entries indicate change from previous month to a lower risk-rating
© Herron Todd White Copyright 2016
Market
Indicators
80
1
East Coast New South Wales Property Market Indicators – Office
Month in Review
June 2016
East Coast New South Wales Property Market Indicators – Office
Factor
Canberra/
Q’beyan
Central Coast Coffs Harbour Far North NSW Mid North Coast Newcastle South East NSW Sydney
Rental Vacancy Situation Large over-supply
of available property
relative to demand
Balanced market Over-supply of
available property
relative to demand
Over-supply of
available property
relative to demand
Balanced market Shortage of available
property relative to
demand
Balanced market -
Over-supply of
available property
relative to demand
Balanced market
Rental Vacancy Trend Steady Tightening Tightening Increasing Steady Steady Steady Tightening
Rental Rate Trend Stable Stable Stable Stable Stable Stable Stable Stable - Increasing
Volume of Property Sales Steady Increasing Steady Steady Steady Increasing Increasing Increasing - Steady
Stage of Property Cycle Start of recovery Start of recovery Rising market Rising market Start of recovery Start of recovery Start of recovery Rising market
Local Economic Situation Flat Steady growth Flat Flat Flat Steady growth Flat Flat
Value Difference between
Quality Properties with National
Tenants, and Comparable
Properties with Local Tenants
Significant Significant Significant - Large Significant - Large Small Large Significant - Large Small
Red entries indicate change from 3 months ago to a higher risk-rating Blue entries indicate change from 3 months ago to a lower risk-rating
© Herron Todd White Copyright 2016
Market
Indicators
81
1
Country New South Wales Property Market Indicators – Office
Month in Review
June 2016
Country New South Wales Property Market Indicators – Office
Factor Albury Bathurst Dubbo Griffith Mudgee Orange Tamworth Wagga Wagga
Rental Vacancy Situation Over-supply of
available property
relative to demand
Balanced market Balanced market Over-supply of
available property
relative to demand
Balanced market Balanced market Over-supply of
available property
relative to demand
Over-supply of
available property
relative to demand
Rental Vacancy Trend Steady Steady Steady Steady Steady Steady Steady Steady
Rental Rate Trend Stable Stable Stable Stable Stable Stable Declining Declining
Volume of Property Sales Steady Steady Steady Steady Steady Steady Steady Steady
Stage of Property Cycle Start of recovery Rising market Rising market Start of recovery Rising market Declining market Start of recovery Bottom of market
Local Economic Situation Flat Flat Flat Flat Flat Contraction Steady growth Flat
Value Difference between
Quality Properties with National
Tenants, and Comparable
Properties with Local Tenants
Significant Small - Significant Significant Significant Significant Small - Significant Significant Significant
Red entries indicate change from 3 months ago to a higher risk-rating Blue entries indicate change from 3 months ago to a lower risk-rating
© Herron Todd White Copyright 2016
Market
Indicators
82
1
Victoria/Tasmania Property Market Indicators – Houses
Month in Review
June 2016
Victorian and Tasmanian Property Market Indicators – Houses
Factor Ballarat Bendigo Echuca
Gippslan
d
Horsham Melbourne Mildura
Shepparto
n
Warrnambo
ol
Burnie/
Devonport
Hobart
Launcesto
n
Rental Vacancy Situation Balanced
market
Over-supply of
available
property relative
to demand
Shortage of
available
property
relative to
demand
Balanced
market
Balanced
market
Balanced
market
Balanced
market
Balanced
market
Balanced
market
Balanced
market
Balanced
market
Balanced
market
Rental Vacancy Trend Steady Steady Steady Steady Steady Steady Steady Steady Steady Steady Steady Steady
Demand for New Houses Fair Fair Fair Fair Strong Fair Fair Fair Strong Fair Fair Fair
Trend in New House
Construction
Steady Steady Steady Declining Steady Declining -
Steady
Steady Steady Steady Declining Declining Declining
Volume of House Sales Steady Steady Steady Increasing Declining Steady -
Declining
Steady Steady Steady Steady Steady Steady
Stage of Property Cycle Approaching
peak of
market
Rising market Approaching
peak of
market
Start of
recovery
Approaching
peak of
market
Peak of
market
Start of
recovery
Rising market Start of
recovery
Start of
recovery
Start of
recovery
Start of
recovery
Are New Properties Sold at
Prices Exceeding Their
Potential Resale Value
Almost never Frequently Occasionally Occasion-
ally
Occasionally Occasionally Almost never Occasionally Occasionally Almost never Almost never Almost never
Red entries indicate change from previous month to a higher risk-rating Blue entries indicate change from previous month to a lower risk-rating
© Herron Todd White Copyright 2016
Market
Indicators
83
1
Victoria/Tasmania Property Market Indicators – Units
Month in Review
June 2016
Victorian and Tasmanian Property Market Indicators – Units
Factor Ballarat Bendigo Echuca
Gippslan
d
Horsham Melbourne Mildura
Shepparto
n
Warrnambo
ol
Burnie/
Devonport
Hobart
Launcesto
n
Rental Vacancy Situation Balanced
market
Over-supply of
available
property relative
to demand
Shortage of
available
property
relative to
demand
Balanced
market
Balanced
market
Balanced
market
Balanced
market
Balanced
market
Balanced
market
Balanced
market
Balanced
market
Balanced
market
Rental Vacancy Trend Steady Steady Steady Steady Steady Steady Steady Steady Steady Steady Steady Steady
Demand for New Houses Fair Fair Fair Fair Strong Fair Fair Fair Strong Fair Fair Fair
Trend in New House
Construction
Steady Steady Steady Declining Steady Declining -
Steady
Steady Steady Steady Declining Declining Declining
Volume of House Sales Steady Steady Steady Increasing Declining Steady -
Declining
Steady Steady Steady Steady Steady Steady
Stage of Property Cycle Approaching
peak of
market
Rising market Approaching
peak of
market
Start of
recovery
Approaching
peak of
market
Peak of
market
Start of
recovery
Rising market Start of
recovery
Start of
recovery
Start of
recovery
Start of
recovery
Are New Properties Sold at
Prices Exceeding Their
Potential Resale Value
Almost never Frequently Occasionally Occasion-
ally
Occasionally Occasionally Almost never Occasionally Occasionally Almost never Almost never Almost never
Red entries indicate change from previous month to a higher risk-rating Blue entries indicate change from previous month to a lower risk-rating
© Herron Todd White Copyright 2016
Market
Indicators
84
1
Victoria/Tasmania Property Market Indicators – Office
Month in Review
June 2016
Victorian and Tasmanian Property Market Indicators – Office
Factor Ballarat Bendigo Echuca Gippsland Melbourne Mildura Wodonga
Burnie/
Devonport
Hobart Launceston
Rental Vacancy Situation Shortage of
available
property
relative to
demand
Balanced
market
Balanced
market
Over-supply
of available
property
relative to
demand
Balanced
market
Over-supply
of available
property
relative to
demand
Balanced market Over-supply of
available
property relative
to demand
Over-supply of
available
property relative
to demand
Over-supply of
available
property relative
to demand
Rental Vacancy Trend Tightening Tightening Steady Steady Steady Tightening -
Steady
Steady Steady Steady Steady
Rental Rate Trend Increasing Stable Stable Stable Stable Stable Stable Stable Declining Declining
Volume of Property Sales Steady Increasing Steady Declining Steady Declining Steady Steady Steady Steady
Stage of Property Cycle Rising market Starting to
decline
Rising market Declining
market
Start of
recovery
Approaching
peak of
market
Start of recovery Start of
recovery
Bottom of
market
Bottom of
market
Local Economic Situation Steady
growth
Steady growth Flat Flat Flat Steady
growth - Flat
Flat Flat Flat Flat
Value Difference between
Quality Properties with National
Tenants, and Comparable
Properties with Local Tenants
Significant Significant Significant Small Significant Significant Significant Significant Significant Significant
Red entries indicate change from 3 months ago to a higher risk-rating Blue entries indicate change from 3 months ago to a lower risk-rating
© Herron Todd White Copyright 2016
Market
Indicators
85
1
Queensland Property Market Indicators – Houses
Month in Review
June 2016
Queensland Property Market Indicators – Houses
Factor Cairns
Towns-
ville
Whit-
sunday
Mackay
Rock-
hampton
Emerald
Glad-
stone
Bundaberg
Hervey
Bay
Sunshine
Coast
Brisbane Ipswich
Gold
Coast
Toowoomba
Rental Vacancy Situation Shortage
of
available
property
relative to
demand
Over-supply
of available
property
relative to
demand
Balanced
market
Balanced
market -
Over-
supply of
available
property
relative to
demand
Over-supply of
available
property relative
to demand
Over-supply
of available
property
relative to
demand
Over-supply
of available
property
relative to
demand
Over-supply
of available
property
relative to
demand
Balanced
market
Shortage of
available
property
relative to
demand
Balanced
market
Balanced
market
Shortage of
available
property
relative to
demand
Balanced
market
Rental Vacancy Trend Steady Increasing Steady Steady Increasing Steady Increasing Steady Steady Steady Increasing Steady Steady Steady -
Increasing
Demand for New Houses Fair Soft Fair Soft Soft Very soft Soft Fair Fair -
Strong
Strong Fair Fair Fair Fair
Trend in New House
Construction
Steady Declining Steady Declining
- Steady
Declining Declining
significantly
Declining Steady Increasin
g
Increasing Increasing
strongly
Increasin
g
Steady Steady
Volume of House Sales Steady Steady Steady Steady Declining Steady Steady Steady Increasin
g
Increasing Steady Declining Steady Steady -
Declining
Stage of Property Cycle Rising
market
Bottom of
market
Start of
recovery
Approachi
ng bottom
of market
Approaching
bottom of
market
Approachin
g bottom of
market
Approachin
g bottom of
market
Bottom of
market
Start of
recovery
Rising
market
Start of
recovery
Approachi
ng peak
of market
Approachin
g peak of
market
Starting to
decline
Are New Properties Sold at
Prices Exceeding Their
Potential Resale Value
Almost
never
Almost
never
Almost never Occasion-
ally
Occasionally Occasion-
ally
Occasion-
ally
Frequently Occasion-
ally
Occasion-
ally
Occasion-
ally
Occasion-
ally
Occasion-
ally
Frequently
Red entries indicate change from previous month to a higher risk-rating Blue entries indicate change from previous month to a lower risk-rating
© Herron Todd White Copyright 2016
Market
Indicators
86
1
Queensland Property Market Indicators – Units
Month in Review
June 2016
Queensland Property Market Indicators - Units
Factor Cairns
Towns-
ville
Whit-
sunday
Mackay
Rock-
hampton
Emerald
Glad-
stone
Bundaberg
Hervey
Bay
Sunshine
Coast
Brisban
e
Ipswich
Gold
Coast
Toowoomba
Rental Vacancy Situation Shortage
of
available
property
relative to
demand
Large over-
supply of
available
property
relative to
demand
Over-supply
of available
property
relative to
demand
Over-
supply of
available
property
relative to
demand
Balanced
market
Over-supply
of available
property
relative to
demand
Large over-
supply of
available
property
relative to
demand
Balanced
market
Balanced
market
Balanced
market
Over-
supply of
available
property
relative to
demand
Balanced
market
Balanced
market
Over-supply of
available
property relative
to demand
Rental Vacancy Trend Steady Increasing Steady Steady -
Increasin
g
Increasing Steady Increasing Steady Steady Steady Increasing Increasin
g
Steady Increasing
Demand for New Units Soft Soft Soft Soft Soft Very soft Soft Fair Fair -
Strong
Fair Soft Fair Soft Soft - Fair
Trend in New Unit
Construction
Steady Declining Increasing Declining
- Steady
Steady Declining
significantly
Declining Steady Steady Increasing Declining Increasin
g
Increasing Steady
Volume of Unit Sales Steady Steady Declining Declining Declining Declining Steady Steady Increasing -
Steady
Increasing Declining Steady Steady Steady -
Declining
Stage of Property Cycle Start of
recovery
Bottom of
market
Approaching
bottom of
market
Declining
market
Approaching
bottom of
market
Approachin
g bottom of
market
Declining
market
Bottom of
market
Start of
recovery
Rising
market
Starting to
decline
Approachi
ng peak
of market
Peak of
market
Starting to
decline
Are New Properties Sold at
Prices Exceeding Their
Potential Resale Value
Almost
never
Almost
never
Almost never Occasion-
ally
Almost never Occasion-
ally
Occasion-
ally
Frequently Occasion-
ally
Occasion-
ally
Occasion-
ally
Occasion-
ally
Frequently Frequently
Red entries indicate change from previous month to a higher risk-rating Blue entries indicate change from previous month to a lower risk-rating
© Herron Todd White Copyright 2016
Market
Indicators
87
1
Queensland Property Market Indicators – Office
Month in Review
June 2016
Queensland Property Market Indicators – Office
Factor Cairns Townsville Mackay Rockhampton Gladstone Wide Bay Emerald
Sunshine
Coast
Brisbane Gold Coast Toowoomba
Rental Vacancy Situation Over-supply of
available
property
relative to
demand
Over-supply of
available
property relative
to demand
Over-supply of
available
property
relative to
demand -
Large over-
supply of
available
property
relative to
demand
Balanced market Over-supply of
available
property
relative to
demand
Balanced
market
Over-supply of
available
property
relative to
demand
Balanced
market - Over-
supply of
available
property
relative to
demand
Large over-
supply of
available
property
relative to
demand
Over-supply of
available
property
relative to
demand
Balanced market
Rental Vacancy Trend Steady Steady Steady Steady Steady Steady Increasing Tightening -
Steady
Increasing Tightening Steady
Rental Rate Trend Declining -
Stable
Declining Declining Stable Declining -
Stable
Stable Declining Stable Declining Stable -
Increasing
Stable
Volume of Property Sales Steady Steady Steady Steady Steady Steady Declining Increasing -
Steady
Declining Increasing Steady
Stage of Property Cycle Bottom of
market
Bottom of
market
Declining
market
Approaching
bottom of market
Approaching
bottom of
market
Bottom of
market
Declining
market
Start of
recovery
Approaching
bottom of
market
Rising market Rising market
Local Economic Situation Steady growth
- Flat
Contraction Contraction Flat Flat -
Contraction
Flat Contraction Steady growth Steady growth Steady growth
- Flat
Flat - Contraction
Value Difference between Quality
Properties with National Tenants,
and Comparable Properties with
Local Tenants
Small Small -
Significant
Significant Small Small Significant Small Small -
Significant
Small Significant Small -
Significant
Red entries indicate change from 3 months ago to a higher risk-rating Blue entries indicate change from 3 months ago to a lower risk-rating
© Herron Todd White Copyright 2016
Market
Indicators
88
1
Northern Territory, South Australia & Western Australia Property Market Indicators – Houses
Month in Review
June 2016
SA, NT and WA Property Market Indicators - Houses
Factor Adelaide Adelaide Hills
Barossa
Valley
Iron Triangle
Mount
Gambier
Riverland Alice Springs Darwin Perth
South West
WA
Rental Vacancy Situation Balanced
market
Balanced
market
Balanced
market
Balanced
market
Balanced
market
Shortage of
available
property relative
to demand
Over-supply of
available
property relative
to demand
Over-supply of
available property
relative to
demand
Over-supply of
available property
relative to
demand
Balanced
market
Rental Vacancy Trend Steady Steady Steady Steady Steady Steady Steady Increasing Increasing Steady
Demand for New Houses Fair Fair Fair Fair Fair Fair Fair Soft Soft Soft
Trend in New House Construction Increasing Increasing Increasing Increasing Steady Steady Steady Declining Declining Steady
Volume of House Sales Steady Steady Steady Steady Steady Steady Declining Declining
significantly
Declining Declining
Stage of Property Cycle Rising market Rising market Rising market Rising market Start of
recovery
Stable Declining
market
Approaching
bottom of market
Declining market Starting to
decline
Are New Properties Sold at Prices Exceeding
Their Potential Resale Value
Occasionally Occasionally Occasionally Occasionally Occasionally Occasionally Almost never Occasionally Almost never Almost never
Red entries indicate change from 3 months ago to a higher risk-rating Blue entries indicate change from 3 months ago to a lower risk-rating
© Herron Todd White Copyright 2016
Market
Indicators
89
1
Northern Territory, South Australia & Western Australia Property Market Indicators – Units
Month in Review
June 2016
SA, NT and WA Property Market Indicators – Units
Factor Adelaide Adelaide Hills
Barossa
Valley
Iron
Triangle
Mount
Gambier
Riverland Alice Springs Darwin Perth
South West
WA
Rental Vacancy Situation Balanced
market
Balanced
market
Balanced
market
Balanced
market
Balanced market Shortage of
available
property relative
to demand
Over-supply of
available
property relative
to demand
Over-supply of
available
property relative
to demand
Over-supply of
available
property relative
to demand
Balanced
market
Rental Vacancy Trend Steady Steady Steady Steady Steady Steady Steady Increasing Increasing Steady
Demand for New Units Fair Fair Fair Fair Soft Soft Fair Soft Soft Soft
Trend in New Unit Construction Increasing Increasing Increasing Increasing Steady Declining Steady Declining
significantly
Declining Steady
Volume of Unit Sales Steady Steady Steady Steady Steady Steady Declining Declining
significantly
Declining Declining
Stage of Property Cycle Start of
recovery
Start of
recovery
Start of
recovery
Start of
recovery
Start of recovery Stable Declining
market
Approaching
bottom of
market
Declining
market
Starting to
decline
Are New Properties Sold at Prices Exceeding
Their Potential Resale Value
Almost never Almost never Almost never Almost never Occasionally Almost never Almost never Occasionally Almost never Almost never
Red entries indicate change from 3 months ago to a higher risk-rating Blue entries indicate change from 3 months ago to a lower risk-rating
© Herron Todd White Copyright 2016
Market
Indicators
90
1
Northern Territory, South Australia & Western Australia Property Market Indicators – Office
Month in Review
June 2016
SA, NT and WA Property Market Indicators – Office
Factor Adelaide Adelaide Hills Barossa Valley Iron Triangle
Riverland
Alice Springs Darwin Perth
South West
WA
Rental Vacancy Situation Over-supply
of available
property
relative to
demand
Over-supply of
available
property relative
to demand
Over-supply of
available property
relative to
demand
Over-supply of
available
property relative
to demand
Over-supply of
available property
relative to
demand
Over-supply of
available property
relative to
demand
Large over-
supply of
available
property relative
to demand
Large over-supply
of available
property relative
to demand
Over-supply of
available property
relative to
demand
Rental Vacancy Trend Increasing Increasing Increasing Increasing Steady Increasing Increasing Increasing Increasing
Rental Rate Trend Declining -
Stable
Declining -
Stable
Declining - Stable Declining -
Stable
Stable Declining Declining Declining Declining
Volume of Property Sales Steady Steady Steady Steady Steady Steady Steady Declining Declining
Stage of Property Cycle Approaching
bottom of
market
Approaching
bottom of
market
Approaching
bottom of market
Approaching
bottom of
market
Stable Declining market Declining
market
Approaching
bottom of market
Bottom of market
Local Economic Situation Flat -
Contraction
Flat -
Contraction
Flat - Contraction Flat -
Contraction
Flat Contraction Contraction Contraction Flat
Value Difference between Quality
Properties with National Tenants, and
Comparable Properties with Local
Tenants
Large Large Large Large Significant Small Large Large Small
Red entries indicate change from 3 months ago to a higher risk-rating Blue entries indicate change from 3 months ago to a lower risk-rating
Telephone 1300 880 489
admin@htw.com.au
htw.com.au
Local expertise.
National strength.
Trusted solutions.
Herron Todd White is Australia’s
leading independent property
valuation and advisory group. For
more than 45 years, we’ve helped our
customers make the most of their
property assets by providing sound
valuations and insightful analytical
advice.
With offices in every capital city,
most regional centres, and right
across rural Australia, we are where
you are. Our valuers work in the
property market everyday, providing
professional services for all classes
of property including commercial,
industrial, retail, rural and residential.
Herron Todd White is Australian
owned and operated. With directors
who are owners in the business,
our team has a personal stake in
providing you with the best service
possible.
Liabilitylimitedaschemeapprovedunder
ProfessionalStandardsLegislation.This
schemedoesnotapplywithinTasmania.

282 month in-review_june_2016

  • 1.
  • 2.
    Feature – 2016:Half time score 3 Commercial – Office 4 Residential 22 Rural 59 Market Indicators 71 Contents
  • 3.
    3 Here we are– a work in progress. It’s a painting with the outline sketched, ready for the hue’s and shades to fill in their spaces and point us toward a glorious ending set to fire up the nation’s enthusiasm for property – or so it should be. Unlike the end of the annum, when December brings a sense of hitting the reset button in preparation for the next 365 days, June says, “Take a knee and let’s see what we can do to bring this thing impressively home.” Unfortunately for all those who’d been hoping for a sense of excitement in the air, this financial year’s start brings with it a Federal Election to deal with. Many in the media are calling it a long, drawn-out affair with all the excitement of sloths having a slow race through treacle. It’s a historic reality that when elections are called for the running of our country, property activity slows – but for what reason it’s hard to pinpoint. Sure, negative gearing is a big debate in this upcoming poll, but the election of either party is unlikely to bring the fall of the empire. We are a stable democracy that has yet to come under the spell of a dictatorship, so standing back and waiting for a result before you buy or sell seems, for the most part, pointless. There’s also issues beyond just deciding who gets a bed in The Lodge. Unemployment numbers, manufacturing woes, mining hangovers and a general downturn in a once booming property market are all playing their part across the country. To demonstrate just how diverse our nation and it’s property is, we’ve called upon the clever folk at Herron Todd White throughout the nation to tell us how their markets are tracking now we’ve hit the half way point of the year. There is nothing that can replace the on-the-ground experience of a local, independent professional… and we’ve got a company full of them! No matter where you are, from coast-to- coast, there’s a valuer at our firm who knows your bit of geography like it’s their own kingdom. If you like to step beyond residential investments then this month’s contributions on the office sector are sure to please. We’ve honed in on rentals to see what’s happening come EOFY. What are the rent variations between prime and secondary property? What drives office rents in your area of interest? Is there an overall expectation that rents are on the move – one way or the other? So many questions answered as well as a general market wrap of the office space. So there it is readers – a half time show worth watching. Take it all in, but don’t forget this is just the tip of the iceberg. Our team will stay with you as we steam towards year’s end – just give them a call from the corporate box and watch them perform. 2016: Half time score There' something about the mid-year breather. Month in Review June 2016 Feature
  • 4.
  • 5.
    National Property Clock June2016 Office Entries coloured purple indicate positional change from last month. Liability limited by a scheme approved under Professional Standards Legislation. This scheme does not apply within Tasmania. This report is not intended to be comprehensive or render advice and neither Herron Todd White nor any persons involved in the preparation of this report, accepts any form of liability for its contents. Peak of Market Approaching Peak of Market Rising Market Start of Recovery Bottom of Market Starting to decline Declining Market Approaching Bottom of Market Bendigo Darwin Alice Springs Emerald Gippsland Mackay Orange Brisbane Adelaide Perth Adelaide Hills Barossa Valley Gladstone Rockhampton Iron Triangle Hobart Burnie/Devenport Cairns Launceston South West WA Townsville Wagga Wagga Wide Bay Canberra Albury NSW Central Coast Griffith Horsham NSW Mid North Coast Mildura Newcastle South East NSW Sunshine Coast Tamworth Wodonga Sydney Ballarat Bathurst Coffs Harbour Dubbo Echuca NSW Far North Coast Gold Coast Mudgee Toowoomba Melbourne
  • 6.
    6 Overview The backbone ofany commercial investment is its lease agreement. Without a solid tenant and reasonable returns, you’re left holding a substantially less appealing piece of real estate. This month, we’re taking a look at office space around the nation and drilling down into the area of rentals. Not only are we studying the sector location by location, but there’s observations comparing prime to secondary, plus an outlook on what to expect over the rest of the year. Sydney Key trends throughout Sydney are continuing to drive change in both the CBD and metropolitan office markets. Major infrastructure projects and secondary office space conversions are at the forefront of this change. The NSW government is expected to spend $68.6 billion over four years on planned infrastructure projects including the Sydney Metro and North West Rail Links. The Sydney CBD office market comprises 55% prime grade space (premium and A grade) and 45% secondary grade space. At the beginning of 2016, Sydney CBD gross face rents typically ranged from $735 to $1,070 per square metre per annum for A grade buildings and between $550 and $750 per square metre per annum for secondary grade buildings. Over the 12 months to March 2016, gross face A grade rentals have increased by 3%, a result of strong demand for prime space in the CBD. Tightening of leasing incentives within the secondary office market has been occurring, largely as a result of a significant amount of stock being withdrawn or earmarked to be withdrawn from the market over the next number of years. A significant portion of stock, primarily B and C grade assets, is being acquired by the state government for construction of the Sydney Metro rail network. The Barangaroo Development continues to alter the dynamic of the CBD commercial market with strong tenant demand in the western precinct which neighbours the city core and Barangaroo precincts to the north. Approximately 38% of CBD leases recorded in the 12 months to March 2016 occurred within this precinct, being a strategic location for businesses looking to service clients in both the city core and Barangaroo. An emerging tenant trend within the Sydney CBD market is the growing demand from the IT and communication sector, led by deals with major technology companies such as Apple, Amazon, Twitter and LinkedIn. The finance and insurance and property and business services sectors continue to make up the majority of tenant demand in the Sydney CBD. These two sectors accounted for 60% of leases signed during the past 12 months. These tenants are contributing to the rise in prime grade rentals seen in recent times. Generally speaking, similar trends are being experienced in the Sydney metro office markets which include North Sydney, St Leonards, Chatswood, Macquarie Park and Parramatta. In line with the strengthening of the residential market, vacancy rates in metro markets have generally been experiencing a downward motion which has been driven by a significant withdrawal of underperforming office assets acquired for residential conversion. Additionally, the Sydney Metro rail network project will further amplify this trend due to secondary office building acquisitions coupled with stronger public transport links, in particular by connecting these areas to the Sydney CBD. Canberra This comment will focus on the impact of the tenant in maintaining capital value. There has been much comment about the high value of transactions in the ACT commercial office market. The product being sold is solidly leased buildings with WALEs in excess of seven years predominantly leased to Commonwealth government departments or agencies. The yields being achieved from the recent spate of sales are in the order of 7.5% to in excess of 8.5%. These yields and WALEs as part of a composite national portfolio of properties boost the average return. Commercial Month in Review June 2016 New South Wales
  • 7.
    7 To achieve longterm WALEs in older buildings we are aware that heavy incentives are being offered to tenants. The incentives include substantial rent free periods and capital support for fitout. One example had a face rent of $410 per square metre, a new lease term of ten years and the incentive package equated to 30%. The capital value of the asset is protected but at a much lower level of value had incentives not been required. Recent sales that illustrate the strength of the market include: 73 Northbourne Avenue Purchase Price $29.2 million Leased Area 6,100 square metres WALE Yield Circa 8.75% Australia Place, 14 Mort Street Purchase Price $41.5 million Leased Area 9,384 square metres WALE New 10 year lease Yield Circa 7.5% An example of the difficulty experienced when a tenant vacates and the property is sold with vacant possession: Gladstone Street Fyshwick Sale 1 Sale 2 2007 Sale 03/16 (Under Contract) Price $6.1 million $3.56 million Area: Office: 1,860sqm Office: 1,860sqm Warehouse: 703sqm Warehouse: 703sqm WALE circa 4 years WALE vacant Yield circa 7.5% Yield vacant It can be seen from the above that the term of the lease is paramount to the value of a commercial holding. Illawarra The Illawarra office market has shown clear signs of improvement over the past two years with an increase in sales volumes, demonstrating improved confidence after a prolonged period of static conditions. Investment transactions have increased as investors are enticed back to the market by yield arbitrage that is becoming scarce in the capital cities. Most investors are still driven by good quality assets, strong lease covenants and rental security. However, price point is becoming less of a factor with demand still evident for higher valued assets (plus circa $5 million). In addition to local buyers, the region is attracting investors from Sydney, interstate and overseas. Owner-occupiers remain active in the sub $1 million price range. Low interest rates, a recovery in the development site market and the increased buyer depth has resulted in yield compression despite rents largely remaining stagnant. Low interest rates are a significant driver in the local market and also have made it more attractive for tenants to become owners. The development of several large strata titled mixed-use projects in the Wollongong CBD may convert some existing and potential tenants to owner-occupiers. Commercial leasing conditions in the Illawarra region have improved slightly with government tenants a major driver in the leasing market. This is evident by State Emergency Services leasing the former ATO office building in the Wollongong CBD. Incentives remain common with discounts between 5% and 15% of gross annual rent usually required to attract a new tenant. Incentives are usually in the form of a rent free period. There is growing evidence of a market split between A grade space which has low vacancy rates and good demand and lower quality B and C grade space which have higher vacancy rates and modest demand. All tenants however are driven by affordability and therefore we see limited upward pressure on rents. Commercial Month in Review June 2016
  • 8.
    8 Newcastle Midway through 2016and we’re seeing a continuation of high vacancy levels for C and D grade office property. Perhaps surprisingly, vacancy rates for A grade property have risen sharply from their historically low levels of the past few years. Figures as at January 2016 released by the Property Council of Australia have shown that total vacancies in Newcastle CBD office space have skipped out to 12.4%, the highest vacancy factor since 2010. This is a sharp doubling of the vacancy factor over the previous 12 month period. Vacancy has increased in all office grades and has jumped from 6.7% to a worrying 25% for D grade space in the 12 months to January 2016. This D grade vacancy, while troubling, is contained somewhat to the largely vacant office space within the GPT / Urban Growth owned development site centred around the Hunter Street Mall. There is an unusual dynamic currently at play within the Newcastle CBD office market as property for sale is limited and office space vacancy is very high. Investors are looking more at potential development and change of use opportunities rather than straight investment property as downward pressure on rental returns is building. Lismore Lismore remains in an oversupply situation with downward pressure on rents. This is more evident in secondary locations. Superior quality space in superior locations is generally holding. Secondary locations experience extended letting up periods with the need to offer additional fit-out or rent free periods to obtain longer term leases. General market levels are: • Prime office – $300 to $350 per square metre • Medium range accommodation – $200 to $250 per square metre • Fringe – $80 to $150 per square metre We would expect secondary locations to remain difficult to lease. In addition, there is a 3,000 square metre office complex under construction in the Lismore CBD which is understood to have letters of offer for a significant part. We understand these tenants are predominantly relocating from other locations and therefore will result in increased vacancies throughout the CBD and further downward pressure on rents. Coffs Harbour The commercial office market remains steady. There is a gradual uptake of the oversupply from 2014 and 2015. There have been some recent redevelopments of new small strata office space suited to owner- occupation. Economic policy in regional NSW is restricting the government sector, with limited evidence of freshly negotiated leases or growth as a consequence of the lack of expansion of existing departments. Market rental increase negotiations at reviews are generally moving at CPI or 2% to 3% per annum. There is some evidence of rent free incentives for new leases. General market levels are: • Prime Office – $350 to $420 per square metre • Medium range accommodation – $300 to $350 per square metre • Fringe – $200 to $300 per square metre Commercial Month in Review June 2016
  • 9.
    9 Melbourne The commercial transactionvolume in Melbourne has slowed down in recent months. Although the Reserve Bank of Australia (RBA) Board reduced the target cash rate by 25 basis points to a historic low of 1.75% in May 2016, both local and offshore investors appear to be holding off transactions until the Federal Election in July and the uncertainties in current financing and new government measures become more clear. Both the Foreign Resident Capital Gain Withholding Payments introduced by ATO and the increase in additional duty payable for residential properties from 3% to 7% imposed on foreign investors in Victoria will be effective from 1 July 2016. The new withholding regime implies that where a foreign resident disposes of Australia real property with a market value of $2 million or above, the purchaser is required to deduct 10% from the purchase price and pay it to the ATO unless the vendor has a tax clearance certificate. For foreign investors disposing of property, this means their sale proceeds will reduce by 10%. It is possible that these measures may reduce foreign investment appetite in Australia as foreign investors could become more cautious of the Melbourne investment environment, particularly if more measures targeting offshore investors are implemented in the near future. For CBD commercial sites with development potential, transaction volumes have been slow since the interim planning restrictions were introduced in September 2015. This market segment has lost momentum due to the uncertainty this has created. Prospective purchasers appear to be more cautious in the current planning environment and are willing to hold off purchasing development sites until the permanent planning controls are introduced in September 2016. It is apparent at this stage however that the interim planning restrictions have had negative impacts on development land within the CBD if planning approvals had not been secured prior to the planning changes. City fringe and inner suburban development sites continue to benefit from the shift in developers’ interest from the Melbourne CBD. A number of developers, both local and offshore, are willing to pay premiums to secure prime development sites. Competition is fierce for properties with holding income and development upside. For instance, two commercial properties at 10 and 12-16 Cecil Place Prahran were sold in one line for $11.35 million, reflecting approximately $8,923 per square metre of improved land. The sale price was reported to have been circa $2.85 million above the expected price. As a result of the current economic conditions, including record-low interest rates, we are witnessing growing demand from owner-occupiers in the Melbourne office sector. Deloittes Access Economics reported that Melbourne experienced the fastest white collar employment growth in Greater Melbourne in 2015 over the past five years. According to the Property Council of Australia’s Office Market Report, Melbourne CBD’s office vacancy rate improved in the 12 months to January 2016 to 7.7%, down from 9.1%, owing to the new entrants into the market, expansion and relocations to the Melbourne CBD. Tenant demand in the CBD is mainly driven by the professional services, information technology and financial services sectors. Net face rents for prime and secondary CBD office space ranges from $480 to $670 per square metre per annum and $300 to $420 per square metre per annum respectively, with an average incentive of circa 25% to 30% and 27% to 33% respectively. Vacancy in St Kilda Road has continued to decrease over the past 12 months to 8.9% as at April 2016. It is reported that the office market stock has shrunk by approximately 20% from its peak in 1992. The subsequent withdrawal of office space has led to a decline in secondary office vacancy levels. It is anticipated that a further 130,300 square metre of office space will be permanently withdrawn from St Kilda Road over the short to medium term. Current net face rent for prime and secondary office space ranges from $300 to $350 per square metre per Commercial Month in Review June 2016 Victoria
  • 10.
    10 annum and $250to $300 per square metre per annum respectively, with an average incentive of circa 20% to 25% and 20% to 30% respectively. The decline in vacancy rate in the six months to March 2016 to 5.29% from 6.2% in the inner eastern suburbs as well as a year to year (March 2016) increase of circa 10% for average A grade net effective rent in city fringe/inner east, reflect the growing demand for office space by both tenants and owner-occupiers. Despite the strong demand in the inner east due to proximity to public transport and employment base, the lack of supply of new office space over the past year is the other reason behind the strengthening rental rates. In addition to the limited new commercial developments in the inner east, a number of older commercial buildings with development potential have also been purchased by developers which further constrain the supply of commercial office supply. Rental demand is strong at present for city fringe or inner-eastern office properties with good exposure and accommodation. Demand however, is static for secondary offices located in outer east or south- east metropolitan areas. There is an influx of prime grade and smaller space supply to the market owing to new developments and tenants migrating to city fringe or inner east for better accommodation and infrastructure. Landlords of secondary commercial buildings are offering big incentives to attract tenants in order to compete with A grade and newer prime grade offices. Ballarat The quality office market in Ballarat could best be described as tight. The amount of A grade space in the city is limited as is the pool of prospective tenants who require large amounts of space and have the capacity to pay for it. Consequently when consumers of space enter or exit the market the effects on the market can be material. At present there is a significant under supply of A grade space in the Ballarat CBD. We are aware of two parties that have been attempting to secure A grade areas of around 1,500 square metres for around six months, however to date they have had little success. This information has found its way to ears attached to agents and landlords who will be all too happy to pass it on to their tenants at market review time. Macro economic drivers of office rents include the health of the corporate sector and overall economy. As Australia’s economy transitions from mining and commodity production to a science and technology base it would be fair to surmise the demand for quality space will continue to grow. On a more local level the state government is showing a positive attitude toward the decentralisation of Victoria to regional centres such as Ballarat, Bendigo and Geelong. Upgrades to the Ballarat train line and the Ballarat West employment zone are part of the slated $30 million to be injected in the area. This should also have a positive impact on demand for space. Overall within the market there is an expectation that rents are increasing and will continue to do so over the short term. For several years now rental rates in the area for quality space have hovered between $250 and $300 per square metre. However the past six months have not seen many holdings of A grade space transact for less than $290 per square metre. Rates for secondary space vary to a larger extent than A grade space. There is a lot more of this space on the market and a lot more parties that require it. It usually transacts for between $100 and $200 per square metre depending on the lease covenants. Echuca Office rentals are likely to come under some downward pressure in the short term with limited demand and multiple options after the building formerly occupied by Cosgriff Solicitors was vacated. We note the construction of a new purpose built accommodation at Sturt Street which is to be owner-occupied by M&S Accountants who will vacate Commercial Month in Review June 2016
  • 11.
    11 their existing accommodationat Annesley Street. Further development on Annesley Street is likely with the former Bella Cibo Restaurant advertised for redevelopment into office space. Rents for standard office buildings can range from $200 to $300 per square metre per annum depending on size, location and quality of the building. Mildura Office rents in the Mildura CBD typically range between $125 and $180 per square metre net, depending on the size, standard and location of the premises. The higher end is typically occupied by national businesses, who often require more modern, well presented premises, while the lower end is typically occupied by local businesses or organisations, many of whom have been long term tenants. Rents have been stable in recent years, and we would expect this to continue. There are a number of vacant offices (mostly older style) in Mildura and as a result there have not been many significant new office developments in recent times. New construction would only be contemplated by a developer with a lease pre-commitment. Many local businesses own their premises via their self managed superannuation funds and this contributes to a lack of churn in the local office space. Bendigo In recent times Bendigo has seen little movement in the office sales and leasing sector. New, high quality office space in the CBD is highly sought after and is typically let at rates of $300 per square metre and above. Older style office accommodation is typically let between $150 and $250 per square metre. The variation between prime and secondary office space rates per square metre is typically around the $100 mark. Bendigo more recently has seen a rise in mixed use development within the CBD incorporating retail, office and residential space. Interestingly, the gap between ground floor and first floor rates per square metre is noticeably beginning to decrease, particularly for buildings fitted with an elevator. Pall Mall, View Street and Myers Street are locations that have recently undergone or are undergoing this type of development with relative success. The property in Pall Mall for example has a steady not for profit tenant with 700 square metres of office space on a ten year lease. A notable prime office sale at 71-75 Bridge Street achieved an analysed yield of 4.38% and a sale price of $7 million. This was an extraordinary sale where a purpose built building was constructed with a below average yield. The purchase was made by a local organisation in August 2015. A secondary class office sale located at 26-28 St Andrews Avenue sold for $1.6 million with an analysed yield of 7.47% in November 2015. The office market in Bendigo is relatively stable in terms of supply and demand. There is a distinctly limited supply of quality office space for lease outside of the city centre as this sector is typically owner-occupied. Commercial Month in Review June 2016
  • 12.
    12 Adelaide Throughout 2015 andinto 2016 the economic climate in South Australia has been subdued. This has had a dampening effect on commercial markets generally and has had an impact on the Adelaide CBD and fringe markets. The announcement that Arrium is under the control of administrators is another blow to an already strained regional economy. Employing over 3,000 people this has a significant destabilising effect throughout the state which is still dealing with the continuing decline of the manufacturing sector. Recent media reports indicate that modelling undertaken by Flinders University has estimated the state-wide economic impact of the Arrium closure to be $770 million. The announcement that Federal Government has secured a submarine manufacturing deal which supports local construction may potentially offer some relief but the extent of the benefit remains to be seen. Media reports are estimating that 3,000 jobs will be created with the construction of a new factory imminent. In an economic climate such as this, office leasing continues to be a challenging environment. Agents are reporting that there is little incentive for tenants to act quickly with little competition in the market. This is leading to a growing use of incentives which is masking the true impact of the market stagnation. This is particularly noticeable within lower grade office space with vacancy growing as businesses gravitate towards premium grade smaller accommodation which is more functional and may have a lower overall cost. That said, the vacancy rate within premium grades in the Adelaide CBD at 7% (Property Council of Australia data as at January 2016) is only considered low by comparison with C grade being 16.5% and D grade accommodation at over 20.5%. While the vacancy rates aren’t very comforting more concerning reports are from agents who are finding the leasing market increasingly risk adverse making it difficult to finalise agreements. The general expectation is that rental rates have not improved and are not likely to in the immediate future, however some positive signs are around. Employment statistics show a firming of the unemployment rate from a national high in September 2015 of 7.9% down to 5.7% in March 2016. Additionally the appeal of development within the CBD is resulting in older lower grade office buildings being converted to residential apartments. The altered use of these building may eventually contribute to a reduced supply of office space and assist in increased rentals throughout the CBD. Commercial Month in Review June 2016 South Australia
  • 13.
    13 Brisbane CBD Office Market TheBrisbane CBD is currently undergoing a significant change and expansion through the development of three buildings on the boundaries of the CBD. With 180 Ann Street and 480 Queen Street now complete and 1 William Street nearing completion, we are beginning to see the impact of these developments on the overall leasing market. The latest Property Council of Australia figures as at January 2016, report the current vacancy rate of the Brisbane CBD to be at 14.9% but this will rise to near 17% once the new accommodation is added to the supply figures. As premium office accommodation continues to enter the market, we have seen a tightening in vacancy rates and rental incentives between premium grade buildings and older style, B grade accommodation noting that B grade vacancy rates were reported at 19.4%. Prime vacancy rates are predicted to increase to above 16.5% and it is believed that this vacancy rate will force further refurbishment or withdrawal of older stock. The January 2016 figures indicate that the market has recorded its third consecutive year of negative net absorption, reported at approximately 17,000 square metres. The upside to the current vacancy rates is that prime office properties such as Waterfront Place and Riverside Centre are able to implement rolling refurbishment programs after having maintained premium grade ratings for a lengthy period without refurbishments. The rolling refurbishment programs will allow the properties to be repositioned within the market and capitalise on the next round of anticipated major tenant moves later in the decade. Gross face rents have remained unchanged however incentives have continued to increase, currently ranging between 35% and 40%, which has resulted in a decline in effective rentals. Incentives are anticipated to remain high over the coming 12 to 24 months. Another notable recent issue is that the CBD markets are now being hit with significant increases in statutory site values. These are generally between 20% and 30% however in some locations can be as much as 70% to 80%. This will increase statutory outgoings and further negatively impact on the net income of owners over the next three years. Capital values are therefore expected to remain stagnant at best and may in some instances fall for second tier buildings if there is no further yield compression. Fringe CBD Office Market Leasing activity has continued within the fringe CBD locations in particular within the inner south and urban renewal locales. The majority of recent transactions has occurred within these locales due to the provision of high levels of amenity, public transport and proximity to the CBD. Overall vacancy rates for the fringe CBD were reported by the PCA in January 2016 at 12.5% while the inner south and urban renewal locales reported vacancy rates at 9.7% and 10.6% respectively. The Spring Hill and Milton areas have continued to come under pressure for residential conversion in particular with the Spring Hill Neighbourhood Plan progressing through the approval process. With a declining office market, it is anticipated these areas will see further withdrawals of stock as the highest and best use of a number of these assets changes to residential use. Due to the current leasing market within the fringe CBD locations, demand from investors continues for stock with a secure WALE and strong tenancy profile but there is very limited good quality stock available. Amenities, end of trip facilities, proximity and access to the Brisbane CBD as well as public transport continue to be the major drivers for tenants and as such, we anticipate seeing a further differentiation between the inner south and urban renewal locales in comparison to the Spring Hill and Milton markets. Commercial Month in Review June 2016 Queensland
  • 14.
    14 Suburban Office Markets Withthe exception of a few bright spots, (for example, Eight Mile Plains and North Lakes), the suburban office markets are best described as slow and relatively stagnant. Leasing activity has been generally flat, with commercial accommodation currently remaining vacant for extended periods. In some locations, local agents report very little enquiry at all. Rental rates within this market currently range between $200 and $400 per square metre of NLA gross per annum while incentives generally range between 10% and 20%. There is steady buyer demand from owner occupiers for good locations, as they take advantage of the low interest rate environment where interest costs are well under leasing rates. Generally such properties are less than $2 million, with a predominance of sub- $1 million properties. Investment yields continue to range between 7.5% and 10% with properties reflecting secure WALEs attracting a strong level of interest. One of the most notable large office investment sales within the first quarter of 2016 was 7 Brandl Street, Eight Mile Plains for $25.5 million reflecting a WALE of 5.2 years and a yield of circa 7.7%. However sales activity for high value properties where there is a poor lease profile is low. Toowoomba The office market in Toowoomba is predominantly found in the CBD and fringe CBD areas with some office use properties in established suburbs which generally comprise former dwellings or former shops converted to professional office or paramedical facilities. A former bakery and small convenience supermarket have recently been converted to professional offices, located out of the CBD fringe but on major arterial roads within five to ten minutes of the CBD, with high exposure, easy access and good on site car parking. Both projects have been driven by owner occupiers. Leasing demand in 2015 was considered moderate with office rentals remaining relatively static. Gross face rents for prime office buildings sit at around $375 per square metre to $400 per square metre per annum gross. Any new development would likely require rentals at the upper parameter to be feasible. Secondary office space continued to be low in line with softer tenant demand, with rents showing a wide range from circa $180 to $260 per square metre per annum gross. The slow market conditions have seen the introduction of some rental incentives as landlords compete for tenants. There have been no new major office building developments in Toowoomba during 2015 or to date in 2016, with only a small development recently completed on the corner of Herries and Phillip Streets. This building is partly owner occupied. The lack of activity is seen as a result of limited demand and need for extensive lease pre-commitment and market leading rentals to make projects feasible. The Department of Transport and Main Roads had been sourcing a 2,500 square metre office tenancy within the Toowoomba CBD or CBD fringe. A tenancy of this size is considered very large by Toowoomba office standards with the requirement most likely fulfilled by the development of a new building. The low interest rates have resulted in a strong demand for commercial properties from investors, however the lack of supply of quality, fully leased properties has limited the number of investment sales. The limited investment sales have indicated yields of between 7.5% and 8.5%. Other investment sales of note were in Capital Place, a large modern office building that was strata-titled. These units have sold at prices ranging from $225,000 to $965,000 at circa mid 8% net yields. Other larger office buildings, Petard House and the James Cook Centre were unsuccessfully marketed in 2014. Both were in the Commercial Month in Review June 2016
  • 15.
    15 $5 million to$10 million price bracket with a limited number of potential buyers. The James Cook Centre is now under contract due to settle 03 June 2016 for $11.65 million with an analysed yield of 9.69%, including a 5% vacancy rate and a WALE of 2.8 years. The sub $1 million price bracket however remains strong with a significantly increased number of buyers in this market segment. Capital values for larger commercial buildings increased slightly in 2015 and are now considered stable. There has been strong demand from owner occupiers for smaller offices in the $300,000 to $600,000 price range. These offices are often former houses converted for professional use and provide easy access for employees and clients and good off street car parking. A diminishing supply within this segment has resulted in a slightly stronger increase in values. The Toowoomba office market is expected to remain stable over the coming year. Gold Coast The Gold Coast is a coastal, metropolitan region with an economy primarily driven by tourism, education and construction. The commercial rental market for office properties is heavily underpinned by local businesses interrelated with the key economic drivers. Southport remains a popular locale for the legal profession, given that the Magistrates Court is based in the business precinct. The Gold Coast City Council over recent years has acquired several office buildings in Bundall and has now generally relocated all departments into this business precinct. There are several long standing government departments at Nerang, as well as some at Robina. Robina and Varsity Lakes have seen the majority of office development on the Gold Coast over the past ten to 15 years and as such, offer a more modern standard of office accommodation in comparison to the older established office precincts of Southport, Surfers Paradise and Bundall. Broadbeach is the fifth office precinct within the Gold Coast market, however represents only a small percentage of the overall supply. There are few dedicated office buildings within Broadbeach, with more recent office supply coming in the form of mixed use developments such as The Oracle, The Wave and Sonata where the office component encompasses the lower floor levels generally above ground level retail floor space. The office market on the Gold Coast is not terribly large compared to the capital cities. The five office precincts mentioned above are the subject of the Property Council of Australia biannual office survey. As at January 2016, the sum total supply was 472,250 square metres, with a total vacancy factor of 13.6%. While still high, this level is a vast improvement on the high of 24.1% in January 2011. Disparity remains between different grades of office stock. The lower C and D grade categories that make up 32% of the stock reflect the lowest vacancy at 11%. B grade makes up 40% of the stock and reflects a vacancy of 14.1%. A grade at 28% of the stock reflects the highest vacancy at 15.9%. It is noteworthy that the city’s total absorption rates appear to be increasing, with higher grade stock actually experiencing net absorption on par with the secondary markets. The positive absorption and broad decrease in vacancy across the Gold Coast’s office precincts would appear to have strengthened the rental market, particularly over the past couple of years. Many precincts have demonstrated moderate rental uplift, with an accompanying generally decreasing level of incentives offered. Where owners may have been coerced to maintain rentals in a static position in some cases, we have also noted that more often no incentives have been provided. As a general observation, across the board the average rental level for C and B grade stock would appear to fall within the range of $325 to $375 per square metre per annum gross. Car parking is in addition and will range from $100 to $150 per bay per calendar month. For smaller and more tightly held precincts such as Broadbeach, the rental levels are higher at $425 to Commercial Month in Review June 2016
  • 16.
    16 $550 per squaremetre per annum gross, although we have been advised of rental for lease renewals in The Oracle of up to $600 per square metre per annum gross. This space tends to be B grade standard or above. With very few additions to the supply over the past several years, we have seen an increase in the number of entrepreneurial investors purchasing older, largely vacant office buildings for refurbishment. Examples include 50 Cavill Avenue in Surfers Paradise, Kaybank Plaza in Southport and Lakehouse Corporate Space at Robina. The intent of these investors is to upgrade and then attract tenants with competitively priced floor space. The substantial A grade office building 50 Cavill Avenue at Surfers Paradise had several leases negotiated in early 2016 at levels around $450 per square metre per annum gross. This is also the time when purchase of the property by GDI Property Group settled after a lengthy marketing campaign at the behest of receivers and managers. GDI stated they intend to commence a refurbishment program and reinstate 50 Cavill Avenue as the Gold Coast’s pre-eminent office building. We consider that going forward, this building will see uplift in its rental rates. In summary, the pendulum for the office leasing sector is probably moving back more in favour of landlords. On 4 May 2016, the Reserve Bank of Australia further slashed the cash rate by 0.25 percentage points to a historic low target rate of 1.75%. The Gold Coast has a high percentage of strata premises, which are dominated by owner-occupiers. The RBA’s latest monetary policy decision is likely to further stimulate this dynamic. As a flow on effect, office occupants may see it as more advantageous to buy their own premises rather than lease. Sunshine Coast The rental rate for the Sunshine Coast office market has generally remained steady over the past three years. We note that over the past 12 months we have seen a drop in overall vacancy levels, which has begun to place some upward pressure on rental levels. Generally, we are seeing gross effective rents for prime office complexes with good views from $440 to $500 per square metre, which has seen a circa 5% to 10% increase over the past three years. Our secondary rates generally range from $350 to $425 per square metre for good quality space, however have some issues around either location or lack of views etc. Other, older B, C and D grade stock typically ranges between $200 to $350 per square metre depending on size and location. While vacancy has begun to improve over the past 12 months, there is a significant level of stock still to enter the market over the next 12 months which will have significant impacts on vacancy levels. We primarily see this impacting on the secondary type stock that are good quality complexes, though do not have the views of say the office holdings around Cotton Tree and Maroochydore. It will likely impact on complexes around areas like the Kawana Business Village, Primary School Court at Maroochydore and Carnaby Street, which in most cases have good quality office accommodation, though with limited or no real views. This stock will compete with new stock in a central location at Maroochydore and extensive incentives are likely to enter the market of up to 25% of face rentals, as seen in previous cycles. We have recently seen some good activity in the strata titled office market for holdings under $1 million with an uplift in value levels for both investment holdings and owner-occupier stock, however, there appears to have been a slow down in this market over the past two to three months as the market begins to factor in the income supply of circa Commercial Month in Review June 2016
  • 17.
    17 15,000 square metresor approximately 10% of the current market. Wide Bay The office rental market in Bundaberg has seen stable values in the 2016 year to date. The modern offices along Barolin Street and offices suited to medical professionals have seen the highest rental levels at between $300 and $450 per square metre per annum. The total rental quantum on a per annum basis is a strong contributing factor to the rental rate per square metre above the circa $60,000 per annum. Secondary office locations are scattered around the CBD and range between $100 and $200 per square metre. Secondary locations are considered to be under downward pressure. The preliminary data indicates that there has been a slow start to the 2016 year for commercial markets in general. The upcoming local infrastructure projects may influence office rental markets to some extent, while rental growth prospects are limited. Gladstone The office market for 2016 has remained relatively flat in line with 2015, with tenants keeping hold of negotiating power in new leases and when exercising option periods. Over the past 12 to 18 months we have seen some reductions in rental levels of about 30% and we anticipate this to continue until rentals begin to flatten out. Tenants that previously occupied upper levels with relatively little exposure are now able to relocate to ground floor tenancies with street frontage at comparable rentals. This has been a result of falling demand for office accommodation since peak workforce numbers on local LNG projects were dramatically scaled back. Drivers for prime rentals in Gladstone generally relate to location, exposure and quality/presentation of the building and tenancy. Rockhampton The Rockhampton office market has remained relatively stable so far in 2016. Unlike metro localities, it is difficult to classify office space in Rockhampton, however we consider most prime office rental rates are being achieved in central CBD locations within modern or renovated buildings and with good car parking allocations. We have seen prime office rentals between $300 and $350 per square metre gross, however the rentals can very depending on how much car parking is included. There is some good quality office accommodation rented at a slightly lower $250 to $300 per square metre gross range. Secondary office rentals are generally $150 to $200 per square metre gross range (depending on a variety of factors including size), with characteristics typical of this office class being in secondary locations or buildings, poor on site car parking or being upper floor walk up office space. The market for this walk up office accommodation is becoming increasingly difficult to let due to increased demand for disability access to tenancies. Overall, we consider office rents to be generally stable, with some slight downward pressure apparent on secondary accommodation. Mackay Broadly speaking, demand for retail and commercial space in the Mackay region is relatively soft. This is predominantly due to the slowdown in the coal industry resulting in loss of employment and concern regarding the future of the local economy. Commercial rental levels have eased considerably since mid 2014 due to a combination of oversupply and adverse local economic conditions. Lengthy leasing up periods and rent free periods to attract tenants has become common. Some businesses have taken the opportunity to purchase their own premises as owner-occupiers due to low interest rates and the availability of properties in the area. Generally, rents for prime properties in the Mackay CBD are in the range of $275 to $375 per square metre gross and secondary properties are achieving rents in the range of $160 to $275 per square metre gross per annum. However, recently negotiated rents indicate a fairly broad range and inconsistencies in the levels at which tenants are negotiating. We have witnessed some tenants negotiate bargains in recent months. It is yet to be seen where the rents will consolidate in these ranges. Commercial Month in Review June 2016
  • 18.
    18 Townsville Townsville’s office marketremains entrenched at the bottom of the market cycle, with high vacancy rates, low levels of business confidence and very little in the way of local stimulus or broader economic drivers to indicate any change in this sector's current position. The CBD rental market continues to experience weakness in demand with rental rates continuing to suffer downward pressure as a result, triggering increases in leasing incentives in order to attract tenants. There is an on-going concern that current short lease terms and high incentives are simply attracting opportunistic tenants or new first time businesses into the office market that will have little commitment to the longer term. Even though the office market remains slow, sales that do take place especially at the higher end are strongly priced and remain indicative of the higher returns available in the market. These sales, including the recent Tax Office building sale, demonstrate that there is southern and foreign cash available and long term confidence in the Townsville market, especially compared to very competitive environments in the major capitals with lower returns on investment. These factors bode well for the future of the Townsville market once it regains its normal traction. Cairns The Cairns office market is relatively shallow and experiences limited sales activity. The market has also experienced limited new development, with the last large office building constructed in Cairns being the State Government office tower completed in 2010. There are no known new developments in the pipeline. Commercial property sales in Cairns, inclusive of retail and commercial office premises, remain well below the peak levels achieved from 2005 to 2007. Nevertheless the market has been slowly rebuilding in sales volume since 2010. Prices paid for strata titled premises have been relatively stable since 2010 at around $2,500 to $3,000 per square metre of floor area. Most new office space leasing demand is for smaller areas and for modern, good quality green star rated premises, however there is only a handful of such buildings in Cairns. These buildings achieve high levels of occupancy and are experiencing stable rent levels typically of $350 to $400 per square metre per annum. Demand for lesser quality space remains limited and there is a large oversupply even of good quality non-inner CBD and well exposed secondary space. These conditions have placed downward pressure on secondary rents and have seen the emergence of incentives. Overall there has been little change in the Cairns office market during the past twelve months and we see no evidence that the current situation will change for the remainder of 2016. Commercial Month in Review June 2016
  • 19.
    19 Darwin The Darwin officemarket remains quite weak with little relief on the horizon. The Northern Territory Government has vacated a number of buildings in town and there does not appear to be any alternative large scale lessees. On 5 April 2016, the Northern Territory Government announced it was seeking expressions of interest for a new headquarters for the Department of Health. The facility is expected to be constructed in either the Darwin or Palmerston CBD and would be expected to be in place by 2018 or 2019. The Government sees a number of efficiencies in having the department in one location. Consistent with the Property Council of Australia, we would strongly urge the Northern Territory Government to consider refurbishment of an existing development for this project rather than construction of a new building. Existing space needs to be absorbed back into the market rather than increase supply at a time when the Darwin CBD office vacancy rate exceeds 20%. The Planning Minister has agreed to consider Darwin City Council’s CBD Master Plan as background material for the NT Planning Scheme. The CBD Master Plan includes a number of proposals to manage the city’s growth especially in regard to future transport links, infill housing, parking and public open space. The plan includes some bold proposals and it will be interesting to see which of these (if any) become a reality over the next 20 years. Commercial Month in Review June 2016 Northern Territory
  • 20.
    20 Perth Leasing conditions inthe Perth commercial office market remain stagnant amid weakening demand. As resources-related companies continue to reduce staff numbers and functions, demand for office space in Perth has continued to fall over the past six months. The size of the Perth CBD office market is some 1.646 million square metres of lettable space, of which approximately 960,000 square metres, just over half, comprises of prime (premium and A grade) space and the remainder of the 686,000 square metres is secondary (B, C and D grade). The Property Council’s latest Office Market Report found that the vacancy rate increased from 16.6% to 19.2% during the six months to January 2016. Nationally, the Australian CBD vacancy rate increased to 10.9%. In West Perth, office vacancy rose from 10.8% to 12.2% in the six months to January 2016. In the six months to January 2016, an additional 113,463 square metres of new office supply was added to the Perth CBD market. The current vacancy amounts to about 210 whole floors of office space available for lease in the Perth CBD market, assuming an average floor plate of 1,500 square metres. Iron ore prices began to fall in September 2012 and after they failed to recover, many projects began to be put on hold. By late 2013, with office demand beginning to fall, incentives began to rise, resulting in a decline in effective rents. The current average incentive offered in the Perth CBD is 40% to 50% however in lower grade space this can be higher. Current face rents in Perth are $500 to $700 per square metre per annum net for Prime or A grade and $300 to $400 per square metre per annum net for B grade, showing a disparity of approximately 40% between office grades. In December we predicted that owners would begin to divest of their assets or portfolios and look for other opportunities in other markets. Sales in the Perth CBD in the six months since December 2015 have amounted to $460 million, which when compared to the five year 12 month average of just $725 million shows that sales activity is on the rise, especially when you consider that for the whole of 2015, approximately $250 million worth of real estate transacted in the Perth CBD. We also predicted in December 2015 that tenants would use this opportunity to renegotiate leases or move to better space (with the landlord paying for the fitout). This means that lower grade space will suffer most as the flight will be to premium grade locations and space. This again has proven to be correct with a plethora of movement occurring across town. There is a significant amount of new supply entering the market which remains uncommitted, adding to an already high vacancy. There are no real indications that the resource sector will suddenly re-engage and fuel the demand for office space in Perth again. We think that we are in the early stages of a medium- term, stagnant office market. Space will need to be converted (for example to hotel, residential or educational use) or taken off-line and upgraded before things start to improve in terms of vacancy and rents. From an investment angle, yields have tightened to around 6% to 8% for prime grade assets and higher for lower grade assets. Perth has begun its transition from a mining town into a tourism based town. When James Packer finishes the expansion of his Crown Casino at Burswood (which includes a new hotel), the Elisabeth Quay on the Swan River is fully operational, offering new hospitality venues, hotels and apartments, other key infrastructure projects are completed Commercial Month in Review June 2016 Western Australia
  • 21.
    21 Commercial Month in Review June2016 (such as the new stadium at Burswood and Northlink development between the CBD and Northbridge) and planned expansions of regional shopping centres, we believe Perth will emerge as a tourism hub given our closer links in time and distance to the Asian hubs of Singapore, Malaysia and Indonesia. This transition phase is predicted to take another five years to complete, by which stage we hope to see an improvement in the local economy. South West WA Given the lack of quality office space available in the main towns in the South West and the continued good demand for A grade space, rents have held up very well. Rates of between $280 and $320 per square metre are being achieved in both Busselton and Bunbury, with higher rates for smaller areas under 100 square metres. Secondary office rates are achieving between $180 and $250 per square metre depending on location, due in part to the greater supply of secondary office space particularly in Bunbury. A grade office space is expected to remain stable until further space is developed. It is anticipated however that there will be downward pressure on rental values for secondary space, particularly for space further away from the CBD.
  • 22.
  • 23.
    National Property Clock June2016 Houses Entries coloured orange indicate positional change from last month. Liability limited by a scheme approved under Professional Standards Legislation. This scheme does not apply within Tasmania. This report is not intended to be comprehensive or render advice and neither Herron Todd White nor any persons involved in the preparation of this report, accepts any form of liability for its contents. Peak of Market Approaching Peak of Market Rising Market Start of Recovery Bottom of Market Starting to decline Declining Market Approaching Bottom of Market Melbourne NSW Central Coast Dubbo Newcastle Sydney South West WA Toowoomba Perth Alice Springs Darwin Emerald Gladstone Mackay Rockhampton Bundaberg Townsville Brisbane Hobart Burnie/Devenport Gippsland Hervey Bay Launceston Mildura Mount Gambier Warrnambool Whitsunday Adelaide Canberra Adelaide Hills Albury Barossa Valley Bathurst Bendigo Cairns Coffs Harbour NSW Far North Coast Griffith Iron Triangle Mudgee Orange Shepparton Sunshine Coast Tamworth Wagga Wagga Ballarat Echuca Gold Coast Horsham Ipswich NSW Mid North Coast South East NSW
  • 24.
    Peak of Market Approaching Peak ofMarket Rising Market Start of Recovery Bottom of Market Starting to decline Declining Market Approaching Bottom of Market National Property Clock June 2016 Units Entries coloured blue indicate positional change from last month. Liability limited by a scheme approved under Professional Standards Legislation. This scheme does not apply within Tasmania. This report is not intended to be comprehensive or render advice and neither Herron Todd White nor any persons involved in the preparation of this report, accepts any form of liability for its contents. Melbourne Dubbo Gold Coast Newcastle Sydney Brisbane Ballarat South West WA Toowoomba Perth Alice Springs Gladstone Mackay Darwin Emerald Rockhampton Whitsunday Canberra Bundaberg Townsville Warrnambool Adelaide Hobart Adelaide Hills Albury Barossa Valley Burnie/Devenport Cairns Gippsland Hervey Bay Iron Triangle Launceston Mildura Mount Gambier Shepparton Bathurst Bendigo Coffs Harbour Echuca NSW Far North Coast Griffith Mudgee Orange Sunshine Coast Tamworth Wagga Wagga NSW Central Coast Horsham Ipswich NSW Mid North Coast South East NSW
  • 25.
    25 Overview There’s nothing likethe end of the financial year to give us all a chance to reassess our position. You can check in on your strategy and ensure the second half of 2016 can be as successful as possible. As with previous years, we take stock during the June Issue of Month In Review to see how markets are tracking around the nation, and what you might expect for the remainder of this annum. Sydney The residential property market in Sydney to date in 2016 has exhibited mixed performance throughout different areas, price points and product types. There has also been a shift in market performance and confidence from the early post-Christmas months through to the approaching mid-year point. Various factors have had a role in influencing the local market with the mid-year point set to be in a stronger position than start of year predictions indicated. At the start of the year, most areas appeared to continue where 2015 left off with longer selling periods, lower auction clearance rates, decreased market confidence and in some cases lower than expected sales prices. This phase continued through to March when the market showed more positive signs of stabilisation. Overall however auction clearance rates remain below the levels of last year with auction numbers also decreasing significantly. The levels of property price growth demonstrated throughout 2014 and 2015 have not continued into 2016 in the Sydney market. Various market influences continue to fuel the uncertainty surrounding the local property sector including the recent interest rate cut, the impending election, possible apartment oversupply and restrictions on foreign purchasers. With the recent interest rate cut appearing to have an initial positive impact on auction clearance rates it must be remembered that most banks increased their mortgage rates late last year by about 0.2% points meaning the latest 0.25% point move from the RBA only takes home loan interest rates slightly lower than they were late last year. It is perhaps too early yet to tell if this will have any ongoing effect or if the previously tightened lending criteria and regulatory restrictions will continue to constrict the mortgage market with many consumers already feeling the pressure of high mortgage repayments. It was reported by Moody’s recently that home buyers in Sydney spent an average of 35.6% of their pay on mortgage payments, the highest in the country and higher than the average over the past ten years. The previous decline in investor activity appears to have shifted with the latest ABS lending finance data revealing a surge in residential investor activity. Loans for this group increased by 30% in March allowing $5.5 billion in lending, the highest monthly total since September last year. This could be partly due to the impending election with the future of negative gearing being questioned. Signs are emerging that the prospect of changes to negative gearing in 2017 is stimulating investors in Sydney’s housing market who appear keen to secure property under existing conditions, indicating that investors could be nervous that negative gearing will stop for all but new properties. With regards to levels of new stock in the city, CoreLogic has recently released a report revealing that record high unit construction is set to increase settlement risk. With apartment construction set to hit record highs over the next two years, latest figures from CoreLogic show a big disconnect in the volume of stock expected to settle over the next 12 to 24 months to the average number of unit sales annually over the past five years. This could culminate in an oversupply of units in many areas which would add further misery to an already slowed unit market. Coupled with this is that three of the four largest banks have announced they will no longer be lending to home buyers from overseas which not only increases settlement risk, but will also affect future demand from the slowing foreign purchaser market. As we attempt to gauge what is happening in the various local sub-regions the consensus appears to be consistent. The market performance in most Month in Review June 2016 Residential
  • 26.
    26 areas started theyear slow however stabilisation has occurred as we approach the mid-point of the year with some products and price points achieving subtle levels of market growth. In general it appears that the unit market, particularly in the inner city fringes, is taking longer to stabilise with many indicators suggesting that growth in this sector may still be hampered by oversupply, restrictions on foreign purchasers and possible negative gearing changes. As a summary of the various sub markets within Sydney we provide the following comments: South As a region, the southern suburbs have showed signs of decline and reduced market activity in the later months of 2015 through to March 2016 when they began to stabilise. The fringe suburbs of Engadine, Loftus, Bangor and Menai have shown a noticeable decline in sales prices since the peak of the market in October 2015, with properties in the sub-$1 million range suffering. Similarly, townhouses and units under $1 million in many areas have seen a decline particularly in the suburbs of Hurstville, Mortdale, Oatley and surrounding areas. An example of this is 14/17 Newman Street, Mortdale where a 3-bedroom townhouse sold for $862,500 in March 2016 compared with the sale of a similar townhouse in similar condition in the same complex for $905,000 in October 2015. The high influx of new development in the Hurstville region has also had a negative effect on overall values. In early 2016 in southern Sydney there have also been some strong results for brand new products over established homes. The choice between brand new versus older style on a larger parcel appears to show a preference for a new product over extra land with strong demand for new duplex style property. Recent activity includes a duplex at 673 Kingsway, Gymea which sold for $1.365 million. This activity can be property specific as there are examples including the following which highlight the weaker position at this mid $1.5 million price point: • 6 Waratah Street Bexley is a duplex which sold in April 2016 for $1.65 million after previously trading in May 2015 for $1.66 million; • The sale of 46a Parthenia Street in Dolans Bay for $1.95 million in November 2015 did not proceed and the property has since sold for $1,850,500 in March 2016 showing the decline in this region. • 43 Lomandra Place, Alfords Point sold for $1.685 million in March 2015 and has just resold for $1.67 million. East In Sydney’s east, market activity and market confidence has increased since the last quarter of 2015 and early 2016 with one of the main drivers in this region being the lack of quality stock. As building and renovation costs remain high in this region, we have seen renovated family homes achieving solid results, especially in beach side locations with price ranges of $2 million to $4 million. An example of this is a house once made famous by The Block television show located at 10 Tasman Street, Bondi, which was purchased at auction on the show in March 2013 for $1.37 million and recently sold in May 2016 for around $2.5 million with only the addition of a swimming pool since the previous purchase. Again it is the smaller sized investment units under $1 million which appear to have been the hardest hit since the market peak. Prices for many units at this price point have shown signs of flattening with limited growth throughout 2016. Less popular complexes or locations or units on busy roads require extended selling periods. Inner West In Sydney’s inner west and city fringe areas we have seen mixed results throughout the first half of this year. The year started very slowly with limited stock across all sectors making it hard to gauge how the market was performing. Auction clearance rates in these areas continue to perform well however Month in Review June 2016 Residential
  • 27.
    27 the limited stockhas played a part in this. We have observed the $2 million plus market performing well with large allotments still a sought after asset. A recent sale at 27 Park Road, Marrickville on 693 square metres achieved $2.3 million with the dwelling appearing to require full renovation. The $1 million to $2 million price bracket appears to have stabilised again following a period of decline at the end of 2015 through to early 2016. This varies in different areas as shown at 108 Warren Road, Marrickville, which sold in May 2016 for $1.247 million after being purchased in October 2015 for $1.185 million and undergoing a bathroom renovation. Little growth has been noted here. A recent sale in May 2016 at 34 Belmore Road, Enmore for $1.9 million showed approximately 7.5% growth over the 14 previous months when it sold for $1.77 million in February 2015. Again it is the unit market which has suffered most in this area. Suburbs with a high supply of average and low quality unit stock such as Ashfield, Dulwich Hill and Marrickville have seen this sector suffer since mid to late 2015. This product in the sub-$1 million price point is yet to show any great recovery with demand here appearing to have suffered the most. Suburbs closer to the city are also showing unit markets performing below average. We note 405/209 Albion Street in Surry Hills which sold in June 2015 for $707,000 has just resold in May 2016 for $715,000 after updating the kitchen appliances. Western Sydney The property market as a whole in Western Sydney has bounced back from the nervous times of late 2015 to early 2016. While no longer surging ahead as it did for the first three quarters of 2015, sales results are still relatively strong and local agents are reporting good levels of interest in appropriately priced property. It is too early to tell what effect the calling of the federal election has had on the market. Given property seems to be a hot topic in this election, we may see another slight easing in the market as policies remain unclear. In saying that, the cost of money remains low and supply is not yet reaching demand, certainly in the outer west of Sydney. Vacant land and house and land packages within planned estates continue to be popular in the market and are seen as being both affordable and providing capital growth into the future. Recent land releases in Jordan Springs on the fringe of Penrith have seen strong sales results with record prices for vacant sites in the estate. A property has recently sold in The Ponds for $2 million, smashing the previous record sale in the suburb. The Ponds is situated in the Blacktown LGA and is a less than 10 year old planned estate. CoreLogic RP Data figures indicate that the median house price has risen there by 57% in the past three years, 18% in the past year alone. Granted the property in question is arguably a one off, architecturally designed and built to a very high standard. It does show however that consumer confidence remains at strong levels. Acreage and rural lifestyle properties in the outer ring of metropolitan Sydney remain popular, with increases in capital values and strong sales results evident throughout the first half of 2016. This is in part driven by buyers re-entering the acreage market after having sold off their previous holdings, located closer to Sydney in the growth centres. Parramatta The Parramatta unit market will be one to watch with caution over the next 12 months, as buyers off the plan in late 2015 and early 2016 paid premiums to secure a unit in a number of new developments. Any further downward shift in the market may see these premiums remain unabsorbed by the market. Month in Review June 2016 Residential
  • 28.
    28 Northern Sydney In themain, the northern suburbs of Sydney have been tracking along in a similar fashion to the majority of Western Sydney. We have noticed that suburbs surrounding planned infrastructure continue to grow. An example is Forestville, located within close proximity to the Northern Beaches Hospital, currently under construction. The median house price for this suburb is currently $1.65 million (according to RPData CoreLogic) and continues to strengthen from January’s $1.56 million after a lull in December. Values in the Ryde area have softened and stabilised after 12 months of rapid growth, particularly for below average stock. Quality well priced properties are still achieving strong results but are taking slightly longer to off-load than the peak of the market, although still within long term averages. A recent sale of a duplex at 68A Champion Road, Tennyson Point for $3.44 million highlights that quality property is still achieving strong results. Prestige Market The prestige residential market in Sydney is generally considered to comprise properties with values in excess of $3 million. These properties tend to be located within the eastern suburbs and eastern beaches, lower and upper north shore or northern beaches, with some waterfront localities in the southern suburbs and the larger rural residential estates to the north-west of Sydney. Initial concern with the Sydney prestige residential market leading into 2016 was whether the upper end would feel the same deterioration in market confidence and demand as the greater residential market. Leading into June 2016, it would seem that this is not the case. Our discussions with leading local agents report limited stock levels across the board. Along with this reduced supply, it appears that buyer demand remains consistent and auction clearance rates remain high. The recent reduction in interest rates by the RBA is not expected to provide any significant enhancement to the prestige market, although the reasonably low Australian dollar makes Sydney prestige residential property attractive to overseas purchasers. The expected slow down in demand from high net wealth overseas purchasers does not seem to have transpired, although we would consider that purchasing decisions by local and overseas high net wealth buyers is now occurring at a more conservative level, with a higher level of due diligence. However, with the Federal Election scheduled for 2 July 2016, the prestige market may show a moderate dip in activity as savvy purchasers and vendors await the outcome and evaluate the overall impact on the local economy. A recent sale of note is a near $80 million purchase in Vaucluse. This property includes four separate properties (13, 13A, 15, and 15A Coolong Road) which have been purchased in one line and once amalgamated, will form a near 4,270 square metre waterfront site with a north-eastern aspect over Vaucluse Bay. This represents the most expensive amalgamation of Australian residential property to date and surpasses the sale of James and Erica Packer's non-waterfront estate which sold in 2015 for $70 million. Canberra Near record low interest rates and low unemployment levels have resulted in continued strength in the ACT economy and property market, particularly the residential housing sector. Despite some market uncertainty in the lead up to the 2016 Federal election and possible restructuring and downsizing of the Australian public service, the ACT property market and broader economy have remained resilient. The impact of the removal of Mr Fluffy asbestos contaminated homes resulting in increased demand and market participants for standard dwellings has had a positive effect on the ACT housing market. Accordingly, demand for residential property remains strong. Month in Review June 2016 Residential
  • 29.
    29 Given current stocklevels for sale and rent, softening dwelling commencement numbers and increased demand levels, we anticipate the residential market in the ACT to tighten over the short term with prices to firm. Small segments of the market including units along the Flemington Road corridor in Gungahlin and properties in less sought after locations or providing inferior accommodation are expected to remain soft. In the 2016 March quarter, Herron Todd White research shows the median prices for standard housing and medium density housing at $575,000 and $410,000 respectively. Illawarra The Illawarra residential property market has continued its reasonably strong growth through 2016 to date. Local real estate agents are advising that they are generally experiencing good activity with many properties selling above reserve or asking price. Continued record low interest rates combined with a limited supply of properties on the market have contributed to this trend. The bottom end of the market is seeing continued capital growth, with some tailing off at the top end with fewer listings coming to the market. Units, houses and rural properties are all selling. Auctions are still the flavour of the day, as it is difficult for agents to price properties in this buoyant market. Prices in new residential unit complexes in Wollongong are steadying as are those in older developments. We are still cautious about unit prices generally in the CBD and North Wollongong as new units are turned off later this year. Although all are reported sold, it is the re-sale market which may suffer some softening. Vacant land in the new southern estates of Shell Cove, Flinders, Calderwood and Horsley are also showing appreciable rises in the past six months with generally good take-up. Many of the new unit complexes are selling off the plan even before any construction has begun. Investors are keen to purchase new units as a result of low interest rates while also benefiting from government incentives. First home buyers are snapping up vacant parcels in these new estates and also benefiting from low interest rates and government incentives. Overall the fierce competition between investors and first home buyers combined with the low interest rates and the limited supply of properties on the market is driving market prices upward. Sydney buyers are entering the market more and more as they are driven out by the hot house prices in Sydney. Although confidence is still as high in the market as it was at the beginning of the year, from our conversations with both vendors and purchasers, the sentiment is that the current level of market activity is bound to slow down soon. Some local agents are predicting the market to ease towards the end of the year, despite interest rates remaining low. Supply in all areas is increasing as tends to occur when confidence is high and this will tend to regulate prices. This will result in more properties on the market, longer selling periods and auction clearance rates declining. The areas which have seen the most growth are generally those where buyers and lenders should be most cautious. Some areas south of Wollongong have experienced a substantial increase in value over the past 18 to 24 months for instance and may be pegged back in any price correction scenario. As always the top end will be the most susceptible to any slowing in the market. Another sector which has suffered in the past when things turn awry is the beach house. Buyers off-loading the beach house to ensure they can keep up the mortgage payments on the principal residence is a situation we have seen before in this coastal region. Month in Review June 2016 Residential
  • 30.
    30 Unemployment is stillhigh in the region with talk that both extractive and manufacturing sectors have some redundancies to go. This will also affect confidence and have an impact on prices. Southern Highlands The Southern Highlands residential property market has seen a marked increase in activity in both volume and prices over the past eighteen months. There has been a noticeable increase in activity by investors with rental levels increasing. The increasing price trend is very strong at the lower to middle price brackets, up to $2 million. Properties over $2 million are steady and also trading more briskly. There has been good land sales activity in the now established residential subdivision precincts such as Renwick Estate (Mittagong), Bingara Gorge (Wilton) and more recently smaller more affordable lots at Darraby Estate (Moss Vale). This uptick in activity has seen the emergence of residential infill developments in the townships of Bowral and Mittagong, with established larger land lots being subdivided into smaller allotments which are keenly sought after. New construction activity has also been evident, most commonly project style homes within these new residential estates. There has also been renovation and extension activity in the well located, older style and character homes within the townships of Bowral and Mittagong. The increase in prices has been at a steady rate and not as a spike in pricing. If interest rates remain at these historically low levels, we consider these market increases to be sustainable and should continue over the next six to twelve months. The Southern Tablelands region is increasing slightly. Goulburn has seen steady to increasing trends over the past five years. There have been good land sales in the new, modern residential estates in Goulburn, including the Belmore Estate, Merino Country Estate and the Mistful Park Estate. There is good construction of new homes activity. Goulburn is rich in heritage architecture and there is also good renovation construction activity in these older character homes. The market in Crookwell is also steady to increasing slightly. The rural residential property market (2 to 100 hectares in land size) is steady to increasing slightly throughout the Southern Tablelands, with good activity from Canberra commuters and rural lifestyle buyers from Sydney. Newcastle The property market in most parts of the region still remains strong and active. The recent RBA interest rate cut to 1.75% will ease pressure on mortgagees, especially for first home buyers, however reports of tighter lending practices which includes lowering EMV thresholds on new loan applications may off set the benefits of this rate cut for some. Many areas of the region have experienced positive growth over the past 12 months. Interestingly the median house price in Newcastle’s LGA remains stable from 12 months ago at around $557,250 (April 2016). While unit median prices have increased to $487,500 (April 2016) as new, high quality unit stock becomes available in Newcastle’s CBD locations. Around Newcastle, local agents are reporting higher volumes of stock entering the market, as owners and investors seek to capitalise on the current market highs. We believe the market is currently at the top of the property cycle and how long it stays there will largely depend on macro economic drivers and Sydney property market influences. While the back half of 2016 will see more high quality units hit the market in and around the CBD, These units are starting around from $300,000 for a 1-bedroom unit and up to $1.2 million for a smart 3-bedroom unit. Agents are reporting good pre-sale transaction rates. Residential properties in popular holiday destinations such as Port Stephens have remained in high demand and it's too early to see trends to show otherwise. Agents in this location are still reporting good buyer interest and low available supplies. While around Lake Macquarie some agents are reporting some softening buyer interest resulting from tighter lending practices, although buyer demand is still strong. Month in Review June 2016 Residential
  • 31.
    31 The mining andresource industry downturn has seen parts of the Hunter Valley property market exposed to job losses and reductions in rental rates, in many cases, houses have been discounted in order to achieve a sale. Sadly, housing market prospects in these towns dependant on the mining industry do not look likely improve in the short to medium term. At the time of writing, Williamtown’s contamination issue again dominates the front page of the Newcastle Herald. Unfortunately for many living within the identified contamination zone the nightmare of this situation continues to roll on – but at what cost to all stakeholders involved? With market commentary surrounding negative gearing, a looming federal election, tighter lending practices, Donald Trump and global economic conditions dominating the headlines it seems the second half of 2016 will be one full of bravado and political rhetoric. How this influences the local property market in the short term remains to be seen, however the fundamentals remain strong in the local market. NSW Central Coast A Changing Region Our region is of one the recipients of the state government's vision of the future. By Proclamation on 12 May 2016, our region's two councils become one. No longer do we have a Gosford City Council and a Wyong Shire Council - we now have a Central Coast Council. We are one. The friendly rivalry, banter, one- upmanship and finger pointing between our former councils is no more. The models tell us to expect strength and huge savings for our region as a single council. We must give thanks to our state's government for saving us. And we didn’t even ask. Property Matters The northern end of our region has seen a rise in the median value of around 4.7% since the year started and around 9% over the past twelve months. Activity in Woongarrah, Hamlyn Terrace and Wadalba typifies the market sentiment and we notice that a majority of sales are occurring in the $500,000 to $600,000 range. Demand for new housing continues from last year with house and land packages being well represented. Prices have been rising with packages (4-bedrooms, 2-bathrooms, 2-car garage on small blocks) regularly being purchased in the early to mid $500,000s. From what we can see, the distribution between owner-occupiers and investors seems to be fairly even. Yields are estimated to be around the 4.5% mark at present. We have been seeing more $700,000 plus sales in Woongarrah and Hamlyn Terrace, which we attribute to demand driven by those exiting the Sydney market. When looking at data provided by CoreLogic RPData though, the median value for Woongarrah at present is $540,000 which is down on the previous two months and indicative of the slight volatility of this specific market. The increase in developer sales indicates there is some jostling between developers in these areas as they secure sites for ongoing development. When we think of barometer suburbs, those which are a good indicator of market sentiment, we often take a look at Budgewoi. It has at times found itself on the top ten default suburbs in New South Wales. A look at CoreLogic RPData statistics shows us that sales in Budgewoi have increased for the past two years, but slowed for the first half of 2016 and this is a telling statistic. Still at the northern end, the beachside suburb of The Entrance is known for its volatile unit market in previous property market cycles. Statistics tell us that sales volumes are up, but interestingly, the median value has been quite steady overall. High end sales at the northern end of the region can be translated to mean those properties sold in excess of $1.3 million and there have been a few. A majority of these sales are beach or lake front properties, but we say the first half of 2016 is yet to see the sale of a trophy property. Over a number of years, the northern end of our region has seen ongoing development. Much of this Month in Review June 2016 Residential
  • 32.
    32 activity has beenthe Warnervale Release Area with timing of development keeping pace with the will of the government, the availability of funds and mood of the people within it. Foreign investment has played a large part in activity in recent times, but this has slowed considerably in response to pressure being applied to lenders. There has been a lot of activity in the property market at the southern end of the region, particularly when looking at approvals for new units. It is estimated that around 245 units have been approved this year in and around the Gosford CBD. Approvals have been granted over the past several years for several thousand units in the Gosford CBD and while highly unlikely that all of these will be constructed, it will only take the simultaneous commencement of several large complexes to put considerable pressure on the local market. Anyone looking at buying a unit in Gosford should be aware of this. Once again though, the slowing of foreign investment is likely to have an effect on the local market and generally speaking, real estate activity has been up and down. In speaking to real estate agents, it is apparent that while their buyer databases are expanding, securing new property listings is their biggest challenge. Some are indicating that the lack of stock coming onto the market may be an early sign of the market slowing and while this could be true, our valuers are still seeing an encouraging number of instructions for sale properties. According to CoreLogic RPData, there has been a rise in the median value of close to 7% over the past six months. Where some parts of the region may have slowed, the same cannot be said for the peninsula areas of Woy Woy, Umina Beach and Ettalong Beach. Sales rates have been reasonably consistent and prices still appear to be on the rise. It is now becoming a regular occurrence for $900,000 plus sales here and we wonder how long this part of the region can continue on this path and what will happen when it does eventually stop. We think those looking to break into the market at the southern end of the region should take a good look around the Wyoming, Lisarow, Kincumber, Bensville and Empire Bay areas. These are still comparatively affordable areas with potential to benefit from the rising market. Most of these areas have older development, but if trends seen in what have elsewhere become popular suburbs, then we consider some of these suburbs could be the ticket. Asking prices in any of these suburbs are generally starting in the low $400,000s for older style dwellings in need of a makeover, with partially renovated or dressed for sale properties in the high $400,000s and mid $500,000s. When we talk about trophy sales at the southern end of the region, we are generally referring to sales above the $4 million mark. There were a few noteworthy sales towards the end of the 2015, but to date in 2016, it has been a bit quiet. A modernist home with great views at Killcare designed by Casltespeake Architects sold in April 2016 for a reported $4.55 million and a renovated lakefront property on a double block at Wamberal recently sold for $4 million. We have also been made aware of a beautiful horse property with a magnificent house being sold for around the $6 million mark. It has been a reasonably quiet first half of the year for high end sales, but a much different story in the $2 million to $4 million range with a number of sales occurring in this space. This includes sales of small rural residential and beachside properties. NSW Mid North Coast This month we are having a mid year review looking at how the Mid North Coast is tracking. The Mid North Coast area is continuing to experience increases in sales activity of residential properties and in turn rising values. This trend has somewhat Month in Review June 2016 Residential
  • 33.
    33 eased for thehigher price bracket properties, however the lower price properties have continued good growth throughout the first half of 2016, often with multiple purchasers competing for the same dwelling or unit. The recent interest rate cut to 1.75% will not only make homes more affordable, it should also enable easier access to housing finance for first home buyers, which will in turn assist the momentum for growth throughout the lower to medium price bracket in 2016. This interest rate cut comes at an opportune time when an impending election often slows down the property market with uncertainty being a key factor. The higher value, prestige and rural property markets in the region remains steady. There have been more sales numbers and values have increased slowly, but the limited demand continues to keep values steadier than the lower end residential properties. Looking at Localities: Port Macquarie has seen good growth with sales often occurring at or close to full list price after minimal time on the market which indicates that the market is still strengthening. Older style dwellings close to town are favoured by purchasers and the outer fringe suburbs are favoured for new dwellings with higher than average construction occurring. The rental market has eased slightly in 2016 with some of the large infrastructure work coming to completion compounded by a large amount of dwellings being sold to investors for rental purposes during late 2015. Fuelled by the recent opening of the Charles Sturt University campus, investors have been trying to get ahead of the game and have their newly constructed villas, duplexes and dwellings with granny flats fully rented prior to construction of a recently proposed onsite student accommodation complex. For Port Macquarie the growth should continue throughout the remainder of 2016 with the continuation of the upgrade to the Pacific highway, commencement of Kmart development and pending further infrastructure development throughout the local area. Surrounding areas Port Macquarie’s close neighbours have also seen benefits with purchasers and tenants looking to these areas to meet their needs and ease financial stress. These areas include Lake Cathie, Bonny Hills and the Camden Haven areas. While capital growth is somewhat variable between areas, good rental returns are being achieved. Larger inland town centres such as Wauchope, Taree and Kempsey have shown signs of price levelling for the first half of 2016. However new subdivisions within these areas are still experiencing good vacant sales and construction activity, indicating that the market in these areas is moving. Further south, Forster and Tuncurry are more closely linked to the Sydney market with a longer lag time due to the large amount of holiday accommodation. These areas remained stable when other Mid North Coast areas took off over the past few years, but they are now making up for lost time with significant increases in demand and sale numbers over the past 12 months. This has, in turn, seen values rise, with this market activity now extending into the prestige and higher value residential and rural residential market which is an indication of a strong rising market and continuing confidence in the area. Bathurst/Orange During the Christmas and New Year period it wasn’t clear how things would pan out in 2016. While the market was rising prior to then it seemed to plateau with no sales standing out to indicate any movement. What has become clear since then is that values in the larger centres of Orange and Bathurst have shown upward movement, particularly for well located central properties, sometimes with an eye for redevelopment. Such sales give valuers an insight into underlying land values in developed areas where often there are no sales of vacant land. In the suburban areas around Bathurst there are land developments occurring in Kelso and Windradyne. House blocks in these areas have typically been Month in Review June 2016 Residential
  • 34.
    34 selling for $180,000.This is an increase from sales one to two years ago which typically saw blocks go for $140,000 to $150,000. Building costs have generally remained steady which is more in line with low inflation and limited growth in labour and material costs. There have also been strong sales for central properties that are either established or for redevelopment. 319 Lords Place, Orange is a circa 1900 renovated federation home with 4-bedroom, 2-bathrooms, detached garage and carport, on a 1,015 square metre block which sold for $825,000. Just as important to note, CoreLogic RPData shows that this was the listed asking price and the property was on the market for only 36 days. 319 Lords Place, Orange In Bathurst, a recent sale of note is 212 Piper Street which sold at auction for $1.05 million. It is a 2,023 square metre site with a renovated compact 2-bedroom circa 1930 brick house. The property was marketed as a development site with potential for eight 2-bedroom dwellings. Such units in Lithgow have been selling for $320,000 which could potentially give a gross realisation of over $2.5 million. I have a feeling that this is a relatively sustainable growth trend which could continue for some time in this region. Clarence Valley The Clarence Valley has several major infrastructure improvements either planned or under construction, including the Pacific Highway upgrade, Grafton Jail and the second Grafton Bridge crossing. The Pacific Highway upgrade is set to bypass Clarence Valley’s major regional hub of Grafton. Grafton is expected to remain the major regional hub as this is where the most housing and work is provided in the region. The passing traffic reductions will have an effect on the town. The towns of Maclean and Yamba have had strong sales activity and have benefited from the Pacific Highway upgrade. Not only will the upgrade provide better access to these towns, the current work undertaken for the upgrades have created plenty of jobs. The first half of 2016 has been positive for the Clarence Valley regardless of the infrastructure upgrades, however, the decline in the major city markets is starting to have a minor flow on effect. The capital city market decrease has reduced the prestige residential sales. With further interest rate cuts, there is potential for an increase in value in the market, especially in Yamba where there is a shortage of residences on the market. Byron Shire 2016 has brought strong buyer activity in the $500,000 to $1.5 million range. There is especially strong demand for vacant land in the urban expansion areas which include Ballina, Lennox Head and Wollongbar in some cases land selling within days of stage releases. The coastal areas are seeing sales steadying to becoming firm and a slight increase in the slower markets of Broadwater, Woodburn and Wardell. With further interest rate cuts, there is potential for increased value in the market and remaining steady to strong for the rest of the year. Lismore/Kyogle/Casino The residential market within Lismore has shown some minor improvement since the start of the year, aided by a low interest rate environment and Month in Review June 2016 Residential
  • 35.
    35 competitive mood betweenthe main lenders. The rural towns of Casino and Kyogle have been relatively subdued in comparison with some brief flurries of activity but nothing overly significant. We have noted a distinct lack of sales activity in the traditional 2-bedroom investment unit, particularly the older style brick and tile units constructed circa 1980s despite the low interest rate environment and relatively low price range i.e. $120,000 to $150,000. The rural/residential market across the board in all three Council areas has remained relatively subdued with no significant increases noted in sale price compared to the beginning of the year, unless responsible renovation has been carried out i.e. not overcapitalised. Possibly the hardest hit has been the remote rural bush block and the improvement 40 hectare rural lifestyle block with travel and maintenance costs becoming important factors to consider. All in all, a relatively quiet six months. Coffs Harbour The market on the Coffs Coast continues to remain strong on the back of record low interest rates and renewed consumer confidence which has seen values rise over 2015 and 2016. The strong local rental market continues to be maintaining demand for lower priced homes and units (sub $500,000) while the mid to upper sections of the market have also increased in activity especially in the more traditional beach side localities. The rural residential market appears to be making a comeback with noticeable increase in sales activity for the well located properties close to Coffs Harbour and typically within the $500,000 to $1 million price ranges. There have been several sales in excess of $1 million which have occurred with the most notable being a property in Boambee (8 kilometres south of Coffs Harbour) which sold for $2.275 million being an executive style residence with second home set amongst botanical style gardens on 1 hectare of land. The upper end sector ($1 million plus) as always is limited in the local market by the amount of purchasers able to secure property of this value with prospective buyers generally coming from ‘out of town’ or interstate and dependent upon greater economic market conditions at that time. Sales activity has shown an increase in the number of sales occurring at or in excess of full asking price which is indicative of a strong market where demand is greater than supply. We caution that these increased levels of demand may not be sustainable over the long term which may make the current market somewhat more volatile. Any increase in interest rates, decline in economic activity or decrease in market sentiment could see a softening in the market in the future. The ‘blueberry’ industry continues to expand which has traditionally been centred on the regional town of Woolgoolga with expansion of this industry into more traditional rural residential localities such as Bucca to the north of Coffs Harbour and Boambee, Bonville to the south. Prices still being achieved for these properties are considered to be above sustainable rural residential values with premiums paid for land which has the characteristics for blueberry/ agricultural production such as permanent water, aspect, slope and cleared land. In short, the market remains strong fuelled by continuing low interest rates, resurgence in development, strong rental returns (lower market sector) and continuing consumer confidence. The commencement of large scale Pacific Highway upgrade north of Corindi Beach to Ballina also serves as positive factor in terms of short term work opportunities; increased rental market and reduction in future travel times coming from Queensland. Month in Review June 2016 Residential
  • 36.
    36 Melbourne The General Election Themajor talking point is negative gearing where the interest being paid on the loan plus the expenses associated with renting the property is greater than the rental income and therefore loss making. In terms of investment, in addition to the expectation of capital appreciation, the tax law allows deduction of this loss against income, allowing the investor to use negative gearing as a tax benefit. The Government has openly said that there will be no change to its policy on negative gearing in the short term. However it does acknowledge that it needs to be addressed in some form in the future. On the other hand, Labor wants to reduce negative gearing to only newly constructed properties, however current investors using negative gearing can continue to have negatively geared investment properties. The party will also cut the Capital Gains Tax to 25% rather than 50%. The purpose of the proposed new policies is to try to combat housing affordability, especially in Melbourne and Sydney, and allow more people to become home owners. However some commentators believe that cutting negative gearing will result in a major rise in rents as current investors look to get a greater return from their investment. The other major concern is speculation that there will be a flurry of investors purchasing properties in the next month in a bid to secure negative gearing benefits before the potential change of government. The property market is one of the biggest markets in Australia and the outcomes of any possible policy changes are hard to gauge at this stage. Interest Rate Reduction The RBA has reduced the cash rate by 25 basis points to 1.75%. This occurred on 4 May 2016 and brings the interest rate down to a historic low, well below the average of 4.92% from 1990 to 2016 (source: RBA, 2016). It is commonly thought that interest rate reductions can stimulate the property market as lower borrowing costs may increase demand for properties. However, so far this has not been the case for Melbourne this time around. The auction clearance rate of 74.3% for Saturday, 14 May was steady but lower than the rate of 76.8% for the same weekend last year (source: Domain, 2016) concluding that the interest rate cut is yet to provide a substantial increase in demand for housing. Furthermore, the RBA does not expect that the decrease in the interest rate will cause a property boom. The Reserve Bank Governor, Glenn Stevens, has stated that in reaching its decision, "the board took careful note of developments in the housing market, where indications are that the effects of supervisory measures are strengthening lending standards and that price pressures have tended to abate" (source: RBA, 2016). National Australia Bank Chief Executive, Andrew Thorburn, stated “I think interest rates are so low anyway, whether it’s 2% cash rate or 1.75%, people aren’t going to go and buy another house based on that” (source: The Sydney Morning Herald, 2016). There is speculation that the interest rate cut may have more of an effect on the lower end of the market, however, this has not been seen as yet (source: Domain, 2016). Over the coming weeks we are likely to see whether or not the interest rate cut has had a notable or a minimal effect on the Melbourne housing market. Overseas Buyers With the Foreign Investment Review Board (FIRB) estimating that up to 20% of real estate transactions in Australia are to overseas buyers (source: RBA, 2016), any lending restrictions to overseas buyers have potential implications for this buyer group. The June 2016 quarter has seen the big four banks tightening lending criteria to overseas buyers to varying degrees. On 18 April, CBA reduced the maximum LVR from 80% to 70% for temporary residents living in Australia and paid in Australian dollars. It also announced that it will no longer lend to temporary residents with overseas income. This follows ANZ’s cessation in April of loan applications Month in Review June 2016 Residential Victoria
  • 37.
    37 based solely onforeign income as well as a limit of 70% on construction. Westpac and its subsidiaries St George, Bank of Melbourne and Bank SA stopped lending to non-resident and temporary resident buyers entirely on 27 April. NAB further tightened its lending criteria from 14 May with a new LVR of 60% (previously 70%) and foreign income can now only account for 60%, down 25% from 80%. Citibank has also placed restrictions. While the Bank of Bendigo and Adelaide saw an increase in loan applications in the immediate aftermath of the restrictions placed by the big four, it has also since stopped processing overseas loan applications (source: Australian Financial Review, 2016). These tougher lending criteria are prompting some commentators to issue warnings about settlement risk where overseas buyers who have already paid a deposit to purchase a property may find themselves unable to secure finance to settle the purchase. This risk pertains in particular to off the plan unit sales as this is the type of property most frequently purchased by overseas property buyers (source: CoreLogic RP Data, 2016; RBA, 2016). This risk sits alongside further factors - the number of overseas property buyers is declining due to a weakening Chinese economy, tighter lending rules from APRA (the Australian Prudential Regulation Authority) and surcharges and higher stamp duties introduced by the Victorian State government in 2015 and 2016. In addition, the Australian Securities and Investment Commission (ASIC) is investigating fraudulent mortgage application documentation used by Chinese buyers to purchase an estimated $1 billion of property in Australia amid reports that forged employment and income statements can be purchased for as little as $200 (source: AFR, 2016). Melbourne Apartment Market The apartment market for central Melbourne has started to soften for the first part of 2016. According to CoreLogic RP Data, there was a 0.5% drop in unit prices for the first quarter of 2016, including a fall of 0.9% in March. Based on figures provided by the REIV, Melbourne CBD had a 17.2% drop in the median unit price while Docklands had a 6.7% increase in the median price and Southbank had a 6.3% median price rise. Melbourne v Other Capital Cities Victoria is Australia’s fastest growing state, with a net growth rate of 1.7% in the year leading up to March 2016. This has seen the state overtake New South Wales which had a growth rate of 1.4%. With the steep price of housing in Sydney, home buyers are finding it unaffordable and are looking to other capital cities such as Melbourne. Melbourne is expected to overtake Sydney as Australia’s largest city by 2056. The driving factor behind this is Victoria’s strong economy. Migration to Victoria is currently greater than that to any other state in Australia. In the year to September 2015, Sydney gained the most migrants of any state with 87,800, but lost 95,300 residents, whereas Melbourne is reported to have gained the second largest amount of migrants at 73,500, but only lost 62,400 residents. Population Growth by State (Source: ABS, 2016) Melbourne is expected to overtake Sydney in 2016 as the best performing capital city in terms of market growth in house values with property price growth expected to hover around 8% in Melbourne while Sydney is expected to see growth of about 4%. Comparing Sydney’s median house price of Month in Review June 2016 Residential
  • 38.
    38 $995,804 at theend of the March 2016 quarter with Melbourne’s median house price of $713,000, housing is evidently more affordable in Melbourne. The decline in the resources sector has also seen the recent deflation of Western Australia’s property prices with the median house price falling 4.7% over the year leading up to March 2016, whereas Melbourne’s median house price has had a steady growth over the past few years since the GFC demonstrating the strength of Melbourne’s economy and overall property market. Median House and Unit Prices (Source: Domain, 2016) Market Surprises 4 Robertson Street, Toorak Recently listed on the Melbourne property market is this Toorak mansion, comprising 18 rooms, 7- bedrooms, 7-bathrooms, 3-kitchens, a dining room that seats 18 people, a den for business meetings, a separate office, formal sitting rooms, landscaped gardens, a 25 metre outdoor pool and spa. The Toorak mansion, which was formerly owned by the Smorgon Family, is predicted to become Victoria’s most expensive home. The record is currently held by a Portsea cliff top home that sold for $26 million in 2010. According to agent Marcus Chiminello, Robertson Street is expected to reach between $26 and $30 million. 4 Robertson Street, Toorak (Source: RealEstate.com.au, 2016) Mansion in Tarneit Wealthy businessman and local Wyndham City councillor Intaj Khan plans to build a $9.5 million mansion on ten acres in Tarneit. The home will boast 16 bedrooms, a 30-seat home cinema, two swimming pools, a 7-car garage, tennis court and helipad (source: Domain, 2016). Tarneit, 27 kilometres west of Melbourne’s CBD, is a modern suburb dominated by relatively new housing estates. The majority of homes have been built in the past six years in a high density pattern with block sizes in some estates below 400 square metres. There is strong competition among developers in Tarneit and a large amount of englobo land available for further housing in this precinct. The average price for a family home in Tarneit is roughly $415,000. Due to these factors, Khan’s plans may seem bizarre and may come as a surprise to many, and getting his money back in the future could prove difficult. Month in Review June 2016 Residential Tarneit Mansion (Source: Domain, 2016)
  • 39.
    39 Ballarat The Ballarat residentialmarket has had a strong start to the year with steady volumes of sales. The higher price bracket of $700,000 and over has performed well with strong demand. Lake Wendouree has performed well with high demand and high prices achieved. Period style housing and large allotments are proving to be highly sought after and are achieving premium prices. This market has shown some success with auctions and short periods on the market. A notable auction result was 6 Service Street, Lake Wendouree, a deceased estate, which achieved $1.215 million. The lower end of the market, sub $300,000, continues to perform well, providing opportunities for investors and first home buyers. Suburbs in this market that have been performing well are Ballarat East and the southern areas of Wendouree, close to the schools and shopping facilities. Demand and availability within this bracket remains constant with good rental returns. The unit market in Ballarat is beginning to slow with an increased supply of unit developments. The unit developments are strongly driven by investors where rental returns are strong. The low interest rates continue to fuel investment interest, however possible changes to negative gearing following the forthcoming election have the potential to affect the investment market such as unit developments which provide minimal capital growth. The mid bracket of $300,000 to $600,000 has been slower to date with continual supply of new land estates and the option of building new houses. Within this bracket the stronger performing suburbs are Brown Hill and Lucas. Delacombe has remained fairly static with the oversupply of new housing estates coming to the market. Overall, the Ballarat region has had a strong and reliable start to the year and is expected to continue in this manner for the rest of the year. The election may slow real estate transactions for a short period but it is unlikely to create any dramatic changes to the sector. Echuca The local residential markets have continued to bubble along relatively strongly mostly on account of a lack of supply. Sales in the standard mortgage belt of $350,000 to $450,000 and new homes are ticking along at average rates. There have been several strong sales in Moama including a record sale in Perricoota Run (under contract) significantly in excess of $800,000 after the previous record of $745,000 which was relatively short lived. The strong performer has been rural residential holdings with what seems to have been a run of relatively strong sales in and around Echuca after a relatively strong period of demand. Gippsland Five to six months into 2016 and the property market is considered stable with minimal movement in prices. An impending election can cause trends and actions to be conservative, however discussions with local real estate agents reveal optimism heading into the next six months, with evidence of long listings starting to sell. Below is a summary of the cities and towns throughout Gippsland. Sale This niche market with the strength of the RAAF Base maintains positive results. Sale has limited areas to build, which therefore strengthens established markets throughout central and east Sale. Rentals are as high as they have ever been. It's currently a buyer's market and is a good time to invest in a strong stable market. Traralgon Land prices are very affordable with a high supply of land. The construction industry is strengthening, with high opportunities to build quality homes at affordable prices. We have also seen three sales between $700,000 and $800,000 in the past 12 months. Month in Review June 2016 Residential
  • 40.
    40 Morwell The market hasrecovered in recent times after a slow 2015. The new Heritage Estate is popular with high quality homes and new houses selling quickly when on the market. At the lower $100,000 to $150,000 end, investors can achieve 8% plus returns, however the low quality of homes and the demographic profile are considered a risk. Trafalgar Surprise packet number one - Trafalgar is bucking the trend, with land prices increasing with demand for new estates and high quality builds. Sales of $500,000 plus are occurring more often in 2016. Warragul/Drouin This is a stable market with increasing demand for new construction. Land estates are developing quickly with increased demand. Just over an hour from the city, the Warragul and Drouin markets are definitely ones to watch. We also note two new real estate agencies have opened in Drouin in the past six to 12 months. Koo Wee Rup Surprise packet number two – approximately 45 minutes from the city, Koo Wee Rup is seeing Increasing demand for new residential estates. Within 12 months, land values have jumped from $190,000 to $220,000. Phillip Island and the Bass Coast have seen steady numbers of listings and properties are selling within a reasonable period, however, there has been no noticeable increase in market values. Phillip Island and Bass Coast have seen stable growth in the construction of new dwellings and vacant land. Rural localities consisting of small holdings have seen limited sales with stable market values throughout the district. Venus Bay has a higher than average number of properties, both dwellings and vacant land, listed for sale. After some fluctuation in values over the previous few years, the market appears to have stabilised and no noticeable change in value has been noted in the past six to 12 months. In summary we are in a buyer's market, with many options for the investor and plenty of opportunities to build the dream home at a reasonable price. Mildura The residential market in Mildura has maintained a steady pace so far this year, with most listings in the $250,000 to $450,000 price bracket selling within three to six weeks. However despite the steady activity, values have stayed about the same, suggesting that we have a reasonable balance of buyers and sellers at this main local price point. Demand appears strongest for modern homes, with older, dated homes receiving less interest. Homes up to $500,000 are meeting the strongest demand, and it is clear that there are fewer buyers currently competing for homes above say $600,000. This might suggest fewer professional people have moved to Mildura in the past six months. It is hard to say whether this is a definite trend or just a blip in activity. Most local builders are busy, with a number of recently released residential subdivisions providing an adequate supply of serviced sites for local buyers. Most of the building is currently for owner-occupiers and low interest rates are likely to be assisting this activity. Land values have held up well, with some increases evident in preferred subdivisions. Prices of over $100,000 for a serviced lot are becoming more normal, with developers forced to pass on higher headworks charges. Month in Review June 2016 Residential
  • 41.
    41 Brisbane We Queenslanders lovehalf time – it’s good for one of two things: 1. A chance to take a breather from running so many tries over in the first half. 2. An opportunity to collectively agree we’ll take our foot off the brake and romp home in a come-from- behind win. We maroons thrive of being underrated and then over preforming, and it’s hoped this will translate into our property market as 2016 progresses. Now is the opportunity to take stock and see how we’re tracking. Certainly near city property is doing well. The solid foundation of owner-occupier real estate continues to see good performance in suburbs sitting within 5 kilometres of the CBD. It’s our market’s best performer – particularly detached housing – with most of the past 18 months demonstrating terrific gains. That said, consolidation began in early 2016 and prices seem to have stabilised. We can probably expect more of the same as we travel beyond June with performance being flat to slightly rising. Step a touch further out and property in the 5 to 10 kilometre band has experienced uplift in value. It’s probably evident of the capital growth 'wave effect' which we experience with almost monotonous consistency in Brisbane. As those suburbs closer in become relatively expensive, buyers begin pushing further out and bolstering values in these next-wave areas. This market has also been flattening in 2016, although areas close to infrastructure and facilities continue to perform best. If you’re flirting with real estate at the urban fringe, there’s been little love in return. Supply is strong and demand is steady… and this is set to continue for some time yet. Don’t expect unbridled capital gains in these areas in the foreseeable future. There has been a lot of talk about our inner city unit market with an oversupply situation that’s graduated from 'looming' to 'inevitable'. This sector is a huge concern. There are still heaps of projects that are yet to come online or are in the planning phase. They are also predominantly investor driven and this could be a recipe for a lot of heartache – particularly as a large percentage of buyers are interstate and international investors. Add to this the tighter restrictions on lending to foreign investors and you can see where it might all be heading. As we’ve been saying for some time – in terms of inner city units, the best per formers are, and will continue to be, those projects designed with owner-occupiers in mind. If you’re wondering how tenant demand is tracking, we can confirm current data shows vacancy rates for houses at 2.5% and units at 3.2% (unit vacancy increased by 0.3% year-on-year). The combined vacancy rate for all property types is 2.7%. The general rule is any result below 2% demonstrates an under supply of rentals, 2% to 3% seems balance, and over 3% represents oversupply. From the numbers above, it’s easy to recognise where the weak sector is in the market. Rental yields are also tracking fairly steadily with most housing achieving 4.5% to 5% gross, while units sit around five to 5.5%. Steady but not stunning. While there’s still reasonable sales activity within the big, well-serviced residential estates (e.g. Springfield Lakes), most smaller land subdivisions are seeing a rise in sales to investors. This usually indicates developers are beginning to slow down production, particularly in areas such as Redbank Plains. In case you’re wondering, we have also observed (qualitatively) an increase in mortgagee-in- possession work, although it’s not at concerning level. So overall, the Brisbane property market is fairly stable and with the election now looming, we’ll be in a holding pattern until after the July poll. Typically, the market in Brisbane is strongest when Sydney Month in Review June 2016 Residential Queensland
  • 42.
    42 and Melbourne pricesincrease to a point where owners offload their holdings down south and head to the Sunshine State where they can buy a bigger home and still have plenty of cash left over. We’ve yet to see that occur because our State’s job market is performing below expectation. A recent report put our unemployment rate behind all other state’s except South Australia. Confidence is the major issue and until there are signs of an improving economy and jobs growth, our market will remain pretty static. Toowoomba In Toowoomba, the residential market has shifted from stable to showing the early signs of regressing. For the first time since 2011, the median house price has decreased from $378,000 in the last quarter of 2015 to $359,000 in the first quarter of 2016. In line with this, the volume of sales has also declined. However, while investor interest appears to be easing parallel to the slowing market indicators, the capacity for long term capital gain remains attractive to first home buyers, upgraders and renovators due to Toowoomba’s relatively affordable price points. Across Toowoomba, following the declining mining and coal seam gas industries and associated job losses, the property market has passed its peak with agents reporting reduced buyer enquiry and extended selling periods. However, while some sectors are performing better than others, there is no specific property type outperforming the broader market. Price segmentation over the 2016 financial year shows the majority of sales recorded – that is 41% of all house sales – to be between $300,000 and $400,000, the price point which encompasses the median house price and consistently proves most active, while sales less than $300,000 and sales between $400,000 and $500,000 constitute approximately 20% of all house sales. Overall, the relatively strong sales and price growth demonstrated in 2015 have not been met with equal enthusiasm in the first half of 2016. A cooling of the market may stabilise before a significant decrease in value occurs with the construction of the second range crossing and the QIC shopping centre development acting as catalysts for future economic growth across the region. Gold Coast Activity across the Gold Coast is erratic depending on the property type, buyer profile and vendor circumstances. Houses within the central and coastal suburbs (Paradise Point to Palm Beach and east of the M1) are still attracting strong buyer demand. The wheels are still turning also for house and land packages sold via the investment market. However, the volume of valuations for both refinance and purchas has definitely dipped over the past two months. Whether this is a result of concerns about the capital city markets, opinion that some price brackets are over heated, a looming Federal Election or a combination of all, it is the topic of many conversations. "Will the Commonwealth Games create a boom on the Gold Coast?" and "Will there be a Games hangover?" are questions that are being asked regularly. Our view is that a boom is unlikely given the current state of play, and bust is not expected provided prices do not continue to grow through to 2018. One thing that has become apparent is that some sectors are slowing more than others. During a boom market the last sector to see gains has historically been acreage housing and old highrise units. It is also not unusual for these two sectors to be the first to stall as the market slows, which is the case according to our current experience. The central Gold Coast housing market up to $1.35 million appears to be the strongest in terms of price growth and volume of sales. The market, however, over $3 million is very slow apart from four recent sales over $10 million of which three have been to international buyers. Northern Suburbs While the levels of market activity in the central north zone of the Gold Coast are generally stable, it does appear quieter than this time last year. Month in Review June 2016 Residential
  • 43.
    43 In saying that,there is a hive of activity around Southport in the Priority Development Area with a number of new mediumrise residential buildings either recently completed or under construction. These buildings are offering compact style units which have mainly appealed to investors at attractive price points around $400,000. These units are renting out between $420 and $470 per week and have quite manageable Body Corporate fees of around $50 per week. Agents have been reporting that older established units (duplex and townhouses) are spending more time on the market than six months ago and this could be attributed to the new affordable stock available in Southport and Biggera Waters. The housing market is robust up to $700,000 in most areas. We are finding renovated dwellings through Ashmore, Southport, Biggera Waters and up around Paradise Point are achieving premium prices if the quality is there. Local selling agents are reporting that a lack of quality stock is keeping competition healthy. In terms of affordability, around Coombabah for example, there are opportunities for first home buyers. A notable sale on Allinga Street, which is a quiet street near the river. It comprises a single level, circa 1960, older style, fibrous cement sheeting with 2-bedroom and 1-bathroom and has fibrous cement roof and a 2-car detached carport. The living area sizes is 99 square metres with an outdoor area of 60 square metres. The dwelling is located on a near level, regular shaped, inside lot situated at road level with a land area of 506 square metres. The property sold for $400,000. Most properties will need work around this price range however they have good opportunity for capital growth. There have not been any surprises as such in the central north area of the Gold Coast, the interest rate drops have supplemented what seems to be a rare period of stability. M1 Corridor With new estates continuing to spring up throughout Coomera and Pimpama the majority of transactions within these suburbs are to the investor market. Interstate investors account for the bulk of sales, however investors with a Chinese origin are starting to increase in frequency. House and land packages still continue to be the most popular product with prices for both the vacant land component, and building contract varying wildly. It is not uncommon for build costs to range between $1,150 to $1,500 gross per square metre for a similar product. Likewise, there is also a wide range in purchase prices for vacant allotments with your typical 400 to 450 square metre allotments selling for between $230,000 to $260,000. In some of the smaller estates we have seen a single builder exercising 'put and hold' options on the entire estate which excludes the owner-occupier market. Eagleby, an established southern Logan suburb, still continues to be popular with southern investors with investor demand outstripping that of the owner- occupier. Prices in this suburb have accordingly seen an upward momentum over the past 18 months. Despite the domination of investors in the suburbs of Coomera and Pimpama owner-occupier demand has remained strong, albeit confined to estates such as Gainsborough Greens and Parkside for new product. An example of a house and land package that recently sold in Gainsborough Greens is 14 Girraween Street which was priced at $492,504 and comprised a 4-bedroom, 2-bathroom onground dwelling with a good quality fitout, 185 square metres of living situated on a 420 square metre regular shaped allotment. Established estates such as Coomera Waters and Genesis have also continued to be favourites with owner-occupiers due to the higher quality dwellings located within, and the higher ratio of owner-occupiers to investors. Month in Review June 2016 Residential
  • 44.
    44 Eagleby has seena recent increase in owner-occupier activity as buyers are being priced out of suburbs closer to Brisbane, however, investor transactions still dominate this particular suburb. Southern Gold Coast/Northern NSW The market for the majority of residential property types continues to strengthen on the southern Gold Coast and northern New South Wales with reduced selling periods, stronger market demand and less stock available. This is also evident in the rental market with property manager's reporting strong levels of enquiry by prospective tenants within the first few days of a property being offered for lease. As a result, the rental prices being achieved have improved considerably over the past 12 months, as have the returns/yields to investors. While there are a small number of investors buying units in the southern area, the market seems to be dominated by owner-occupiers looking to move to the beach side suburbs. A number of the properties are being sold to local buyers rather than interstate investors. Scenic Rim The north-west and western portion of the Gold Coast offer both good value for money and return on investment, especially with the current low interest rate environment. Investors and owner-occupiers alike are still active within all the new growth areas of Yarrabilba, Jimboomba Woods and Flagstone. Land values are still rising steadily with the majority of estates reporting good enquiry with limited new stock available. Developers appear to be focused on both sectors of the market, with Lend Lease recently offering 'completed' land to target to the owner- occupied market. This eliminated the construction lead in time and waiting for the issue of titles before being able to settle and start building. Sales within the estate are now predominantly to the owner- occupier market with the average 450 square metre allotment selling for around $190,000 to $200,000. Moving a bit further west, Flagstone has recently released their land to the west of the Brisbane- Sydney Railway and are reporting good interest. This precinct will appeal to the lower end of the market, sub $400,000 and, in time, will include shopping and medical precincts as well as passenger rail to the Brisbane CBD. There is a release of land located directly opposite the Flagstone Primary and Secondary Schools which sold for around $145,000 for a 375 square metre lot. Heading South, established housing in Beaudesert remains an owner-occupier market with the majority of sales occurring from $280,000 to $360,000. There are a number of estates being released within the area over the next six months or recently released including Oakland Estate, balance of Scenic Rise and Banksia Greens, and these will target both the owner-occupier and investor. The Bromelton State Development Area is due to start construction by the end of the financial year and this is expected to have a positive effect on demand within the immediate area. Sunshine Coast In the first half of 2016 the Sunshine Coast market has tracked along reasonably well after a pretty slow start in January. We have had a reasonable start to the year with good activity in most sectors. Some grey clouds have however started to appear on the horizon which is not a major cause for concern as yet, but is something to be aware of. The upcoming federal election has the potential to be a bit of a game changer. The various policies being proposed, including the reduction in negative gearing, have the potential to significantly impact the property market. Combined with the general uncertainty of an election period, the decline in confidence could have a significant impact. Entry level properties in most sectors continue to perform well, typically those along the coastal stretches and areas close to amenities. This is the case for housing and units as well as entry level prestige dwellings. Time on the market Month in Review June 2016 Residential
  • 45.
    45 has decreased andimprovements in values have occurred. We do not believe there have been any major problems with this market other than limited stock levels that has effectively curbed sale volumes with some resistance to new pricing. The unit market has the additional facet of body corporate fees. Complexes that have fairly low body corporate fees have done pretty well however if body corporate fees are high, the market drops away. Larger permanent style units and also larger townhouses and small lot housing have improved on the back of empty nesters wanting to downsize. We have seen an improvement in the rural residential market however it has certainly been at a slower pace than that of the housing and unit markets. Some reasonable buys remain given the discretionary nature of these properties with the ability to purchase at below replacement. When looking at the prestige market, entry level has performed fairly well but above say $1.5 million the market tends to thin out quickly. As with all the markets but more so in the prestige market, it is very much reliant on the specifics and circumstances of the property, the purchaser and the vendor. Any properties that have issues or are overpriced will tend to sit. The Sunshine Coast University Hospital continues to be a massive driver. It was due for completion in late 2016 but has been delayed to 2017. There are other projects on the agenda such as the new Maroochy Town Centre and Aura from Stockland (formerly Caloundra South) but these projects are market led. Jobs and more importantly, creation of jobs, will be critical for the coast going forward. Hervey Bay Based on our market research from 1 October 2015 to 31 March 2016, the median price for property in Hervey Bay on an allotment size not greater than 1,500 square metres is $320,000. This is an increase of $10,000 for the same period 12 months ago. The average price for the period is $329,199 compared to $316,697 for the same period last year. The volume of sales is lower by approximately 83 sales which could be a result of not all 2016 sales being recorded. Entry level property is continuing to be affected by house and land package deals creating a price ceiling for existing, established stock. Developers continue to supply product with approximately eight estates releasing further stages. Until stock levels decline, there is likely to be limited growth in this market. The end of the $12,000 grant for new land or new house and land packages under the Building Better Regional Cities Program grant on 30 June 2016 may see some slow down in sales rates for the eligible estates. Rental demand appears to have stabilised after a period of growth, however supply remains tight. Generally a new 4-bedroom, 2-bathroom home can achieve in the range of $350 to $370 per week rent. There appears to be increasing confidence in the higher priced market with approximately 25 settled sales over $600,000 since 1 October 2015. We are also aware of a recent contract at $1 million for a Dundowran Beach property and another at $940,000 for an Esplanade property in Urangan. Emerald In the first quarter of 2016 we saw another softening in the market across the Central Highlands which includes the towns of Blackwater, Emerald, Capella, Clermont, Moranbah, Dysart and Middlemount. The first half of 2016 was predicted to show us exactly where we are at after a massive scaling back in the resource sector. Things now appear to be near the bottom for the time being if not already there. The local resource sector has been relatively stable with no drastic employment or wage cuts recently. There has actually been some slightly positive news on the horizon but this has only been talk so far. The Adani project continues to linger in the background Month in Review June 2016 Residential
  • 46.
    46 and if itwas to go ahead it should definitely stabilize our markets and put a definite halt on the slide and possibly a line in the sand where we can say it has bottomed. Strata units and multi-unit properties across the region have been the hardest hit. We are seeing some vacant land sales in the fully mining dominated towns at $15,000 to $20,000. These are mostly being purchased by speculators. We are seeing values back near 2004 and 2005 levels just after the boom began. There does not appear to be any possible capital growth in our markets for the foreseeable future but some purchasers are starting to speculate and prepared to buy and sit. Even a small boom in the resource sector down the track could see some handy capital growth returns for those purchasing in the current market. Some say it will definitely happen, it's just a matter of when. Bundaberg The residential market for houses and units has remained steady and consistent over the past six months with overall confidence being subdued. The rate of mortgagee in possession valuations has remained steady and is tracking to current market expectations. There are a few major upcoming developments in the pipeline including commercial and residential developments along with the waste water treatment plant and plasterboard manufacturing plant at The Port. As these developments move forward confidence in the market should lift throughout 2016. In the outer rural residential sector, sales have been occurring on a slow to static basis over the past six months. Affordability is considered to be a major factor. Buyers are mostly owner-occupiers with the majority of sales under $250,000. Residential housing predominantly consists of older dwellings of various styles and standards, as well as larger rural residential home sites on the outskirts. Overall, properties in rural locations appeal to a smaller market sector and typically take a longer time to sell. Gladstone The Gladstone property market and local economy have continued on a downward trend for the first half of 2016. Major employers in the region have cut hundreds of jobs in the past six months. Rio Tinto Yarwun has just completed the latest round of redundancies and NRG (power station) and QAL (refinery) completed their cost cutting measures earlier in the year. In addition, there are still several thousand local employees working for Bechtel on Curtis Island, most of whom will be without work within 12 months. New job opportunities in Gladstone are very weak and without a major project on the horizon, the Gladstone economy is likely to remain subdued. These job losses have had and will continue to have a direct effect on the already over-supplied property market in the Gladstone region. Despite early signs of stabilisation at the end of 2015, the market for established housing appears to be continuing to fall in 2016. Sales of units and townhouses have picked up marginally over the past several months however value levels are showing very significant declines in value. A few examples include: • A part renovated high set home in the established suburb of Kin Kora sold in July 2015 for $410,000. It sold again in March 2016 for $363,000 representing a $47,000 loss (11%) in just under nine months. • A penthouse unit in a marina front medium rise complex previously sold for $1.525 million in 2011 and sold for $810,000 in 2016 reflecting a 47% discount. • An older, central suburban townhouse which previously sold for $295,000 in 2011 is now under contract for $75,000, reflecting a 75% discount. Month in Review June 2016 Residential
  • 47.
    47 Vacancy rates inthe Gladstone region have continued on their upward trend. The most recent data indicates a vacancy rate of approximately 11%. With the number of recent job losses, it is expected that this rate will continue to climb. This rate has also had a flow on effect to rental levels which continue to decline. Current market conditions feature a significantly large number of properties for sale and for rent, significantly declining rental levels and high vacancy rates. The market remains liquid albeit there has been a relatively low number of sales over the past six months. Mortgagee in possession sales activity is also increasing. These factors are adversely impacting the marketability and value of all property in Gladstone. Rockhampton As predicted in January, to date 2016 has proven to be a difficult year for the Rockhampton and surrounding residential markets. We have continued to experience a slow down in almost all sectors of the market with the overall number of sales reducing and values softening. A genuine lack of investors has seen the market relying on local first home owners and young couples upgrading from their first or second home. Selling agents have reported extended marketing periods with a notable lack of interest whether it be at open homes, internet or phone enquiry. The key message out there is that if you want to sell your home it has to be priced accordingly and the first two to four weeks is the key. Anything after that and you risk sitting on the market indefinitely and having to lower your list price significantly. As predicted it is the lower end of the market (sub $250,000) which seems to be at risk with a massive oversupply of listings and limited buyers. Again recent investor suburbs such as Gracemere and Zilze are still very slow. Unfortunately the number of mortgagee sales has continued with sale prices often resulting in significant decreases. Once again better quality properties which have been well maintained and are located in sought after locations (parts of Norman Gardens, Frenchville and The Range) seem to be more saleable although they also need to be priced accordingly. Looking forward, the Federal electron will present an opportunity for local stakeholders to raise concerns and call for solutions to the resource and local industries but the time for these promises to come to fruition is often longer than expected. 2016 will likely remain slow however there is some thought amongst the punters that we are now at the bottom of the market and from here there can only be one way up. Mackay In January this year we wrote “There is still a relatively negative outlook among buyers and sellers in the Mackay region and market evidence suggests that property values are still declining in the short term. It is difficult to see any growth in values in 2016 without some big momentum shift in the Mackay economy. However it is hoped that some levelling will occur towards the mid to latter half of 2016.” The first half of 2016 has been pretty tough for the Mackay property market on the back of a difficult 2015. The negativity seen in the market place is still evident, with property values still declining in the first six months, albeit at a much slower rate of decline than seen in the past two years. On the positive side, we have seen increased sales volumes (although at lower value levels) and the REIQ March Quarter Vacancy Report states that rental vacancies have dropped from 9.3% to 8.1%. This is a significant improvement and the lowest vacancy rates seen since 2014. The downturn in the market has provided opportunities not seen in Mackay in over ten years. Previously, Mackay had one of the highest median house prices in regional Queensland, with housing affordability a major challenge. With the large fall in values and historic low interest rates, we have seen among others, first home buyers re-enter the Month in Review June 2016 Residential
  • 48.
    48 market, able tobuy average style highset homes in established suburbs for low $200,000s. The main issue for the Mackay market is the negative sentiment. As stated in January, without some major momentum shift in the Mackay economy, it is difficult to see any growth in the market in the short term. Whitsundays The first half of 2016 has seen residential entry level units weaken with limited activity. There still however appears to be steady sales in the family entry market, with some out of town property investors creeping into the market. The residential lifestyle properties appear to be holding steady. We have seen some beach front land sell in excess of $1 million however the upper level unit market appears to be slow with very limited market activity. There are new land developments just coming onto the market with beach fronts and good views, so make sure you tune in to future editions of the Month in Review to see how these go. All in all the Whitsundays appears to be holding steady. Townsville At the halfway mark for 2016, Townsville’s residential property market remains at the bottom of the market cycle and continues to languish with low buyer and business confidence and job security concerns all impacting property market sentiment. Talk and concern around the job losses of 800 people from QNI and the flow on effect to other local businesses has somewhat dominated the market during the first half of 2016 as it seeks some form of traction. With payments reportedly starting to trickle through to some of these workers, let’s hope it can provide some financial relief to these families and ease some of the anxiety within the property sector. Demand within the new home and new unit markets remains low, compounded by ongoing affordability concerns with buyers only purchasing property they consider affordable based on their current economic circumstances and the ongoing cost differential between established versus new housing. The rental vacancy rate remains elevated above balanced market conditions with our latest rent roll survey for April showing a trending overall vacancy rate of over 6%. Anecdotal evidence suggests that people who have lost jobs and have been unable to find employment again in the region have left Townsville and have left the rental market or placed their homes into an already saturated rental market. Furthermore the current high unemployment rate is not attracting new people to the area to absorb this oversupply of rental stock. It is likely that the remainder of 2016 will be subdued in the residential property sector as the low levels of sentiment filter through. There are definitely positives in the market if you are looking to enter the owner-occupier market for the first time with soft median houses prices and anxious vendors making it very much a buyer's market. Month in Review June 2016 Residential
  • 49.
    49 Adelaide The outer northernsuburbs (Playford council area) comprising areas close to Elizabeth and the Holden manufacturing plant continue to experience negative sentiment with the effects of the imminent closure of the plaint in 2017 yet to transpire. Chicken producer Ingham has recently announced it will spend $275 million doubling the size of its South Australian operations. This will create an additional 850 jobs with the company looking to target workers set to lose their jobs in car manufacturing. The expansion will hopefully create new direct and indirect jobs for South Australians with Ingham focusing on two key areas – northern Adelaide and the Murraylands. We will monitor the market in coming months to track the impact this has on the northern property market. Detached housing under $450,000 within 15 to 20 kilometres of the CBD is experiencing reasonably good demand. This is likely to be attributed to this price point being an affordable option for investors and first-home buyers. The unit and apartment market remains relatively flat. In the CBD, two large apartment developments (Vue and Vision on Morphett) have been recently completed with pending settlements. We will be monitoring the effect this increase in supply has on this market segment particularly regarding rental property supply. Popular beachside suburbs such as Henley Beach and Grange are also experiencing good demand. The sale of a renovated bungalow in Grange attracted a high level of interest when sold at auction in March. The property which sold for $1.51 million offered good quality accommodation on a substantial allotment along with a swimming pool and entertaining area. Source: realestate.com.au Quality housing in suburbs within ten kilometres of the CBD continues to experience good demand. A renovated symmetrical cottage in Evandale (some four kilometres from the CBD) sold at auction in April. The auction was attended by over 80 people with 20 registered bidders. With an initial price guide of $715,000, the property eventually sold for $898,000. Source: realestate.com.au There are a number of new infrastructure projects currently underway in Adelaide including the Torrens to Torrens project, O-Bahn busway extension and Darlington road upgrades. All of these projects have recently commenced. Month in Review June 2016 Residential South Australia
  • 50.
    50 There is ongoinginvestment to improve South Road. The Torrens Road to River Torrens Project (Torrens to Torrens) will deliver a four kilometre non-stop roadway (incorporating three kilometres of lowered motorway), between Ashwin Parade, Torrensville and Pym Street, Croydon Park, providing significant travel time saving to commuters and freight. The total project cost is in the vicinity of $896 million. The Department of Planning, Transport and Infrastructure website states that the concept design includes: • A four kilometre non-stop section of roadway (incorporating the lowered road section) between Pym Street, Croydon Park, and Ashwin Parade, Torrensville • A three kilometre section of lowered non-stop motorway from Pym Street, Croydon Park to Gawler Avenue, West Hindmarsh • Parallel surface (at-grade) roads along the length of the lowered motorway to connect most local roads and arterial roads to South Road • An overpass of the Outer Harbor railway line • Intersection upgrades at Pym Street, Torrens Road, Hawker Street, Port Road and Grange Road • Improved cycling and pedestrian facilities • Landscaping and noise barriers (where required) Source: www.infrastructure.sa.gov.au/nsc/torrens_road_ to_river_torrens_project and t2talliance.com.au This improvement is unlikely to benefit any specific suburb with the greatest benefit likely to be for industry with improved travelling times and ease of movement. The DPTI website states that: "The O-Bahn City Access Project builds on the State Government’s significant investment in a stronger public transport network. The primary objective of the O-Bahn City Access Project is to improve travel times and reliability for users of the O-Bahn service between the end of the busway at Gilberton and Grenfell Street and to reduce traffic congestion and delays, particularly on the Inner Ring Route. The project will extend the O-Bahn system from the end of the busway at Gilberton into the cross-city priority (bus) lanes on Grenfell Street. The project will include the creation of centrally aligned priority bus lanes along Hackney Road and a dedicated bus tunnel from adjacent the National Wine Centre to near Grenfell Street, providing quicker, more reliable access for O-Bahn buses into the city." Month in Review June 2016 Residential Source: http://www.infrastructure.sa.gov.au/public_ transport_projects/o-bahn_city_access
  • 51.
    51 The Darlington UpgradeProject should see travelling times reduced for the southern suburbs. It is the next step in the upgrade of Adelaide’s North-South Corridor and will deliver an upgrade of approximately 3.3 kilometres of the existing Main South Road, including: • A non-stop motorway between the Southern Expressway and Tonsley Boulevard • A lowered, non-stop motorway passing underneath Flinders Drive, Sturt Road, Sutton Road/Mimosa Terrace and Tonsley Boulevard • Grade separation of the Main South Road/Ayliffes Road/Shepherds Hill Road intersection • Main South Road (at grade) service roads along both sides of the lowered motorway to provide connections to Flinders Drive, Sturt Road and most local roads • Full free flow interchange at the Southern Expressway/Main South Road with dedicated ramps providing direct access to the new motorway and Main South Road Source: http://www.infrastructure.sa.gov.au/nsc/ darlington_upgrade_project All of these projects will provide Adelaide with improved roads and infrastructure. Given the continued urban sprawl, improved access to the city is a positive for property owners situated away from the CBD. The general effect these projects are likely to have on property prices will be evident once the projects are finished in the next couple of years. The Darlington Upgrade project in particular will improve accessibility to the CBD for suburbs south of Darlington and users of the Southern Expressway. The impact on property values will not be evident until completion of the project in the next couple of years but it is likely to be positive. Mount Gambier The property market in Mount Gambier is currently relatively stable. There has been a slight decrease in house sales for the first quarter in 2016 compared to the first quarter of 2015, however sales are still noticeably higher than they were in 2011 when sales levels had softened. The chart below shows that in the first quarter of both 2014 and 2015 sales numbers were up on previous years dating back to 2009/10. This is a positive sign for the Mount Gambier housing market. Sales numbers tend to indicate that the Mount Gambier market has stabilised and we are returning to the sales numbers experienced in previous years when there was more positivity in the local property market. Month in Review June 2016 Residential
  • 52.
    52 Sales evidence indicatesthat most of the dwellings sold in Mount Gambier in the first quarter of 2016 are in the price range of $250,000 to $300,000. This is a reflection of the first quarter of 2015. The price range of $250,000 to $300,000 is affordable for owner occupiers entering the market and for investors looking at property that provides a stable rental return. Dwellings under $150,000 are generally in less sought after locations and have limited market activity. Dwellings over $500,000 are at the top end of the market and have a reduced market segment. Unit sales for the first quarter of this year are also similar to the first quarter of 2015, with the most popular range being $150,000 to $200,000. The upper price range in Mount Gambier is showing good signs, with dwellings between the price range of $400,000 to $450,000 having doubled compared to the first quarter of 2015 and with three houses selling for over $500,000 this quarter. In the first quarter of 2015, there was only one sale for $500,000. The three properties that sold for over $500,000 in the first quarter of 2016 are listed beside. 5 Queens Avenue, Mount Gambier – $580,000 24 Power Street, Mount Gambier – $567,000 10 Dawn Court, Mount Gambier – $560,000 There is an optimistic outlook for the remaining half of 2016 and overall, we are expecting this year to be quite similar to last year with no major fluctuations in the local market. Month in Review June 2016 Residential
  • 53.
    53 Tasmania’s state economicdata continues to remain relatively stable with unemployment at 6.6%, up slightly (0.2%) since the end of 2015 but 0.8% lower than at the same time last year while the gap between Tasmanian and the national average unemployment rate has widened. The Australian Bureau of Statistics measure of job vacancies for the state remained stagnant for the past year departing from the national average where gains were made. Building approvals continue on a downward trend and are somewhat lower than at the same time last year. This cooling could be attributed to the shrinking First Home Builders Boost (FHBB) grant. The grant was reduced from $20,000 on 31 December 2015 to $10,000 on 1 January 2016 for first home buyers or builders of new residential dwellings. Some land developers appear to have anticipated this cooling towards the end of 2015 and were attempting to bring forward demand with advertised incentives such as new cars and gift vouchers. Incentives were also extended to the building industry and are still being offered. Tasmania’s future economic focus continues to be predominantly education, tourism and food production. Educational developments include a $10 million redevelopment of Latrobe High School; approval by Hobart City Council of a $90 million University of Tasmania performing arts hub; and a $3.6 million refurbishment of the South Hobart primary school. In tourism, the following developments have recently been announced; government funding for several regional festivals and tourism events; a $40 million runway extension at Hobart; an increased number of Qantas flights into Hobart; a $2 million upgrade of the South Cape Track; Regional Tourism assistance to help development and expansion on Bruny Island for a visitor experience centre by Bruny Island tours and expansion of Bruny Island Cheese Company’s cellar door; a $300 million capital works project to be implemented over ten years to upgrade the Sandy Bay shopping precinct; road and pedestrian access improvements within Hobart. Recent agricultural developments include: assistance to rebuild and monitor the affected Pacfic Oyster Mortality Syndrome industry; approval of the Southern Highlands irrigation scheme; opening of the Blue Banner pickled onion processing plant in Ulverstone; investment by Bosch into a Tasmanian agricultural technology company enabling them to expand their operations and develop a global outlook with global licensing. The Tasmanian residential property market continues to experience small annual increases in sales volumes across the state and in some areas, stock shortages have seen some capital growth in the major population centres. Statewide centrally located suburbs that contain a good range of facilities, larger infrastructure such as shopping centres, educational and health institutions and public transport tend to be popular with renters and purchasers alike and are viewed as having the best capital growth potential. Kingston, Howrah, Blackmans Bay, Glenorchy, New Norfolk and Sandy Bay are suburbs where the greatest sales volumes have occurred recently in the south, while in the north the suburbs of Riverside, Newstead and Newnham have experienced the greatest recent volumes of sales. In the north-west region, Devonport has seen the greatest number of sales. Month in Review June 2016 Residential Tasmania
  • 54.
    54 Darwin As we nearthe mid way point of 2016, there is not a lot to cheer about in the Darwin residential property market. The market started to come off some 18 months ago, although 2016 appears to have seen the worst of it. There isn’t one specific factor that single- handedly changed the market direction; it appears to be numerous factors working simultaneously on a micro and macro level, creating great uncertainty in the market. On a local level, the removal of the first home owners grant (FHOG) on existing property at the end of 2014 had an immediate impact on older unit stock that was usually a popular entry level property for first home buyers. Most notably older units in Palmerston felt the pressure first, sales evidence showing a unit purchased at the height of the market at the start of 2014 is now worth 25% less some two years later. As promised by the government, a large amount of land has been released over the past few years to ease property prices and with the FHOG’s only being available on new stock, this became a more appealing option to young buyers. With most of the new estates such as The Heights, Durack, Bellamack and Muirhead now complete or on their final stages, the majority of the available land can be found at Zuccoli. Sales of vacant land have eased and prices have come back as developers try to attract people into the market. You can’t talk about the property market in Darwin without mentioning Inpex and the phenomenon it created. A large supply of workers arrived on Darwin’s doorsteps some years ago needing a place to rent. The injection of people to the population was so rapid, rents sky rocketed with people willing to pay above market to secure a roof over their head. Developers, excited by the high demand and limited supply, began construction but Rome wasn’t built in a day. The delay of the new stock meant we had to ride out the high rentals until the new stock became available. Fast forward to mid 2016 and final touches are being put on some of the brand spanking new units in town ready to be occupied but rents have fallen and there are very few investors in the market. Many of the pre-sold units are already worth less than their initial purchase price. On a broader scale with mining quieting down, activity across the equator in China easing and banks tightening up their purse strings, Darwin has felt the effects like the rest of Australia. All as the Reserve Bank of Australia announces another interest rate cut trying to inject some stimulation into the economy. Unfortunately for home owners in the top end, no one has been immune to the falling market with sale prices coming back and more worrying the volume of sales down a dramatic 31.6% (REINT RELM) from March 2015 to 2016. Unfortunately there is no silver lining at this stage. We don’t know if we’ve hit rock bottom yet and there isn’t any big project on the horizon to spur on the market again. With both Federal and Territory elections scheduled for mid year, it’s safe to say we are in a wait and see period. Alice Springs It has been more of the same in Alice Springs following the removal of the First Home Buys Grant for existing dwellings in December 2014. Low transaction numbers are having a significant impact on the market, particularly at the lower priced entry level segments. There were only 339 sales in the broader Alice Springs market in the year to March 2016, down from 480 in the previous corresponding period and down significantly from the mid 2000s which saw sales numbers in excess of 700 per annum. There are positives however, with the new development at South Edge nearing completion Month in Review June 2016 Residential Northern Territory
  • 55.
    55 and sold outfeaturing 2-bedroom, 1-bathroom townhouses ranging from $335,000 to $380,000. Other areas performing well are in rural residential with four settled sales in excess of $750,000. The golf course area (Desert Springs) also performed well with four sales in excess of $750,000. A renovated 3-bedroom, plus study and 2-bathroom rendered brick dwelling transferred at $830,000 (pictured below) and a rural residential property is currently under contract (advised unconditional) at $1.25 million. The upcoming election will be important for the local market which does not have any incentives for first home buyers for entry level properties such as older style units and houses under $500,000 both of which have experienced significantly lower sales volumes. Month in Review June 2016 Residential
  • 56.
    56 Perth As forecast, wefind ourselves at the mid point of the year and still wondering if the market is approaching the bottom of the cycle or whether the decline in activity will continue for the remainder of 2016. According to the Real Estate Institute of WA, sales activity in the March quarter decreased by some 33%, from 8,798 in the December quarter to just 5,852 in the first quarter of 2016. Over the same period of time, listings on the market increased by 6% to 15,277, well above historical averages and some 3,000 to 4,000 above a balanced market. It is likely that this figure may continue to increase over the traditionally subdued winter period. Interestingly, first home buyers have increased their presence in the market and comprised 45% of all activity in the quarter, a figure that is a almost unheard of in the absence of a substantial government grant. This activity assisted to decrease the median sale price from $545,000 in the December 2015 quarter to $520,000 at present. Bucking the trend, the median sale price of vacant land has increased by 13.1% over the previous 12 months and by 8.9% in the March quarter, with the majority of transactions being for smaller allotments – possibly related to the heightened level of first home buyer activity. In fact, we remain very cautious about the market for vacant land, particularly in urban fringe localities, as the differential between established housing prices in sought after areas and new house and land packages in inferior localities continues to dissipate. Similarly, areas which have traditionally attracted significant levels of investor interest are struggling to find their feet. A combination of a lack of confidence and restrictions in lender financing have put the brakes on many areas previously targeted by investors and speculative developers. This situation becomes more dire in several regional centres where many lenders are restricting financing on a postcode basis, severely limiting the ability of potential buyers to secure finance and therefore exacerbating the decline in values. Established housing in many well established localities is approaching land value in comparison to the prices being asked (and paid) in some outlying, traditional first home buyer areas. Many agents are indicating an uplift in enquiries over the past four to six weeks, however we have been through several of these mini cycles in different areas over the previous 18 months. The difference in this instance may well be the latest interest rate reduction by the RBA. We have received feedback from several finance brokers that their clients were or are waiting for fixed rates to be reduced before committing to an upgrade of property or location. This may result in some pent up demand and a spike in activity, however we caution that we do not expect values to improve in the short term. Amongst all the negative statistics, we are seeing many positives in the current market – assuming you are a buyer who has a stable financial position. Many desirable areas have seen downward pressure on values, hence we are hearing about (and seeing) many contracts that appear to be well below current market parameters and indicate a level of bargain buying occurring from forced sellers. Given the high level of first home buyer activity in the market, we anticipate a wave of trade up transactions to occur throughout the remainder of 2016. South West WA Throughout the South West of Western Australia there is a reduced level of sales with a weakening of values throughout the lower and middle segments. The top end of the market continues to be problematic, with continuing weak demand and an over supply of properties for sale, coupled with a lack of prospective purchasers in that value range, resulting in downward pressure on values. Month in Review June 2016 Residential Western Australia
  • 57.
    57 The rural residentialmarket is also continuing to slow with the majority of sales being below $1 million. This market is also experiencing extended selling periods. Vacant land values have now started to level after seeing a correction throughout the first half of 2016. Building activity has continued to weaken over the past six months, however the month of April saw an increase in the number of new homes sold, indicating a levelling out. Rents have fallen significantly in the past 12 months, particularly in the outerlying residential estates. Smaller lot developments in the new subdivisions have become popular due to their affordability and it is anticipated that this will be a trend going forward. This is showing in the move away from larger homes to the smaller, better appointed homes on small blocks, with limited gardens and the ability to lock and leave. Overall it is likely the property market in the South West for the remainder of 2016 will be slow. The swings of the Perth market during the past several years have been missed in the regions but we would recommend caution as the slow down in the state resource sector, continued weakness in Perth and general economic uncertainty could promote more of a widespread downturn throughout the market. Esperance As we head towards the middle of the year, it is time for a mid year review of the market performance in the Esperance district. In short, quiet is the best way to describe it. Small bursts of activity then nothing have been the norm for the past six months and a smoother spread would be welcomed. 2015 slowed in the final months and there really hasn’t been any traction since then. Part of the reason is seasonal with cropping programs well underway after a reasonably traditional break to the season however there seems to be a generally cautious sentiment with prospective purchasers delaying activity until the signs of broader economic improvement are consistent. With there still being relatively low interest rates and a broad spread of affordable housing, it is hoped that the lack of recent activity is only temporary and that regular volumes will return in the near future. The residential market in Esperance has seen low sales volumes across the board however values for the most part indicate consistency. Values in the lower socio economic areas have marginally improved as purchasers realise these areas provide some of the most affordable housing in the region, are well located close to schools, shopping and recreational facilities and can provide the best return on investment for residential property with correspondingly high rentals relative to capital outlay. A higher volume of sales in excess of $200,000 have occurred compared to the same period last year. The mid tier market of say $300,000 to $450,000 has seen consistent activity and this range is well represented in volumes and values with a relatively stable correlation between supply and demand. Sales over $500,000 have improved over the corresponding time last year with some sales interspersed through the $600,000s, $700,000s and $800,000s price ranges. Prestige residential property is limited in this area and we have seen two sales in excess of $1 million compared to none over the same period last year. Rural residential lifestyle properties have maintained their consistency in sales volumes with realised sales over all price ranges noted. Lower end property with modest houses and negligible outbuildings have achieved prices within the $400,000 to $500,000 range with other sales pushing upwards to the $900,000 range for more substantially developed properties. The satellite localities of the Esperance shire have had little to no activity over the first half of the year due to limited supply. Encouragingly, the small coastal town of Hopetoun has seen sales volume increase slightly over varying value ranges which is giving some hope that values Month in Review June 2016 Residential
  • 58.
    58 there may havestabilised. There is still an issue with an extensive oversupply of property, especially rural residential land, but in time it is hoped that supply will gradually reduce and allow values to recover. To the north, Norseman is still struggling with uncertainty over local mining operations however sales volumes have been strong in comparison to recent years, although at the low end of the market with most transactions typically ranging between $30,000 and $45,000 for established homes, which is actually a minor improvement over the corresponding period last year. A general consensus is although there is a lot of uncertainty in the local market, Norseman still provides some of the most affordable housing in the state, if not the country, for an isolated town having a moderate level of local services. So, market activity over the first half of the year has been quiet. Some more notable transactions have occurred on the back of lower sales volumes and if seasonal conditions remain strong, overall sentiment will still be cautiously optimistic for this region. Month in Review June 2016 Residential
  • 59.
  • 60.
    60 Overview With all theactivity in the rural property market and the continuing reduction in interest rates (good for borrowers, not good for investors), this month, I set the team the challenge to think about what they would do if they had a lazy $10 million to invest into the rural sector. There is, however, a specific dairy review from David Leeds in Victoria, in lieu of the $10 million task, given what is currently unfolding in the sector and implications for values. Some interesting thoughts and scenarios have been provided which you can read below, however, I thought I should also consider the question of if that lotto ticket did indeed materialise, what would my game plan be the first $10 million? So what do I think? Firstly, I have more of an investor mindset than operator, given the job I do. As an investor, I am thinking about property cycle as part of my outlook. Based on the Herron Todd White grazing property index, we are towards the start of the next upward run in land values, being about eight years up, followed by eight or so years negative to flat growth. If this trend from 1980 is correct, the immediate market is looking sound to invest. While it would be great to buy into the family business, my brothers may have a different idea. So where would I place my dollars? The beef sector has kicked on the back of the commodity outlook; this is one to watch. However, the jump in values in some regions may impact the return outlook in the shorter term. Permanent tree crops have experienced strong growth in values, underpinned by good export opportunities and sound commodity pricing. However, the almond prices have reduced approximately 40% in the last six months, so it will be interesting to see where this lands. If, however, water is secure, the regular cash flow outcomes do appeal on a long-term basis. The poultry market is possibly the most stable (chicken meat). While fundamentally, it only has domestic demand, this demand has a long history of around 3% per annum growth in demand. Furthermore, supply and demand are largely in balance and as one grower recently reflected to me, “we do not get droughts in the chook sheds”. Returns in the range of 7% to 12% per annum are not uncommon in this market. In the cropping and dairy sectors, global supply forces the pricing on these commodities to levels where, in my view, make a return more volatile. With the build-up of grain stockpiles, this may take some time to adjust. The sheep industry is, for me, the one where the reduction in the national flock (along with New Zealand reduction) and also the changing focus from wool sheep to a meat sheep, or indeed the meat wool hybrid, provides opportunity for diversification. Both wool and lamb/mutton markets are reflecting the reduction in the national flock and therefore, supply and demand are more in balance. Sheep are also a global commodity, without, in my view, the same exposure to supply opportunities, as beef, grain, diary and sugar. The other aspect of this country type is typically, they are mixed farm operations. Therefore, I get some cropping opportunity and maybe even some land development, or there is the chance to run an organic product, which is a growing market within the broader sheep meat market. As for my lazy $10 million, I would look to the sheep sector and have poultry as the other target, for now. Reading the contributions from the team, it makes one think about investment money and moving into a multi-commodity investment which seeks to get the best mix of yield and growth investments within a portfolio managed by good operators. I wonder how far away one of these may be in the offering. My challenge is however, as a non-operator, I would be looking to find good farming families with structure; a plan for growth; and clarity on their succession plan in order to form a relationship to invest alongside that structure which would provide mutually beneficial outcomes and give the family the opportunity for growth with equity capital not debt capital. Month in Review June 2016 Rural
  • 61.
    61 So back towork to see how to get the $10 million together, as my lotto ventures are about as good as my tips at the races (on the maybe one day a year I actually have a bet). Enjoy the read from the team. Contact: Tim Lane – 07 3319 4403 National Director, Rural Southern Queensland While all the hype seems to be at the big end of town, there are many smaller family farming operations kicking some well earned goals in the agricultural space at present. There has been a noticeable increase in property transactions across most price brackets though it is those sales in the sub $10 million that really show the level of optimism and confidence in a range of different agricultural sectors at present. Those in a position to do so are capitalising on low interest rates, generally improved commodity prices and positive market sentiment by increasing not only their stake in land but also relevant infrastructure, research and development. It is this type of investment that will improve efficiencies and production output for their respective enterprises. If I had a lazy $10 million to invest I would be looking at the various options currently out there. One of them would be looking for a smaller though successful business model that required capital to further expand as opposed to starting from scratch with many unknowns. There is value in the businesses that have endured the tough times and been innovative enough to survive and prosper through varying market cycles. Humpty Doo Barramundi is an example of such a business in the aquaculture sector. The company has done the hard yards and is now looking to expand production significantly. In this case they may be able to self fund expansion though it provides an example of a successful business selling to a niche market that seemingly can’t get enough of the quality product. Within the past three years there have been sales of some larger cattle grazing properties in Queensland where the purchasers have been city based individuals or companies looking to diversify. In certain cases these parties have secured a pre commitment to lease these properties back to larger cattle companies with fully integrated business models thus providing a return on investment for the purchaser and the likelihood of capital gains through further development and capital outlay. Under such a scenario I would be hopeful of an investment yield of 4% to 6% before capital gains depending on the asset. There have also been transactions where the purchaser has chosen to source experienced local managers to run a beef enterprise in their own right. The return under this option is likely to be higher which is reflective of the greater risk and input involved. In terms of land I think there is value in buying run down or under developed properties in safer rainfall areas and in reasonable proximity to markets. These types of asset have the potential; they just need the knowledge and capital for improvement. The difficulty now is finding the right type of asset in the improved market. At the bigger end of town there is less competition though seemingly less large scale fully integrated options available. I have outlined several investment options which I think all have merits. If I had to choose one I think I would stick to what I know and try to purchase a larger scale cattle grazing property in south-east Queensland or north-east New South Wales. I think there are opportunities to buy country in this region between $3,000/AE to $5,000/AE depending on the quality and development of the asset. I would then look at stocking the property myself with cattle that targeted a specific area of the beef market such as Organic, Certified Grass Fed Beef or Wagyu. I would also leave some funds in the bank for working capital and future development. Contact: Digby Makim – Ph: 07 4622 6200 Month in Review June 2016 Rural
  • 62.
    62 Central QLD We havebeen given the task of providing our opinion of where we would place $10 million in capital in the event we were so fortunate to have this type of money at our disposal. This question is actually one that we are often asked in passing conversations. Will McLay and I (Michael Chaplain) have put our heads together, and this is what we have come up with: There are plenty of areas around Central Queensland that stand out from a lifestyle perspective - rolling hills of wall to wall Buffel grass with the views only inhibited by the odd scattering of Bottle Trees. Districts such as the Dawson Valley, Bauhinia Downs and Arcadia Valley certainly spring to mind as great places to raise a family and produce prime beef (or crops). However as far as looking at acquiring assets from purely an investment perspective, there are additional factors that come into play. First and foremost there needs to be a clear investment scope, which sets out the how, when and where of the investment approach and execution. One of the primary considerations is what return on investment (ROI) is required or anticipated, as well as how this return is matched with an investment horizon, meaning how long are you willing to wait before realizing your return. For example, do you want a higher annual return with a shorter investment horizon, say five to ten years, or a lower annual return over a longer investment period, say ten to 20 years or longer? The above scenarios may sound simple on paper, however there is one primary variable that is somewhat more difficult to predict than the supply and demand equations and market cycles which most other industry sectors do not have to contend with - weather. Seasonal changes are almost impossible to predict and can have a catastrophic impact on the bottom line of an agricultural enterprise. Most readers are now probably thinking “tell me something I didn’t know”, but bear with us. Although we cannot control or even predict (with any strong degree of long term accuracy) the weather, we believe you can structure an investment vehicle which reduces the risk of low or negative returns due to unfavourable seasonal circumstances or commodities prices. We believe investing in a cross section of commodities would assist to deleverage the level of risk of an agricultural investment. Bearing in mind we are working with the industries and commodities that are currently available within Central Queensland, our three commodities of choice would be beef, horticulture and one other non agricultural asset (e.g. large industrial shed or commercial office space with blue chip tenants). Our rationale behind these three choices is as follows: Beef Beef cattle grazing assets which are lower to mid range scale (about 2,000 to 6,000 adult equivalents) are usually readily available in the market place. Management of these assets is relatively straight forward, however there is also a tenant market for short and long term leasing. Cash returns are generally low and seasonally dependant, which can at times produce a negative yield. Recent publications have suggested that the top 20% of producers are able to produce sustainable cash returns in the order of 4% to 6%. Beef assets have over recent decades demonstrated a relatively low volatility with fairly consistent underlying growth trends. It appears that the market accepts this as appropriate offset to low cash returns. Horticulture Horticultural production properties such as tree cops or small crops are somewhat more intensive in nature, require higher production inputs and demand specialised management. These assets can however provide far more rewarding cash yields when the business component is appropriately operated. Underlying land growth is not as proven as beef, however double digit cash returns are common. Investment in these industries can offer a good level Month in Review June 2016 Rural
  • 63.
    63 of exposure toland and water assets, as well as emerging export commodity markets. Industrial or Commercial Real Estate An off farm income stream provided by a passive commercial investment would be complementary to an agri weighted portfolio. Off farm assets offer a more predictable cash flow which is not subject to the prevailing season or commodity pricing. Be sure to be well advised when entering this asset group as market cycles and property specific features can present dangers for investors. Buyer groups for agri assets are generally limited to owner operator families and corporate investors. In this respect we believe that there is a market void between these two groups, which could offer investors the opportunity to target assets in a less competitive market sector. If this exceeds your capital limits then an alternative such as co- investment could offer access to this space. Your $10 million contribution to a larger pool of capital (say $30 million), would allow entry into a higher, but more economical scale asset (essentially making the dollar extend further), while also giving co-investors the security that their capital is in the hands of someone who has a significant financial commitment to the asset or business. Conclusions Based on the brief rationale provided above, we have decided to allocate the following portions of our $10 million capital to each asset class: • Beef – 60% ($6 million) • Horticulture – 30% ($3 million); • Industrial/Commercial Real Estate – 10% ($1 million) We believe exposure to a cross-section of assets of this nature would provide a more stable and resilient cash yield while affording the ability to weather the tougher periods and cash in the better years on each asset type. A well balance agricultural and non residential investment portfolio can offer solid cash yields with underlying assets growth, presenting a more attractive opportunity than equities or listed property trusts. This will require a substantial level of research and potentially time. Interested? Give us a call. Contact: Will McLay – Ph: 0428 612 457 Michael Chaplain – Ph: 0400 968 952 Mildura/Sunraysia An investor looking to buy a large rural enterprise will always contemplate how to balance risk and return. The good news is that many of our key local horticultural industries are currently experiencing higher commodity prices due to a range of factors including a lower Australian dollar, improved access to some key export markets and reduced global supply. In the short term, it looks more likely that a decent return can be generated from crops such as almonds, citrus and table grapes. The bad news for an investor is that this improvement has already created a spike in property values, particularly in the almond and table grape market sectors. We feel that values for these enterprises are right near the peak at present. Buyers also need to be mindful of the production risks, which include the availability of irrigation water and extreme weather events such as frost or prolonged rain at harvest time. For a buyer with a high appetite for risk, the timing might be right to invest in a large scale wine grape vineyard. The recent increase in the cost of leasing temporary water has made many growers question the economics of turning water into wine and we are aware of several large local vineyards being either mothballed or redeveloped to other crops. It is inevitable that production in most inland areas will continue to decline at a time when large wine companies are reporting good profits. We do not expect to see any rapid improvement in wine grape prices, but at the same time some gradual improvement now appears likely with some reports suggesting supply and demand are now balanced. Month in Review June 2016 Rural
  • 64.
    64 Wine grape returnsat current levels are little more than break even, however there is considered to be a reasonable chance of vineyard value appreciation in the medium term. But as an insurance policy, prospective purchasers or investors should be looking at vineyards with soil types which could support other crops, to hedge against the continuation of wine grape prices languishing. Returns are probably too tight to share with a lessee, so buyers considering this strategy might have to assume the production risk, at least initially. It is becoming more difficult to secure large scale greenfield horticultural development sites. For several years there was little interest in this activity, however the big almond players have been scouring the district over the past one to two years. Demand for this type of property will always be cyclical, however there could be potential to acquire and land bank this type of property, generating some return from dryland farming pending any future development. A strategy for a buyer with a lower risk profile would be to consider purchasing dryland cropping country in the southern Mallee district. Values have appreciated dramatically in the more reliable Wimmera region, further to the south, to the extent that many Wimmera farming families are now priced out of the opportunity to expand. Some are likely to source land in other areas such as around Hopetoun, Lascelles and Sea Lake if they wish to expand current operations without paying the premium prices currently being recorded in the Wimmera. This may result in an uplift in values over the next few years in these Southern Mallee areas. There are examples of long term leases being put in place for this type of country, providing returns of around 6%. For a passive investment in agricultural land, this could be a good opportunity. Contact: Shane Noonan – Ph: 0427 735 328 Murray Riverina Recent cuts to Farmgate Milk Prices (FMP’s) by the two major manufacturing milk processors in Victoria have resulted in widespread concern around the viability of the dairy industry. While noting that the fundamental long term outlook for these producers remains unchanged, relative to where they were prior to the cuts (and those supplying other processors will not be directly affected), there are some major challenges confronting producers and the broader industry to manage the short and medium term consequences of the cuts, particularly as they relate to cash flow. To date, Murray Goulburn and Fonterra are the only processors to announce cuts to their weighted average or headline FMP for 2015/16 and at the current time, neither have provided any guide for the 2016/17 season. Consequently, the areas most heavily affected by the cuts are likely to be those where these processor have a strong supply footprint, being Victoria, Tasmania and to a lesser extent, South East South Australia and the Riverina in NSW. In more recent years, demand for milk products have largely been driven by the components in milk (Fat & Protein), rather than the volume, with a larger proportion of Australia’s milk being manufactured into some form of product for domestic or international sale. To reflect the driver of demand for the end product, processors moved some time ago away from a volume based payment system (c/l) to one which reflects the contribution of the component of the milk with prices paid on a dollars per kilogram of Milk Solids ($/kgMS) basis. Broadly speaking, cuts in the final FMP for the 2015/16 season in late April/early May by both processors were made from opening prices, in the order of $5.60 per kilogram Milk Solids (kgMS), back to approximately $4.75 per kgMS to $5 per kgMS. Independent industry analysts are forecasting an opening FMP in the order of $4.50 per kg MS, based on current market metrics for the 2016/17 season. The approach to the cuts and the mechanics of any ‘claw back’, have varied between processors. Month in Review June 2016 Rural
  • 65.
    65 A review ofDairy Australia's Dairy Farm monitor project annual report for 2014/15 across the production regions, which will be mostly affected by the cuts, demonstrates the following variance around the headline FMP for the 2014/15 season, for the sample farms across the regions. We have applied the 2014/15 variance to the revised headline FMP for the 2015/16 season with the next row recording the average costs of production for the 2014/15 season (total variable plus overhead costs including an allowance for depreciation and imputed labour) as follows: N Vic SW Vic Gipps North NSW Sth NSW Tas SA 2014/15 Headline Final FMP ($/kgMS) 6.00 6.00 6.00 6.00 6.00 6.00 6.00 2014/15 Ave Milk Income (Farm Monitor Sample Group) 6.09 6.16 5.88 7.62 7.28 6.19 6.35 Variance to Headline FMP 2% 3% -2% 27% 21% 3% 6% Propose Headline FMP ($/kgMS) SAY 5.00 5.00 5.00 5.00 5.00 5.00 5.00 Adjusted FMP for variance based on 2014/15 Farm Monitor Sample Group 5.08 5.13 4.90 6.35 6.07 5.16 5.29 14/15 Cost of production (Fixed & Variable costs) 5.53 5.42 5.15 7.55 6.11 5.04 6.34 Surplus/Deficit ($/kgMS) -0.46 -0.29 -0.25 -1.20 -0.04 0.12 -1.05 We note that several of the regions are broad and give a slightly skewed result (e.g. South NSW incorporates South East NSW which is more closely aligned to North NSW, along with the Riverland whose figures would more likely resemble those of Northern Victoria along with South East SA, whose figures are more likely to resemble those of South West Victoria, than the average of SA which includes some central SA producers). Though not yet complete, a review of the 2015/16 season suggests that farm business cost structures are likely to be higher when compared to the 2014/15 base year, for most suppliers. In the Northern Victorian Irrigation Districts and the Riverina in NSW, water prices have tracked significantly above 2014/15 levels, which has likely resulted in significantly higher production costs for producers in these regions. This is demonstrated by (by way of proxy for the broader market) the Temporary trade price of Murray Zone 7 Allocation Trade below: Source Victorian Water Register - http://waterregister.vic. gov.au/water-trading/water-share-trading Even assuming minimal increases across most other cost line items (i.e. assuming the price of grain/hay is not materially different to the 14/15 season and subdued inflation across most other cost lines) the Month in Review June 2016 Rural
  • 66.
    66 increased cost ofwater, in conjunction with difficult seasonal conditions, suggest that the breakeven price in Northern Victoria, in particular, is likely to be higher in 2015/16 than what it was in the 2014/15 year ($4.99 per kgMS). While noting the 2014/15 data is drawn from a stronger milk price year (where cost structures may have been intentionally higher to maximise on the higher milk price), it is clear that even the upper end of the revised FMP for the 2015/16 season is below the cost of production for most dairy producers (excluding Tasmania), based on the 2014/15 Dairy Farm Monitor Report sample group. An allowance for higher production costs in the 2015/16 season, relative to the 2014/15 base year, indicates that deficits will be larger than the figures provided suggest. A closing price ranging between $4.50 to $5.00 per kgMS for the 16/17 season would result in further deficits being accrued, assuming no significant decreases in the cost of production. In Northern Victoria and Southern NSW, the breakeven price may come under further additional upward pressure as a consequence of the soft outlook for water allocations in the 2016/17 season. Farmers will therefore need to make significant business decisions as to which course of action to take. Those who are willing to continue with adequate equity are likely to need support from financiers to plot a course through the coming period. Whereas, those who are willing to continue but have insufficient equity to fund the deficit, will need to make alternative plans. It is likely that those who are unable to find support will precipitate additional supply in the property market, in the absence of additional demand, land prices are likely to slide down the demand curve until equilibrium is reached with some potential for distressed assets. Historically, high prices for irrigation entitlements across the irrigation districts may offset some of the downward pressure for land values for those with reasonable holdings of water. As a proxy for the broader water market in the southern connected basin, the following graphs of prices for High Reliability Water Entitlements (Murray Zone 7) demonstrates the relative strength in the marketplace currently: Conversely, sales activity across the north of Victoria and the Riverina has been relatively strong over the past 12 month period in the lead up to the milk price cuts, notwithstanding strong market signals from the global dairy markets (refer graph below), and an Australian dollar which has been stubbornly high: Source Global Dairy Trade Quarterly Report March 2016 - https://www.globaldairytrade.info/en/product-results/gdt- events-reports/ This may have been a consequence of processor guidance on FMP prices with an indicative final FMP of $6.05 per kgMS from Murray Goulburn and Fonterra in 2015/16; and despite Dairy Australia's “Situation & Outlook” report in October 2015 which reported that "in some peoples’ view, the announced Month in Review June 2016 Rural Source Victorian Water Register - http://waterregister.vic.gov. au/water-trading/water-share-trading
  • 67.
    67 opening price of2015/16 of $5.60 per kgMS was an appropriate budgeting baseline". For the reasons outlined above, the optimistic outlook and relatively strong demand in the past 12 months has softened. Anecdotally, we are aware of multiple transactions, which have been aborted or shelved, for the time being, as long term industry participants look for improved buying opportunities which may arise under the current market conditions. Those interested in exiting the industry (i.e. those able but unwilling to fund the deficit; and those willing to continue but unable to fund the short term deficit) will need to carefully consider their options in a property market which will invariably come under downward pressure. Those with relatively limited dairy infrastructure may be able to sell into other relatively stronger alternative markets, for example, to irrigated cropping or mixed cropping/grazing enterprises. This will depend on the proximity of the holding to alternative users, along with the nature of existing layouts and the extent of the dairy specific infrastructure at the property, which will ostensibly be redundant for a purchaser interested in operating the property for an alternative use. Contact David Leeds – Ph: 0418 594 416 Country NSW One area that continues to be a topic of discussion with many financial institutions is the implementation and impact of properties being encumbered with carbon credit schemes. While we have mentioned these before we are beginning to see the change now from carbon credit schemes which focused on the locking up of areas that had the right to be cleared to agreements now focusing on the regeneration of the existing timber and scrub. Initial discussions with some landowners that have participated in these regeneration schemes indicate that the underlying grazing capacity of the areas outlined in the agreement are negatively affected. One recent agreement saw 60% of a large grazing property in far western New South Wales being encumbered by a carbon agreement. Our initial assessment of this agreement would indicate that the only grazing allowed is crash grazing to help reduce any susceptibility to bushfire. Effectively this property has just lost 60% of its carry capacity with these restrictions in place for 100 years. While you might say why would a land owner do this? The cash incentive over a ten year period is substantial and equates to approximately 20% to 25% of the overall asset value per year. While this appears to be a very strong return, these returns are in effect less than the returns shown from the initial carbon agreements which saw landholders extinguishing property vegetation plants which allowed wholesale clearing to be undertaken. The main difference here is that the properties with the clearing permits are able to include all of the sequestered carbon in the growth on the country, while the regeneration agreements only account for the carbon sequestered each year above the base level which is determined by the carbon aggregator. Until we have quantifiable market evidence there are a number of plausible ways to approach these rural properties. 1. Disregard the added value of the income stream altogether 2. Determine the net present value of the projected income stream and add it to the underlying land value 3. Capitalise the income stream at an appropriate risk rate All of the above approaches to valuation would need to take into consideration the impact on the long-term grazing capacity of the property. For the property mentioned above from a valuation perspective the landowner has now effectively dropped his carry capacity by 60% which will have a very large impact on the asset value. We do not see valuation approach three as a viable option and currently until we have market evidence we have little regard for the added value of the income Month in Review June 2016 Rural
  • 68.
    68 stream, yet takinginto account the long-term effects on grazing on the property. As a valuers our role is to take the view of a prospective purchaser and this is where the difficulty lies in the present market as we are unaware of any sales of rural properties with these large income streams in place and as such, we have no guidance from the market at this stage. We believe there is a valid argument that a property with an income stream equivalent to 25% to 30% of its asset value per year for ten years would achieve high levels of interest from the market however the difficulty with these carbon agreements is the associated risk that comes from a force majeure (such as bushfire). In cases where areas are burnt out by bushfires, the effect on the agreement is to stop any payments for the carbon credits associated with the timber and growth on the property until the regrowth has returned to a level that was similar prior to the fire event. This may take a number of years and as such while it looks relatively simple to assess the income stream over a ten year period the underlying risk is very difficult to quantify and until we have demonstrated market evidence regarding what risk levels landholders and prospective purchasers are willing to apportion, we have been taking a conservative approach to the impact of the agreement on the property value. The other aspect here is that these agreements continue in place long after the income stream has finished with most agreements in place for either 25 years or 100 years. There are obligations on the landholder to maintain fencing, adequate roadways and feral animal control for the duration of the agreement which will have costs involved. So long after the income has stopped the property will be burdened by these additional costs to adhere to the agreement. Again we do not have any guidance from the market on how prospective purchasers will view this long ongoing burden to adhere to the carbon contract. The one thing that we have seen in the past 12 months and assessing a number of these agreements is that they are all slightly different and that each one needs to be assessed individually. Some of these agreements have upfront payments with small annual continuing payments, while most of the ones we deal with have an income stream over ten years with most payments equal in nature over that period. Where would I spend $10 million? This is a question that we as valuers are asked often, sometimes in the form of "where do you think the best country is?" or "Where is the best value?" and so on. In terms of sheer bang for your buck it is hard to go past the far western area of New South Wales. While we have seen increases in dollar per DSE rates over the past two and three years there are still properties available in that $180 to $250 per DSE range which compare very favourably to the inside grazing country where these rates would be between $350 and $500 per DSE. So effectively you can purchase up to double the number of productive units as compared to the inside country for the same money. While this sounds simple the issue here is isolation and transport costs of the end product. Our experience is that many properties are now effectively marketing their sheep or beef in a way that allows for the purchaser to share some of the freight burden. This does have an impact on general achieved dollar per kilo rates however the low cost of production from these areas and the naturally organic nature of many of these properties allow for market opportunities that are difficult to achieve in the inside country. Contact Scott Fuller – Ph: 0427 077 566 Northern Territory So, what can you pick up for $10 million in the Top End? Had this question been posed at the same time last year then it may have been a bit tricky to answer, however now it’s a little easier with a clutch of recent pastoral sales in the Top End, a handful in Alice Springs and the odd freehold mixed farming block sale. Month in Review June 2016 Rural
  • 69.
    69 For cattle stations,$10 million will buy you a small to medium scale (say up to 8,000 or 9,000 AE carrying capacity) pastoral lease (excluding cattle and plant) throughout most districts between say 300 kilometres and 500 kilometres from the Port of Darwin. The recent sale of Lonesome Dove in the Roper District (748 square kilometres and 540 kilometres from Darwin) to a local cattleman in March for $6.5 million (or around $4.5 million assessed bare) is handy evidence, as is the sale of Humbert River in the Victoria River District which recently transferred from CPC to Heytesbury in a sale that was also under $5 million (assessed bare) for a similar scale operation. The sale under contract (and as already reported in the press) of Hodgson River (1,100 square kilometres and 600 kilometres from Port of Darwin) also transacted around similar levels to a nearby pastoralist (actual price still confidential). These blocks are all breeder blocks for the live export market and generally have productive capacity rates ranging from five adult equivalent per square kilometre to nine adult equivalent per square kilometre over their developed areas (ie permanently within three kilometres of water) and between three and six adult equivalent per square kilometre across the entire lease area. They all require a fair bit of supplementation to maintain this level of productivity and the prices paid (ranging from $750 per adult equivalent to around $1,000 per adult equivalent) indicate only modest increase from where market expectations sat this time last year*. We are also aware of a sub $2 million deal (assessed bare) for a smaller than average scale pastoral lease south of Katherine that will also sit between $700 and $800 per adult equivalent (assessed bare). There are presently a couple of pastoral holdings you could look at within 500 kilometres of Darwin including Conways in the Roper District (1,392 square kilometres, 180 kilometres east of Katherine), Flying Fox, Roper District (895 square kilometres, 230 kilometres east of Katherine), Florina (575 square kilometres, 50 kilometres west of Katherine), Middle Creek (602 square kilometres, 180 kilometres south of Katherine) and at a squeeze you could also probably have a crack at Vermelha (2,039 square kilometres, 190 kilometres south of Katherine). If you want to include cattle, then for an average quality herd for the region, in average proportions of breeders to followers, you might be looking anywhere between low $700 to low $800 per head. Down in the Alice Springs districts last year’s sales of Delny and Delmore Downs and MacDonald Downs plus two other small scale leases we understand are currently under contract, indicate that $800 to $1,100/AE bare (again, based on the writer’s estimate of carrying capacity) will buy you some of the most efficient country (profit per kilogram of beef produced) in the Northern Territory. As always, Alice is a tightly held market and you may need to speak to the right people to find out what is currently quietly on the market. In the Northern Territory freehold space the question is more difficult to answer with the number of commercial scale grazing, mixed farming or horticulture blocks sales within the past five years still able to be counted on two hands. Supply remains tight however there is the odd freehold grazing block around Katherine of a scale in excess of 10,000 hectares for sale at sub $5 million which could potentially attract around $1,700 to $1,800/AE of current carrying capacity (bare) for moderate quality, forest country, fenced and watered and with bitumen road frontage. For smaller scale blocks set up for improved pasture grazing, that rate can jump up to $2,500 to $3,000/AE (ex structures) if within 200 to 250 kilometres of Darwin. A small (1,500 hectare) freehold block just south of Adelaide River, about 120 kilometres from Darwin improved with not much more than a decent set of cattle yards, bore and boundary fencing sold earlier this year and showed around $4,500/AE or $750 per hectare for a lump sum of less than $1.2 million. It would make a handy little live export depot with its all weather access. * Note: the writer’s assessed $/AE rates are derived from his own sustainable carrying capacity assessments (in order to maintain relativity between his sales analysis) and may vary from other opinions of carrying capacity. Month in Review June 2016 Rural
  • 70.
    70 South West WA IfI had $10 million to invest in Western Australian agriculture I would look at all the sectors (beef, sheep, grains, dairy, poultry and pigs) as well as different regions across the State. In order to not 'put all my eggs in one basket' I would also split my investment into a number of properties. To start with I recognise that all sectors of the industry have their ups and downs with changing commodity prices and competition. It is therefore important to look past the current situation be it up or down and focus on past trends and future opportunities. Basically Western Australia is split into three regions – the pastoral regions of the north and east which is predominantly leased land, the wheat and sheep growing areas which are generally 100 kilometres plus from the coast and stretch north and east to adjoining the pastoral regions. Then finally the areas with 100 kilometres from the coast which include horticulture, dairy and grazing uses with rural lifestyle and forestry interspersed. This is very generalised but gives an indication for the purpose of this scenario. First we look at the pastoral region and investment in beef and sheep. It has been widely reported that there has been significant investment going into the northern pastoral regions in the past 24 months with some iconic properties selling to prominent Australians and wealthy overseas parties. The majority of these properties have been above my budget and also would require a lot more to develop them to their full potential. So with the beef prices riding high and the future reportedly looking bright I would consider an investment in a pastoral property but it would have to be on a partnership basis. The benefits of a partnership are that you get the expertise of running this type of property with your partner however you also take on the risk of operating this type of property as well. The wheat and sheep growing areas are varied and to the majority have suffered from drought over the past couple of decades. Some of the low rainfall areas less than 300 millmetres have had some very difficult times with droughts year on year eroding equity and only recent rain events have given them some hope for the future. The medium rainfall areas have also suffered from drought conditions and yields have been down. Recent years have seen this area produce good results and market activity has increased dramatically. The high rainfall areas especially along the south coast have performed very well over the past decade and this has been reflected in the increase in land values across these areas. I would definitely consider an investment in this area but would have to be on a lessor basis due to the high setup cost with machinery and infrastructure. I would look at the medium rainfall area where you get more land for your dollar and also is considered to be where operators are looking to expand but do not have the capital so renting land is their best option. The coastal land is relatively expensive and most operations require expertise for growing specific crops or for more intensive operations. It is my opinion that with beef and lamb prices being relatively high, pork and chicken will become more dominant in the Western Australian diet and therefore I would definitely consider an investment in either the pig or poultry industry if available. These industries are very small at the moment in relative terms and the potential for a new entrant to make their mark is risky but potentially very lucrative. I would make this investment on a partnership basis with me supplying the infrastructure and animals and a partner providing the expertise. Therefore my investment model would involve three regions and three industries. Two would be on a partnership basis where the initial quantum investment could be lower and I could use anothers expertise to gain a return. It is difficult to estimate a return on this basis without the exact investment model however I would be looking for 10% to 15% on my share given the higher risk of being involved in the operational side. For the wheat and sheep property I would be looking for a more modest return of 4% to 5% on a three to five year tenancy basis and also expect some capital growth as the market recovers from the years of drought. Month in Review June 2016 Rural
  • 71.
  • 72.
    72 Disclaimer This publication presentsa generalised overview regarding the state of Australian property markets, using property market risk-ranking scales. It is not a guide to individual property assessments and should not be relied upon. Herron Todd White accepts no responsibility for any reliance placed on the commentary and generalised information. Contact Herron Todd White to obtain formal, specific property advice on any matters of interest arising from this publication. National Property Clock June 2016 Office Entries coloured purple indicate positional change from last month. Liability limited by a scheme approved under Professional Standards Legislation. This scheme does not apply within Tasmania. This report is not intended to be comprehensive or render advice and neither Herron Todd White nor any persons involved in the preparation of this report, accepts any form of liability for its contents. Peak of Market Approaching Peak of Market Rising Market Start of Recovery Bottom of Market Starting to decline Declining Market Approaching Bottom of Market Bendigo Darwin Alice Springs Emerald Gippsland Mackay Orange Brisbane Adelaide Perth Adelaide Hills Barossa Valley Gladstone Rockhampton Iron Triangle Hobart Burnie/Devenport Cairns Launceston South West WA Townsville Wagga Wagga Wide Bay Canberra Albury NSW Central Coast Griffith Horsham NSW Mid North Coast Mildura Newcastle South East NSW Sunshine Coast Tamworth Wodonga Sydney Ballarat Bathurst Coffs Harbour Dubbo Echuca NSW Far North Coast Gold Coast Mudgee Toowoomba Melbourne National Property Clock June 2016 Houses Entries coloured orange indicate positional change from last month. Liability limited by a scheme approved under Professional Standards Legislation. This scheme does not apply within Tasmania. This report is not intended to be comprehensive or render advice and neither Herron Todd White nor any persons involved in the preparation of this report, accepts any form of liability for its contents. Peak of Market Approaching Peak of Market Rising Market Start of Recovery Bottom of Market Starting to decline Declining Market Approaching Bottom of Market Melbourne NSW Central Coast Dubbo Newcastle Sydney South West WA Toowoomba Perth Alice Springs Darwin Emerald Gladstone Mackay Rockhampton Bundaberg Townsville Brisbane Hobart Burnie/Devenport Gippsland Hervey Bay Launceston Mildura Mount Gambier Warrnambool Whitsunday Adelaide Canberra Adelaide Hills Albury Barossa Valley Bathurst Bendigo Cairns Coffs Harbour NSW Far North Coast Griffith Iron Triangle Mudgee Orange Shepparton Sunshine Coast Tamworth Wagga Wagga Ballarat Echuca Gold Coast Horsham Ipswich NSW Mid North Coast South East NSW Peak of Market Approaching Peak of Market Rising Market Start of Recovery Bottom of Market Starting to decline Declining Market Approaching Bottom of Market National Property Clock June 2016 Units Entries coloured blue indicate positional change from last month. Liability limited by a scheme approved under Professional Standards Legislation. This scheme does not apply within Tasmania. This report is not intended to be comprehensive or render advice and neither Herron Todd White nor any persons involved in the preparation of this report, accepts any form of liability for its contents. Melbourne Dubbo Gold Coast Newcastle Sydney Brisbane Ballarat South West WA Toowoomba Perth Alice Springs Gladstone Mackay Darwin Emerald Rockhampton Whitsunday Canberra Bundaberg Townsville Warrnambool Adelaide Hobart Adelaide Hills Albury Barossa Valley Burnie/Devenport Cairns Gippsland Hervey Bay Iron Triangle Launceston Mildura Mount Gambier Shepparton Bathurst Bendigo Coffs Harbour Echuca NSW Far North Coast Griffith Mudgee Orange Sunshine Coast Tamworth Wagga Wagga NSW Central Coast Horsham Ipswich NSW Mid North Coast South East NSW
  • 73.
    © Herron ToddWhite Copyright 2016 Market Indicators 73 1 Capital City Property Market Indicators – Houses Month in Review June 2016 Capital City Property Market Indicators – Houses Factor Sydney Melbourne Brisbane Adelaide Perth Hobart Darwin Canberra Rental Vacancy Situation Balanced market Balanced market Balanced market Balanced market Over-supply of available property relative to demand Balanced market Over-supply of available property relative to demand Balanced market Rental Vacancy Trend Steady Steady Increasing Steady Increasing Steady Increasing Steady Demand for New Houses Fair Fair Fair Fair Soft Fair Soft Strong Trend in New House Construction Steady Declining - Steady Increasing strongly Increasing Declining Declining Declining Steady Volume of House Sales Declining Steady - Declining Steady Steady Declining Steady Declining significantly Steady Stage of Property Cycle Starting to decline Peak of market Start of recovery Rising market Declining market Start of recovery Approaching bottom of market Rising market Are New Properties Sold at Prices Exceeding Their Potential Resale Value Occasionally Occasionally Occasionally Occasionally Almost never Almost never Occasionally Occasionally Red entries indicate change from previous month to a higher risk-rating Blue entries indicate change from previous month to a lower risk-rating
  • 74.
    © Herron ToddWhite Copyright 2016 Market Indicators 74 1 Capital City Property Market Indicators – Units Month in Review June 2016 Capital City Property Market Indicators – Units Factor Sydney Melbourne Brisbane Adelaide Perth Hobart Darwin Canberra Rental Vacancy Situation Balanced market Balanced market Balanced market Balanced market Over-supply of available property relative to demand Balanced market Over-supply of available property relative to demand Balanced market Rental Vacancy Trend Steady Steady Increasing Steady Increasing Steady Increasing Steady Demand for New Units Fair Fair Fair Fair Soft Fair Soft Strong Trend in New Unit Construction Steady Declining - Steady Increasing strongly Increasing Declining Declining Declining Steady Volume of Unit Sales Declining Steady - Declining Steady Steady Declining Steady Declining significantly Steady Stage of Property Cycle Starting to decline Peak of market Start of recovery Rising market Declining market Start of recovery Approaching bottom of market Rising market Are New Properties Sold at Prices Exceeding Their Potential Resale Value Occasionally Occasionally Occasionally Occasionally Almost never Almost never Occasionally Occasionally Red entries indicate change from previous month to a higher risk-rating Blue entries indicate change from previous month to a lower risk-rating
  • 75.
    © Herron ToddWhite Copyright 2016 Market Indicators 75 1 1 Capital City Property Market Indicators – Office Month in Review June 2016 Capital City Property Market Indicators – Office Factor Sydney Melbourne Brisbane Adelaide Perth Hobart Darwin Canberra Rental Vacancy Situation Balanced market Over-supply of available property relative to demand Large over-supply of available property relative to demand Over-supply of available property relative to demand Large over-supply of available property relative to demand Over-supply of available property relative to demand Large over-supply of available property relative to demand Large over-supply of available property relative to demand Rental Vacancy Trend Tightening Tightening - Steady Increasing Increasing Increasing Steady Increasing Steady Rental Rate Trend Stable - Increasing Stable Declining Declining - Stable Declining Declining Declining Stable Volume of Property Sales Increasing - Steady Declining Declining Steady Declining Steady Steady Steady Stage of Property Cycle Rising market Approaching peak of market Approaching bottom of market Approaching bottom of market Approaching bottom of market Bottom of market Declining market Start of recovery Local Economic Situation Flat Steady growth - Flat Steady growth Flat - Contraction Contraction Flat Contraction Flat Value Difference between Quality Properties with National Tenants, and Comparable Properties with Local Tenants Small Significant Small Large Large Significant Large Significant Red entries indicate change from 3 months ago to a higher risk-rating Blue entries indicate change from 3 months ago to a lower risk-rating
  • 76.
    © Herron ToddWhite Copyright 2016 Market Indicators 76 1 East Coast New South Wales Property Market Indicators – Houses Month in Review June 2016 East Coast New South Wales Property Market Indicators – Houses Factor Canberra Central Coast Coffs Harbour Far North NSW Mid North Coast Newcastle South East NSW Sydney Rental Vacancy Situation Balanced market Balanced market Balanced market Balanced market Shortage of available property relative to demand Balanced market Balanced market Balanced market Rental Vacancy Trend Steady Steady Steady Steady Steady Steady Tightening - Steady Steady Demand for New Houses Strong Fair - Strong Strong Fair - Strong Strong Fair Fair - Strong Fair Trend in New House Construction Steady Steady Increasing Declining - Steady Steady Declining Steady - Increasing Steady Volume of House Sales Steady Steady Steady Steady - Declining Steady Steady Steady Declining Stage of Property Cycle Rising market Peak of market Rising market Rising market Approaching peak of market Peak of market Approaching peak of market Starting to decline Are New Properties Sold at Prices Exceeding Their Potential Resale Value Occasionally Occasionally Almost never Frequently Occasionally Occasionally Occasionally - Frequently Occasionally Red entries indicate change from previous month to a higher risk-rating Blue entries indicate change from previous month to a lower risk-rating
  • 77.
    © Herron ToddWhite Copyright 2016 Market Indicators 77 1 Country New South Wales Property Market Indicators – Houses Month in Review June 2016 Country New South Wales Property Market Indicators – Houses Factor Albury Bathurst Dubbo Griffith Mudgee Orange Tamworth Wagga Wagga Rental Vacancy Situation Balanced market Balanced market Balanced market Shortage of available property relative to demand Severe shortage of available property relative to demand Balanced market Balanced market Balanced market Rental Vacancy Trend Steady Tightening Steady Steady Tightening Tightening Increasing Increasing Demand for New Houses Fair Strong Strong Strong Strong Strong Strong Strong Trend in New House Construction Steady Steady Increasing Steady Increasing Steady Increasing Steady Volume of House Sales Steady Increasing Steady Increasing Steady Increasing Steady Steady Stage of Property Cycle Rising market Rising market Peak of market Rising market Rising market Rising market Rising market Rising market Are New Properties Sold at Prices Exceeding Their Potential Resale Value Occasionally Occasionally Occasionally Occasionally Occasionally Occasionally Occasionally Occasionally Red entries indicate change from previous month to a higher risk-rating Blue entries indicate change from previous month to a lower risk-rating
  • 78.
    © Herron ToddWhite Copyright 2016 Market Indicators 78 1 East Coast New South Wales Property Market Indicators – Units Month in Review June 2016 East Coast New South Wales Property Market Indicators - Units Factor Canberra Central Coast Coffs Harbour Far North NSW Mid North Coast Newcastle South East NSW Sydney Rental Vacancy Situation Over-supply of available property relative to demand Shortage of available property relative to demand Balanced market Balanced market Shortage of available property relative to demand Balanced market Balanced market Balanced market Rental Vacancy Trend Steady Steady Steady Steady Steady Steady Tightening - Steady Increasing Demand for New Units Fair Strong - Very strong Strong Fair - Strong Strong Fair Fair Fair Trend in New Unit Construction Increasing Declining - Steady Increasing Declining - Steady Steady Declining Steady Steady Volume of Unit Sales Steady Increasing Steady Steady - Declining Steady Steady Steady Declining Stage of Property Cycle Bottom of market Approaching peak of market Rising market Rising market Approaching peak of market Peak of market Approaching peak of market Starting to decline Are New Properties Sold at Prices Exceeding Their Potential Resale Value Frequently Occasionally Occasionally Frequently Almost never Occasionally Occasionally - Frequently Occasionally Red entries indicate change from previous month to a higher risk-rating Blue entries indicate change from previous month to a lower risk-rating
  • 79.
    © Herron ToddWhite Copyright 2016 Market Indicators 79 1 Country New South Wales Property Market Indicators – Units Month in Review June 2016 Country New South Wales Property Market Indicators - Units Factor Albury Bathurst Dubbo Griffith Mudgee Orange Tamworth Wagga Wagga Rental Vacancy Situation Balanced market Balanced market Balanced market Shortage of available property relative to demand Severe shortage of available property relative to demand Balanced market Balanced market Balanced market Rental Vacancy Trend Steady Tightening Steady Steady Tightening Tightening Steady Steady Demand for New Units Soft Strong Strong Strong Strong Strong Fair Fair Trend in New Unit Construction Steady Steady Increasing Increasing Increasing Steady Steady Steady Volume of Unit Sales Steady Increasing Steady Increasing Steady Increasing Steady Steady Stage of Property Cycle Start of recovery Rising market Peak of market Rising market Rising market Rising market Rising market Rising market Are New Properties Sold at Prices Exceeding Their Potential Resale Value Occasionally Occasionally Occasionally Occasionally Occasionally Occasionally Occasionally Occasionally Red entries indicate change from previous month to a higher risk-rating Blue entries indicate change from previous month to a lower risk-rating
  • 80.
    © Herron ToddWhite Copyright 2016 Market Indicators 80 1 East Coast New South Wales Property Market Indicators – Office Month in Review June 2016 East Coast New South Wales Property Market Indicators – Office Factor Canberra/ Q’beyan Central Coast Coffs Harbour Far North NSW Mid North Coast Newcastle South East NSW Sydney Rental Vacancy Situation Large over-supply of available property relative to demand Balanced market Over-supply of available property relative to demand Over-supply of available property relative to demand Balanced market Shortage of available property relative to demand Balanced market - Over-supply of available property relative to demand Balanced market Rental Vacancy Trend Steady Tightening Tightening Increasing Steady Steady Steady Tightening Rental Rate Trend Stable Stable Stable Stable Stable Stable Stable Stable - Increasing Volume of Property Sales Steady Increasing Steady Steady Steady Increasing Increasing Increasing - Steady Stage of Property Cycle Start of recovery Start of recovery Rising market Rising market Start of recovery Start of recovery Start of recovery Rising market Local Economic Situation Flat Steady growth Flat Flat Flat Steady growth Flat Flat Value Difference between Quality Properties with National Tenants, and Comparable Properties with Local Tenants Significant Significant Significant - Large Significant - Large Small Large Significant - Large Small Red entries indicate change from 3 months ago to a higher risk-rating Blue entries indicate change from 3 months ago to a lower risk-rating
  • 81.
    © Herron ToddWhite Copyright 2016 Market Indicators 81 1 Country New South Wales Property Market Indicators – Office Month in Review June 2016 Country New South Wales Property Market Indicators – Office Factor Albury Bathurst Dubbo Griffith Mudgee Orange Tamworth Wagga Wagga Rental Vacancy Situation Over-supply of available property relative to demand Balanced market Balanced market Over-supply of available property relative to demand Balanced market Balanced market Over-supply of available property relative to demand Over-supply of available property relative to demand Rental Vacancy Trend Steady Steady Steady Steady Steady Steady Steady Steady Rental Rate Trend Stable Stable Stable Stable Stable Stable Declining Declining Volume of Property Sales Steady Steady Steady Steady Steady Steady Steady Steady Stage of Property Cycle Start of recovery Rising market Rising market Start of recovery Rising market Declining market Start of recovery Bottom of market Local Economic Situation Flat Flat Flat Flat Flat Contraction Steady growth Flat Value Difference between Quality Properties with National Tenants, and Comparable Properties with Local Tenants Significant Small - Significant Significant Significant Significant Small - Significant Significant Significant Red entries indicate change from 3 months ago to a higher risk-rating Blue entries indicate change from 3 months ago to a lower risk-rating
  • 82.
    © Herron ToddWhite Copyright 2016 Market Indicators 82 1 Victoria/Tasmania Property Market Indicators – Houses Month in Review June 2016 Victorian and Tasmanian Property Market Indicators – Houses Factor Ballarat Bendigo Echuca Gippslan d Horsham Melbourne Mildura Shepparto n Warrnambo ol Burnie/ Devonport Hobart Launcesto n Rental Vacancy Situation Balanced market Over-supply of available property relative to demand Shortage of available property relative to demand Balanced market Balanced market Balanced market Balanced market Balanced market Balanced market Balanced market Balanced market Balanced market Rental Vacancy Trend Steady Steady Steady Steady Steady Steady Steady Steady Steady Steady Steady Steady Demand for New Houses Fair Fair Fair Fair Strong Fair Fair Fair Strong Fair Fair Fair Trend in New House Construction Steady Steady Steady Declining Steady Declining - Steady Steady Steady Steady Declining Declining Declining Volume of House Sales Steady Steady Steady Increasing Declining Steady - Declining Steady Steady Steady Steady Steady Steady Stage of Property Cycle Approaching peak of market Rising market Approaching peak of market Start of recovery Approaching peak of market Peak of market Start of recovery Rising market Start of recovery Start of recovery Start of recovery Start of recovery Are New Properties Sold at Prices Exceeding Their Potential Resale Value Almost never Frequently Occasionally Occasion- ally Occasionally Occasionally Almost never Occasionally Occasionally Almost never Almost never Almost never Red entries indicate change from previous month to a higher risk-rating Blue entries indicate change from previous month to a lower risk-rating
  • 83.
    © Herron ToddWhite Copyright 2016 Market Indicators 83 1 Victoria/Tasmania Property Market Indicators – Units Month in Review June 2016 Victorian and Tasmanian Property Market Indicators – Units Factor Ballarat Bendigo Echuca Gippslan d Horsham Melbourne Mildura Shepparto n Warrnambo ol Burnie/ Devonport Hobart Launcesto n Rental Vacancy Situation Balanced market Over-supply of available property relative to demand Shortage of available property relative to demand Balanced market Balanced market Balanced market Balanced market Balanced market Balanced market Balanced market Balanced market Balanced market Rental Vacancy Trend Steady Steady Steady Steady Steady Steady Steady Steady Steady Steady Steady Steady Demand for New Houses Fair Fair Fair Fair Strong Fair Fair Fair Strong Fair Fair Fair Trend in New House Construction Steady Steady Steady Declining Steady Declining - Steady Steady Steady Steady Declining Declining Declining Volume of House Sales Steady Steady Steady Increasing Declining Steady - Declining Steady Steady Steady Steady Steady Steady Stage of Property Cycle Approaching peak of market Rising market Approaching peak of market Start of recovery Approaching peak of market Peak of market Start of recovery Rising market Start of recovery Start of recovery Start of recovery Start of recovery Are New Properties Sold at Prices Exceeding Their Potential Resale Value Almost never Frequently Occasionally Occasion- ally Occasionally Occasionally Almost never Occasionally Occasionally Almost never Almost never Almost never Red entries indicate change from previous month to a higher risk-rating Blue entries indicate change from previous month to a lower risk-rating
  • 84.
    © Herron ToddWhite Copyright 2016 Market Indicators 84 1 Victoria/Tasmania Property Market Indicators – Office Month in Review June 2016 Victorian and Tasmanian Property Market Indicators – Office Factor Ballarat Bendigo Echuca Gippsland Melbourne Mildura Wodonga Burnie/ Devonport Hobart Launceston Rental Vacancy Situation Shortage of available property relative to demand Balanced market Balanced market Over-supply of available property relative to demand Balanced market Over-supply of available property relative to demand Balanced market Over-supply of available property relative to demand Over-supply of available property relative to demand Over-supply of available property relative to demand Rental Vacancy Trend Tightening Tightening Steady Steady Steady Tightening - Steady Steady Steady Steady Steady Rental Rate Trend Increasing Stable Stable Stable Stable Stable Stable Stable Declining Declining Volume of Property Sales Steady Increasing Steady Declining Steady Declining Steady Steady Steady Steady Stage of Property Cycle Rising market Starting to decline Rising market Declining market Start of recovery Approaching peak of market Start of recovery Start of recovery Bottom of market Bottom of market Local Economic Situation Steady growth Steady growth Flat Flat Flat Steady growth - Flat Flat Flat Flat Flat Value Difference between Quality Properties with National Tenants, and Comparable Properties with Local Tenants Significant Significant Significant Small Significant Significant Significant Significant Significant Significant Red entries indicate change from 3 months ago to a higher risk-rating Blue entries indicate change from 3 months ago to a lower risk-rating
  • 85.
    © Herron ToddWhite Copyright 2016 Market Indicators 85 1 Queensland Property Market Indicators – Houses Month in Review June 2016 Queensland Property Market Indicators – Houses Factor Cairns Towns- ville Whit- sunday Mackay Rock- hampton Emerald Glad- stone Bundaberg Hervey Bay Sunshine Coast Brisbane Ipswich Gold Coast Toowoomba Rental Vacancy Situation Shortage of available property relative to demand Over-supply of available property relative to demand Balanced market Balanced market - Over- supply of available property relative to demand Over-supply of available property relative to demand Over-supply of available property relative to demand Over-supply of available property relative to demand Over-supply of available property relative to demand Balanced market Shortage of available property relative to demand Balanced market Balanced market Shortage of available property relative to demand Balanced market Rental Vacancy Trend Steady Increasing Steady Steady Increasing Steady Increasing Steady Steady Steady Increasing Steady Steady Steady - Increasing Demand for New Houses Fair Soft Fair Soft Soft Very soft Soft Fair Fair - Strong Strong Fair Fair Fair Fair Trend in New House Construction Steady Declining Steady Declining - Steady Declining Declining significantly Declining Steady Increasin g Increasing Increasing strongly Increasin g Steady Steady Volume of House Sales Steady Steady Steady Steady Declining Steady Steady Steady Increasin g Increasing Steady Declining Steady Steady - Declining Stage of Property Cycle Rising market Bottom of market Start of recovery Approachi ng bottom of market Approaching bottom of market Approachin g bottom of market Approachin g bottom of market Bottom of market Start of recovery Rising market Start of recovery Approachi ng peak of market Approachin g peak of market Starting to decline Are New Properties Sold at Prices Exceeding Their Potential Resale Value Almost never Almost never Almost never Occasion- ally Occasionally Occasion- ally Occasion- ally Frequently Occasion- ally Occasion- ally Occasion- ally Occasion- ally Occasion- ally Frequently Red entries indicate change from previous month to a higher risk-rating Blue entries indicate change from previous month to a lower risk-rating
  • 86.
    © Herron ToddWhite Copyright 2016 Market Indicators 86 1 Queensland Property Market Indicators – Units Month in Review June 2016 Queensland Property Market Indicators - Units Factor Cairns Towns- ville Whit- sunday Mackay Rock- hampton Emerald Glad- stone Bundaberg Hervey Bay Sunshine Coast Brisban e Ipswich Gold Coast Toowoomba Rental Vacancy Situation Shortage of available property relative to demand Large over- supply of available property relative to demand Over-supply of available property relative to demand Over- supply of available property relative to demand Balanced market Over-supply of available property relative to demand Large over- supply of available property relative to demand Balanced market Balanced market Balanced market Over- supply of available property relative to demand Balanced market Balanced market Over-supply of available property relative to demand Rental Vacancy Trend Steady Increasing Steady Steady - Increasin g Increasing Steady Increasing Steady Steady Steady Increasing Increasin g Steady Increasing Demand for New Units Soft Soft Soft Soft Soft Very soft Soft Fair Fair - Strong Fair Soft Fair Soft Soft - Fair Trend in New Unit Construction Steady Declining Increasing Declining - Steady Steady Declining significantly Declining Steady Steady Increasing Declining Increasin g Increasing Steady Volume of Unit Sales Steady Steady Declining Declining Declining Declining Steady Steady Increasing - Steady Increasing Declining Steady Steady Steady - Declining Stage of Property Cycle Start of recovery Bottom of market Approaching bottom of market Declining market Approaching bottom of market Approachin g bottom of market Declining market Bottom of market Start of recovery Rising market Starting to decline Approachi ng peak of market Peak of market Starting to decline Are New Properties Sold at Prices Exceeding Their Potential Resale Value Almost never Almost never Almost never Occasion- ally Almost never Occasion- ally Occasion- ally Frequently Occasion- ally Occasion- ally Occasion- ally Occasion- ally Frequently Frequently Red entries indicate change from previous month to a higher risk-rating Blue entries indicate change from previous month to a lower risk-rating
  • 87.
    © Herron ToddWhite Copyright 2016 Market Indicators 87 1 Queensland Property Market Indicators – Office Month in Review June 2016 Queensland Property Market Indicators – Office Factor Cairns Townsville Mackay Rockhampton Gladstone Wide Bay Emerald Sunshine Coast Brisbane Gold Coast Toowoomba Rental Vacancy Situation Over-supply of available property relative to demand Over-supply of available property relative to demand Over-supply of available property relative to demand - Large over- supply of available property relative to demand Balanced market Over-supply of available property relative to demand Balanced market Over-supply of available property relative to demand Balanced market - Over- supply of available property relative to demand Large over- supply of available property relative to demand Over-supply of available property relative to demand Balanced market Rental Vacancy Trend Steady Steady Steady Steady Steady Steady Increasing Tightening - Steady Increasing Tightening Steady Rental Rate Trend Declining - Stable Declining Declining Stable Declining - Stable Stable Declining Stable Declining Stable - Increasing Stable Volume of Property Sales Steady Steady Steady Steady Steady Steady Declining Increasing - Steady Declining Increasing Steady Stage of Property Cycle Bottom of market Bottom of market Declining market Approaching bottom of market Approaching bottom of market Bottom of market Declining market Start of recovery Approaching bottom of market Rising market Rising market Local Economic Situation Steady growth - Flat Contraction Contraction Flat Flat - Contraction Flat Contraction Steady growth Steady growth Steady growth - Flat Flat - Contraction Value Difference between Quality Properties with National Tenants, and Comparable Properties with Local Tenants Small Small - Significant Significant Small Small Significant Small Small - Significant Small Significant Small - Significant Red entries indicate change from 3 months ago to a higher risk-rating Blue entries indicate change from 3 months ago to a lower risk-rating
  • 88.
    © Herron ToddWhite Copyright 2016 Market Indicators 88 1 Northern Territory, South Australia & Western Australia Property Market Indicators – Houses Month in Review June 2016 SA, NT and WA Property Market Indicators - Houses Factor Adelaide Adelaide Hills Barossa Valley Iron Triangle Mount Gambier Riverland Alice Springs Darwin Perth South West WA Rental Vacancy Situation Balanced market Balanced market Balanced market Balanced market Balanced market Shortage of available property relative to demand Over-supply of available property relative to demand Over-supply of available property relative to demand Over-supply of available property relative to demand Balanced market Rental Vacancy Trend Steady Steady Steady Steady Steady Steady Steady Increasing Increasing Steady Demand for New Houses Fair Fair Fair Fair Fair Fair Fair Soft Soft Soft Trend in New House Construction Increasing Increasing Increasing Increasing Steady Steady Steady Declining Declining Steady Volume of House Sales Steady Steady Steady Steady Steady Steady Declining Declining significantly Declining Declining Stage of Property Cycle Rising market Rising market Rising market Rising market Start of recovery Stable Declining market Approaching bottom of market Declining market Starting to decline Are New Properties Sold at Prices Exceeding Their Potential Resale Value Occasionally Occasionally Occasionally Occasionally Occasionally Occasionally Almost never Occasionally Almost never Almost never Red entries indicate change from 3 months ago to a higher risk-rating Blue entries indicate change from 3 months ago to a lower risk-rating
  • 89.
    © Herron ToddWhite Copyright 2016 Market Indicators 89 1 Northern Territory, South Australia & Western Australia Property Market Indicators – Units Month in Review June 2016 SA, NT and WA Property Market Indicators – Units Factor Adelaide Adelaide Hills Barossa Valley Iron Triangle Mount Gambier Riverland Alice Springs Darwin Perth South West WA Rental Vacancy Situation Balanced market Balanced market Balanced market Balanced market Balanced market Shortage of available property relative to demand Over-supply of available property relative to demand Over-supply of available property relative to demand Over-supply of available property relative to demand Balanced market Rental Vacancy Trend Steady Steady Steady Steady Steady Steady Steady Increasing Increasing Steady Demand for New Units Fair Fair Fair Fair Soft Soft Fair Soft Soft Soft Trend in New Unit Construction Increasing Increasing Increasing Increasing Steady Declining Steady Declining significantly Declining Steady Volume of Unit Sales Steady Steady Steady Steady Steady Steady Declining Declining significantly Declining Declining Stage of Property Cycle Start of recovery Start of recovery Start of recovery Start of recovery Start of recovery Stable Declining market Approaching bottom of market Declining market Starting to decline Are New Properties Sold at Prices Exceeding Their Potential Resale Value Almost never Almost never Almost never Almost never Occasionally Almost never Almost never Occasionally Almost never Almost never Red entries indicate change from 3 months ago to a higher risk-rating Blue entries indicate change from 3 months ago to a lower risk-rating
  • 90.
    © Herron ToddWhite Copyright 2016 Market Indicators 90 1 Northern Territory, South Australia & Western Australia Property Market Indicators – Office Month in Review June 2016 SA, NT and WA Property Market Indicators – Office Factor Adelaide Adelaide Hills Barossa Valley Iron Triangle Riverland Alice Springs Darwin Perth South West WA Rental Vacancy Situation Over-supply of available property relative to demand Over-supply of available property relative to demand Over-supply of available property relative to demand Over-supply of available property relative to demand Over-supply of available property relative to demand Over-supply of available property relative to demand Large over- supply of available property relative to demand Large over-supply of available property relative to demand Over-supply of available property relative to demand Rental Vacancy Trend Increasing Increasing Increasing Increasing Steady Increasing Increasing Increasing Increasing Rental Rate Trend Declining - Stable Declining - Stable Declining - Stable Declining - Stable Stable Declining Declining Declining Declining Volume of Property Sales Steady Steady Steady Steady Steady Steady Steady Declining Declining Stage of Property Cycle Approaching bottom of market Approaching bottom of market Approaching bottom of market Approaching bottom of market Stable Declining market Declining market Approaching bottom of market Bottom of market Local Economic Situation Flat - Contraction Flat - Contraction Flat - Contraction Flat - Contraction Flat Contraction Contraction Contraction Flat Value Difference between Quality Properties with National Tenants, and Comparable Properties with Local Tenants Large Large Large Large Significant Small Large Large Small Red entries indicate change from 3 months ago to a higher risk-rating Blue entries indicate change from 3 months ago to a lower risk-rating
  • 91.
    Telephone 1300 880489 admin@htw.com.au htw.com.au Local expertise. National strength. Trusted solutions. Herron Todd White is Australia’s leading independent property valuation and advisory group. For more than 45 years, we’ve helped our customers make the most of their property assets by providing sound valuations and insightful analytical advice. With offices in every capital city, most regional centres, and right across rural Australia, we are where you are. Our valuers work in the property market everyday, providing professional services for all classes of property including commercial, industrial, retail, rural and residential. Herron Todd White is Australian owned and operated. With directors who are owners in the business, our team has a personal stake in providing you with the best service possible. Liabilitylimitedaschemeapprovedunder ProfessionalStandardsLegislation.This schemedoesnotapplywithinTasmania.