SlideShare a Scribd company logo
Length of Stay Outlier Detection through Cluster
Analysis: A Case Study in Pediatrics
Daniel Gartnera
, Rema Padmanb
a
School of Mathematics, Cardiff University, United Kingdom
b
The H. John Heinz III College, Carnegie Mellon University, Pittsburgh, USA
Abstract
The increasing availability of detailed inpatient data is enabling the develop-
ment of data-driven approaches to provide novel insights for the management
of Length of Stay (LOS), an important quality metric in hospitals. This study
examines clustering of inpatients using clinical and demographic attributes to
identify LOS outliers and investigates the opportunity to reduce their LOS
by comparing their order sequences with similar non-outliers in the same
cluster. Learning from retrospective data on 353 pediatric inpatients admit-
ted for appendectomy, we develop a two-stage procedure that first identifies a
typical cluster with LOS outliers. Our second stage analysis compares orders
pairwise to determine candidates for switching to make LOS outliers simi-
lar to non-outliers. Results indicate that switching orders in homogeneous
inpatient sub-populations within the limits of clinical guidelines may be a
promising decision support strategy for LOS management.
Keywords: Machine Learning; Clustering; Health Care; Length of Stay
Email addresses: gartnerd@cardiff.ac.uk (Daniel Gartner), rpadman@cmu.edu
(Rema Padman)
1. Introduction
Length of Stay (LOS) is an important quality metric in hospitals that has
been studied for decades Kim and Soeken (2005); Tu et al. (1995). However,
the increasing digitization of healthcare with Electronic Health Records and
other clinical information systems is enabling the collection and analysis of
vast amounts of data using advanced data-driven methods that may be par-
ticularly valuable for LOS management Gartner (2015); Saria et al. (2010).
When patients are treated in hospitals, information about each individual is
necessary to perform optimal treatment and scheduling decisions, with the
detailed data being documented in the current generation of information sys-
tems. Recent research has highlighted that resource allocation decisions can
be improved by scheduling patient admissions, treatments and discharges at
the right time Gartner and Kolisch (2014); Hosseinifard et al. (2014) while
machine learning methods can improve resource allocation decisions and the
accuracy of hospital-wide predictive analytics tasks Gartner et al. (2015a).
Thus, using data-driven analytic methods to understand length of stay (LOS)
variations and exploring opportunities for reducing LOS with a specific focus
on LOS outliers is the goal of this study.
Using retrospective data on 353 inpatients treated for appendectomy at a
major pediatric hospital, we first carry out a descriptive data analysis and
test which (theoretical) probability distribution best fits our length of stay
data. The results reveal that our data matches observations from the lit-
erature. In a first stage cluster analysis, we identify one potential outlier
cluster while a descriptive analysis using box plot comparisons of this cluster
vs. the union of patients assigned to all other clusters supports this hypothe-
sis. In a second clustering stage, we analyse the patient sub-population who
belongs to that outlier cluster and provide order prescription behaviour in-
sights. More specifically, on a pairwise comparison, we describe which orders
are likely to be selected in the outlier population vs. ones that are deselected
in the non-outlier population and vice versa. Our findings reveal that four
order items are not prescribed in the outlier population while in the non-
outlier sub-population, these orders were prescribed. On the other hand,
51 orders were prescribed for the outlier patients which are not enabled in
the non-outlier population. These novel data-driven insights can be offered
as suggestions for clinicians to apply new evidence-based, clinical guideline-
compliant opportunities for LOS reduction through healthcare analytics.
2. Related Work
Clustering algorithms and other machine learning approaches are discussed in
Baesens et al. (2009); Jain (2010); Meisel and Mattfeld (2010); Olafsson et al.
(2008) including an overview of operations research (OR) techniques applied
to data mining. Mathematical programming and heuristics for clustering
clinical activities in Healthcare Information Systems has been applied in
Gartner et al. (2015b) while the identification of similar LOS groups has
been studied by El-Darzi et al. (2009). Similar to our problem, the authors
study the application of approaches to cluster patient records with similar de-
mographic and clinical conditions. Using a stroke dataset, they compare the
performance of Gaussian Mixture Models, k-means clustering and a two-step
clustering algorithm. Determining cluster centers for patients in the Emer-
gency Department (ED) is studied by Ashour and Okudan Kremer (2014).
Having defined similar patient clusters, they study the improvement on pa-
tient routing decisions based on the clusters. Similarly, Xu et al. (2014)
focuses their clustering problem on the ED. Their objective is to cluster pa-
tients to resource consumption classes determined by length of treatment
while patient demographics are taken into consideration.
The approaches proposed in our paper can be categorized and differentiated
from the literature of clustering in length of stay management as follows:
Using a descriptive data analysis we provide an overview about the charac-
teristics of our length of stay data. Fitting several distribution types and pa-
rameters of the theoretical probability distribution, we underline the skewed
property of the probability distribution from our data. In a next step, we
define homogeneous patient groups with respect to demographic, clinical at-
tributes and length of stay outliers. Having learned homogeneous groups
of inpatients, we evaluate patient orders within the group that potentially
contains length of stay outliers and may be responsible for increasing LOS in
that group. In conclusion, this study may be considered to be the first to link
the discovery of similar clinical and demographic attributes in appendectomy
inpatients while, within length of stay outlier clusters, we evaluate possibil-
ities for switching of orders and how they potentially reduce the number of
LOS outliers.
3. Methods
Let P denote a set of individuals (hospital inpatients) and let K denote the set
of clusters to which these individuals can be grouped. For each inpatient p ∈
P, we observe a set of attributes A during the patient’s LOS. Let Va denote
the set of possible values for attribute a ∈ A and let vp,a ∈ Va denote the
value of attribute a for inpatient p. In the following, we will describe how we
label patients as LOS outliers, followed by a two-stage clustering approach:
The first stage assigns patients’ attributes to homogeneous clusters while
clusters with high likelihood to contain LOS outliers can be identified. In a
second stage, we filter patients assigned to these clusters and evaluate which
patient orders may be switched to reduce length of stay in the LOS outlier
patient sub-population. The section closes with an illustrative example.
Given the observed LOS of patient p ∈ P, denoted by lp, the 25 and 75 per-
centile of the LOS distribution denoted by q25
and q75
, respectively then we
assign a patient the flag “outlier” using the following expression (Pirson et al.
(2006)):
op =

1,
0,
if lp  q75
+ (1.5 · (q75
− q25
))
otherwise
. (1)
Now, let Adem
denote the set of binary demographic attributes and let
va,p ∈ {0, 1} denote the attribute value of demographic attribute a ∈ Adem
of patient p ∈ P. Let K := {1, 2, . . . , K} be a set of integers with maximum
K which will be used for cluster indexing. Our objective is to find cluster
centers of patient attributes in order to minimize deviations of each patient’s
attribute values with the ones of the cluster centres. One algorithm that min-
imizes this objective is the k-means clustering algorithm Jain (2010). The
algorithm is a method of vector quantization. It seeks to partition observa-
tions into clusters in which each observation belongs to the cluster with the
nearest mean which serves as a prototype of the cluster.
Once we have found patients with similar clinical, demographic and LOS
characteristics, we wish to separate patients within the cluster that has the
highest likelihood to contain LOS outliers. In this stage, we extract patients
with these attributes and evaluate the order prescription behaviour for these
patients between outliers and the false positively clustered outliers which ac-
tually belong to the group of non-outliers. Orders prescribed by clinicians to
patients are, for example, the application of drugs, examinations and ther-
apies. Having determined patients with high likelihood of belonging to the
group of outliers, we introduce a set Ao, off → on
k for cluster k ∈ K which allows
experts to evaluate orders which were switched off for outlier patients and
were switched on for non-outlieres. The set is determined by Ao, off → on
k :=
{a ∈ Aorder
|va,p∗(p) − va,p = 1 ∀k ∈ K, p ∈ Pout
k }. Similarly, we introduce
the set Ao, on → off
k := {a ∈ Aorder
|va,p∗(p) − va,p = −1 ∀k ∈ K, p ∈ Pout
k } to
analyze which orders were given to LOS outlier patients while the reference
patient didn’t receive the order.
4. Results
The data for this study were obtained from a pediatric hospital in Pitts-
burgh. |P| = 353 appendectomy patients were hospitalized for, on average,
for 78.968 hours. Important variables extracted from the data warehouse
include, among others, diagnosis codes, gender, age and 636 unique orders
that were entered using Computerized Physician Order Entry. All patient-
identifiable health information was removed to create a de-identified dataset
for this study.
A histogram of the LOS distribution including a Gaussian kernel density
curve is shown in Figure 1(a). We used Equation (1) to determine the out-
lier LOS threshold op which is 229.140 hours. The figure reveals a skewed
distribution with a density maximum at the first interval. Another obser-
vation is a large proportion of patients after the outlier LOS threshold. A
boxplot of the LOS is shown in Figure 1(b). One can observe that the median
is very close to the first quartile and some LOS outliers can be observed after
the 95 percentile.
To investigate whether a parametric model may be used to fit the data, we
ran experiments with 9 distributions such as Beta, Log-normal, Weibull and
Erlang. Our results revealed that the Beta distribution results in the best
fit with respect to the squared error between the empirical and the best
theoretical distribution. The log-normal distribution fits second best and its
results of the fitting process will be analysed in more detail: Both the Chi-
Square (CS) and the Kolmogorov-Smirnov (KS) test resulted in p  0.01
while the CS-test run with 7 intervals and 4 degrees of freedom resulted
in a p  0.005. The optimal parameters of the (theoretical) log-normal
Histogram of LOS (n=353)
LOS (hours)
Density
0 200 400 600 800
0.000
0.002
0.004
0.006
0.008
0.010
0.012
(a)
0
100
200
300
400
500
600
700
Box plot of LOS (n=353)
LOS
(hours)
(b)
cluster k=13 cluster 1,2,...,12
0
100
200
300
400
500
600
700
LOS(hours)
(c)
Figure 1: LOS distribution (a), LOS box plot (b) clustered patients’ LOS (c)
distribution’s expected value and variance come up to µ = 72 and σ2
=
123, respectively with a LOS-intercept of 14 (hours) based on the empirical
minimum LOS value. Using this distribution to fit our data, the squared
error comes up to 0.137. The result that the log-normal distribution fits
very well is not surprising and confirms assumptions from the literature, see
Min and Yih (2010).
In our first stage clustering, we varied the number of k until we reached
a cluster in which the outlier flag was present. The first cluster was k =
13. The clinical and demographic information are shown in Table 1(a) and
a summary statistics is shown in Table 1(b). The table shows that ICD-
9 code 540.1 – ‘Acute appendicitis with peritoneal abscess’, an emergency
type of 4, a moderate APR DRG severity and ‘laparoscopic appendectomy’
are the attributes in which outlier patients are most likely to be present.
Figure 1(c) shows a LOS boxplot of patients of which the demographic and
clinical attributes belong to this cluster vs. all other patients. In a second
stage, we clustered based on orders to determine the switching patterns.
Again, we run the k-means algorithm and now want to discover differences
in the prescription of orders. We came up with two clusters with a total
number of 306 orders. Table 1(d) shows the results of the second stage
clustering. The table reveals that the number of orders more than doubles
from cluster k = 2 to cluster k = 1. One explanation for this phenomenon
is that the length of stay is longer and therefore more orders are likely to
be prescribed to patients. Another observation is that in cluster k = 2 the
LOS more than triples as compared to cluster k = 1. Now, comparing both
clusters, we observed |Ao, on → off
13 | = 52 occurrences with a switch from on-off
while a off-on was only observed |Ao, off → on
13 | = 4 times. In the latter case,
we predominantly observed order switches in drug and diet prescriptions.
A va
Diagnosis code 540.1
Emergency type 4
APR DRG Severity Moderate
Laparoscopic appendectomy yes
(a)
Number of Data Points 17
Min Data Value 47.7
Max Data Value 730
Sample Mean 178.9
Sample Std Dev 156.5
1st
quartile 88.5
2nd
quartile 137.2
3rd
quartile 190.4
(b)
Number of Data Points 336
Min Data Value 14.5
Max Data Value 424.9
Sample Mean 73.9
Sample Std Dev 66.7
1st
quartile 32.2
2nd
quartile 43.7
3rd
quartile 109.1
(c)
cluster #orders on #orders off Mean LOS
k = 1 90 216 371.6
k = 2 42 264 119.7
(d)
Table 1: Outlier cluster k = 13 (a), its summary statistics (b) and summary statistics of
patients not belonging to it (c) and order switchings after the 2nd stage clustering (d)
As a consequence of our study, if we assume that the patient population in
cluster k = 2 could be moved towards the patient population in cluster k = 1
through order switching, we can determine a lower LOS bound. Applied to
our dataset, the total length of stay could be reduced from 78.97 to 76.11
hours which equals to a 3.8% LOS reduction. In practice and to create a
decision support tool which involves clinicians, similar reference patients may
be presented to a clinician when treating each particular patient. A clinician
may then decide to what extent order switching is appropriate within the
limits of clinical guidelines.
5. Summary and Conclusions
In this paper, we have developed a clustering approach of patients for the
management of length of stay outliers for pediatric appendectomy. We pro-
vided a two-stage clustering method to cluster patients based on similar
clinical, demographic and length of stay characteristics and applied it to a
data set including more than 350 patients. We retrieved a cluster of patients
in which LOS outliers are likely to occur. In a second stage, we compared or-
der prescription for LOS outliers with the ones for patients who have similar
clinical and demographic characteristics but are non-outlier patients. Future
work will extend this work towards the LOS outlier management of chronic
conditions such as asthma and to incorporate clinicians’ feedback into our
methods.
References
Ashour, O. and Okudan Kremer, G. (2014). Dynamic patient grouping and prioritization: a new approach
to emergency department flow improvement. Health Care Manag Sci, pages 1–14.
Baesens, B., Mues, C., Martens, D., and Vanthienen, J. (2009). 50 years of data mining and OR: upcoming
trends and challenges. J Oper Res Soc, 60(Supplement 1):16–23.
El-Darzi, E., Abbi, R., Vasilakis, C., Gorunescu, F., Gorunescu, M., and Millard, P. (2009). Length of
stay-based clustering methods for patient grouping. In McClean, S., Millard, P., El-Darzi, E., and
Nugent, C., editors, Intelligent Patient Management, pages 39–56. Springer.
Gartner, D. (2015). Scheduling the hospital-wide flow of elective patients – early classification of diagnosis-
related groups through machine learning. Springer, Lect Notes Econ Math edition. Heidelberg.
Gartner, D. and Kolisch, R. (2014). Scheduling the hospital-wide flow of elective patients. Eur J Oper
Res, 223(3):689–699.
Gartner, D., Kolisch, R., Neill, D. B., and Padman, R. (2015a). Machine Learning Approaches for Early
DRG Classification and Resource Allocation. INFORMS Journal on Computing, 27(4):718–734.
Gartner, D., Zhang, Y., and Padman, R. (2015b). Workload Reduction Through Usability Improvement of
Hospital Information Systems – The Case of Order Set Optimization. Proceedings of the International
Conference on Information Systems (ICIS). Fort Worth, TX.
Hosseinifard, S., Abbasi, B., and Minas, J. (2014). Intensive care unit discharge policies prior to treatment
completion. Oper Res Health Care, 3(3):168–175.
Jain, A. (2010). Data clustering: 50 years beyond k-means. Pattern Recogn Lett, 31(8):651–666.
Kim, Y.-J. and Soeken, K. (2005). A meta-analysis of the effect of hospital-based case management on
hospital length-of-stay and readmission. Nurs Res, 54(4):255–264.
Meisel, S. and Mattfeld, D. (2010). Synergies of operations research and data mining. Eur J Oper Res,
206(1):1–10.
Min, D. and Yih, Y. (2010). Scheduling elective surgery under uncertainty and downstream capacity
constraints. Eur J Oper Res, 206(3):642–652.
Olafsson, S., Li, X., and Wu, S. (2008). Operations research and data mining. Eur J Oper Res, 187(3):1429–
1448.
Pirson, M., Dramaix, M., Leclercq, P., and Jackson, T. (2006). Analysis of cost outliers within APR-DRGs
in a Belgian general hospital: two complementary approaches. Health Policy, 76(1):13–25.
Saria, S., Rajani, A., Gould, J., Koller, D., and Penn, A. (2010). Integration of early physiological
responses predicts later illness severity in preterm infants. Sci Transl Med, 2(48):48–65.
Tu, J., Jaglal, S., and Naylor, C. (1995). Multicenter validation of a risk index for mortality, intensive
care unit stay, and overall hospital length of stay after cardiac surgery. Circulation, 91(3):677–684.
Xu, M., Wong, T., and Chin, K. (2014). A medical procedure-based patient grouping method for an
emergency department. Appl Soft Comp, 14(Part A):31–37.

More Related Content

What's hot

Common statistical tests and applications in epidemiological literature
Common statistical tests and applications in epidemiological literatureCommon statistical tests and applications in epidemiological literature
Common statistical tests and applications in epidemiological literature
Kadium
 
statistics in pharmaceutical sciences
statistics in pharmaceutical sciencesstatistics in pharmaceutical sciences
statistics in pharmaceutical sciencesTechmasi
 
Basic statistics for pharmaceutical (Part 1)
Basic statistics for pharmaceutical (Part 1)Basic statistics for pharmaceutical (Part 1)
Basic statistics for pharmaceutical (Part 1)
Syed Muhammad Danish
 
Subgroup identification for precision medicine. a comparative review of 13 me...
Subgroup identification for precision medicine. a comparative review of 13 me...Subgroup identification for precision medicine. a comparative review of 13 me...
Subgroup identification for precision medicine. a comparative review of 13 me...
SuciAidaDahhar
 
Statistical analysis by iswar
Statistical analysis by iswarStatistical analysis by iswar
Medical Statistics Pt 1
Medical Statistics Pt 1Medical Statistics Pt 1
Medical Statistics Pt 1
Fastbleep
 
Dr Vivek Baliga - The Basics Of Medical Statistics
Dr Vivek Baliga - The Basics Of Medical StatisticsDr Vivek Baliga - The Basics Of Medical Statistics
Dr Vivek Baliga - The Basics Of Medical Statistics
Dr Vivek Baliga
 
Testing of hypothesis and tests of significance
Testing of hypothesis and tests of significanceTesting of hypothesis and tests of significance
Testing of hypothesis and tests of significance
Sudha Rameshwari
 
Statistic in research
Statistic in researchStatistic in research
Statistic in research
Dalia El-Shafei
 
Metanalysis Lecture
Metanalysis LectureMetanalysis Lecture
Metanalysis Lecturedrmomusa
 
NON-PARAMETRIC TESTS by Prajakta Sawant
NON-PARAMETRIC TESTS by Prajakta SawantNON-PARAMETRIC TESTS by Prajakta Sawant
NON-PARAMETRIC TESTS by Prajakta Sawant
PRAJAKTASAWANT33
 
The Cortisol Awakening Response for Modified Method for Higher Order Logical ...
The Cortisol Awakening Response for Modified Method for Higher Order Logical ...The Cortisol Awakening Response for Modified Method for Higher Order Logical ...
The Cortisol Awakening Response for Modified Method for Higher Order Logical ...
IJERA Editor
 
Propensity Scores in Medical Device Trials
Propensity Scores in Medical Device TrialsPropensity Scores in Medical Device Trials
Propensity Scores in Medical Device Trials
Biomedical Statistical Consulting
 
Basics of medical statistics
Basics of medical statisticsBasics of medical statistics
Basics of medical statistics
Ramachandra Barik
 
Repeated events analyses
Repeated events analysesRepeated events analyses
Repeated events analyses
Mike LaValley
 
BIOSTATISTICS + EXERCISES
BIOSTATISTICS + EXERCISESBIOSTATISTICS + EXERCISES
BIOSTATISTICS + EXERCISES
MINANI Theobald
 
Internal 2014 - Cochrane data
Internal 2014 - Cochrane dataInternal 2014 - Cochrane data
Internal 2014 - Cochrane data
Evangelos Kontopantelis
 
Basic survival analysis
Basic survival analysisBasic survival analysis
Basic survival analysis
Mike LaValley
 
Population Pharmacokinetic Modelling of an investigational prodrug. Crunenber...
Population Pharmacokinetic Modelling of an investigational prodrug. Crunenber...Population Pharmacokinetic Modelling of an investigational prodrug. Crunenber...
Population Pharmacokinetic Modelling of an investigational prodrug. Crunenber...
robirish51
 

What's hot (19)

Common statistical tests and applications in epidemiological literature
Common statistical tests and applications in epidemiological literatureCommon statistical tests and applications in epidemiological literature
Common statistical tests and applications in epidemiological literature
 
statistics in pharmaceutical sciences
statistics in pharmaceutical sciencesstatistics in pharmaceutical sciences
statistics in pharmaceutical sciences
 
Basic statistics for pharmaceutical (Part 1)
Basic statistics for pharmaceutical (Part 1)Basic statistics for pharmaceutical (Part 1)
Basic statistics for pharmaceutical (Part 1)
 
Subgroup identification for precision medicine. a comparative review of 13 me...
Subgroup identification for precision medicine. a comparative review of 13 me...Subgroup identification for precision medicine. a comparative review of 13 me...
Subgroup identification for precision medicine. a comparative review of 13 me...
 
Statistical analysis by iswar
Statistical analysis by iswarStatistical analysis by iswar
Statistical analysis by iswar
 
Medical Statistics Pt 1
Medical Statistics Pt 1Medical Statistics Pt 1
Medical Statistics Pt 1
 
Dr Vivek Baliga - The Basics Of Medical Statistics
Dr Vivek Baliga - The Basics Of Medical StatisticsDr Vivek Baliga - The Basics Of Medical Statistics
Dr Vivek Baliga - The Basics Of Medical Statistics
 
Testing of hypothesis and tests of significance
Testing of hypothesis and tests of significanceTesting of hypothesis and tests of significance
Testing of hypothesis and tests of significance
 
Statistic in research
Statistic in researchStatistic in research
Statistic in research
 
Metanalysis Lecture
Metanalysis LectureMetanalysis Lecture
Metanalysis Lecture
 
NON-PARAMETRIC TESTS by Prajakta Sawant
NON-PARAMETRIC TESTS by Prajakta SawantNON-PARAMETRIC TESTS by Prajakta Sawant
NON-PARAMETRIC TESTS by Prajakta Sawant
 
The Cortisol Awakening Response for Modified Method for Higher Order Logical ...
The Cortisol Awakening Response for Modified Method for Higher Order Logical ...The Cortisol Awakening Response for Modified Method for Higher Order Logical ...
The Cortisol Awakening Response for Modified Method for Higher Order Logical ...
 
Propensity Scores in Medical Device Trials
Propensity Scores in Medical Device TrialsPropensity Scores in Medical Device Trials
Propensity Scores in Medical Device Trials
 
Basics of medical statistics
Basics of medical statisticsBasics of medical statistics
Basics of medical statistics
 
Repeated events analyses
Repeated events analysesRepeated events analyses
Repeated events analyses
 
BIOSTATISTICS + EXERCISES
BIOSTATISTICS + EXERCISESBIOSTATISTICS + EXERCISES
BIOSTATISTICS + EXERCISES
 
Internal 2014 - Cochrane data
Internal 2014 - Cochrane dataInternal 2014 - Cochrane data
Internal 2014 - Cochrane data
 
Basic survival analysis
Basic survival analysisBasic survival analysis
Basic survival analysis
 
Population Pharmacokinetic Modelling of an investigational prodrug. Crunenber...
Population Pharmacokinetic Modelling of an investigational prodrug. Crunenber...Population Pharmacokinetic Modelling of an investigational prodrug. Crunenber...
Population Pharmacokinetic Modelling of an investigational prodrug. Crunenber...
 

Similar to 20170215 daniel gartner session 3_a1_kss_2016_paper_31

poster_INFORMS_healthcare_2015 - condensed
poster_INFORMS_healthcare_2015 - condensedposter_INFORMS_healthcare_2015 - condensed
poster_INFORMS_healthcare_2015 - condensedYang Yang
 
Chi square(hospital admin) A
Chi square(hospital admin) AChi square(hospital admin) A
Chi square(hospital admin) A
Mmedsc Hahm
 
Semantic Web Technologies as a Framework for Clinical Informatics
Semantic Web Technologies as a Framework for Clinical InformaticsSemantic Web Technologies as a Framework for Clinical Informatics
Semantic Web Technologies as a Framework for Clinical InformaticsChimezie Ogbuji
 
Restricted Mean Survival Analysis
Restricted Mean Survival AnalysisRestricted Mean Survival Analysis
Restricted Mean Survival Analysis
ayatan2
 
Statistical modeling in pharmaceutical research and development
Statistical modeling in pharmaceutical research and developmentStatistical modeling in pharmaceutical research and development
Statistical modeling in pharmaceutical research and development
PV. Viji
 
Automated Extraction Of Reported Statistical Analyses Towards A Logical Repr...
Automated Extraction Of Reported Statistical Analyses  Towards A Logical Repr...Automated Extraction Of Reported Statistical Analyses  Towards A Logical Repr...
Automated Extraction Of Reported Statistical Analyses Towards A Logical Repr...
Nat Rice
 
QST Reference Data 2010 magerl pain
QST Reference Data 2010 magerl painQST Reference Data 2010 magerl pain
QST Reference Data 2010 magerl pain
Paul Coelho, MD
 
coad_machine_learning
coad_machine_learningcoad_machine_learning
coad_machine_learningFord Sleeman
 
Application of Central Limit Theorem to Study the Student Skills in Verbal, A...
Application of Central Limit Theorem to Study the Student Skills in Verbal, A...Application of Central Limit Theorem to Study the Student Skills in Verbal, A...
Application of Central Limit Theorem to Study the Student Skills in Verbal, A...
theijes
 
A discriminative-feature-space-for-detecting-and-recognizing-pathologies-of-t...
A discriminative-feature-space-for-detecting-and-recognizing-pathologies-of-t...A discriminative-feature-space-for-detecting-and-recognizing-pathologies-of-t...
A discriminative-feature-space-for-detecting-and-recognizing-pathologies-of-t...
Damian R. Mingle, MBA
 
NSG 6101.docx
NSG 6101.docxNSG 6101.docx
NSG 6101.docx
bkbk37
 
Statistics Introduction In Pharmacy
Statistics Introduction In PharmacyStatistics Introduction In Pharmacy
Statistics Introduction In Pharmacy
Pharmacy Universe
 
JSM2013,Proceedings,paper307699_79238,DSweitzer
JSM2013,Proceedings,paper307699_79238,DSweitzerJSM2013,Proceedings,paper307699_79238,DSweitzer
JSM2013,Proceedings,paper307699_79238,DSweitzerDennis Sweitzer
 
Chi squared test
Chi squared testChi squared test
Chi squared test
Dhruv Patel
 
Choosing statistical tests
Choosing statistical testsChoosing statistical tests
Choosing statistical testsAkiode Noah
 
Clinical application of statistical analysis
Clinical application of statistical analysisClinical application of statistical analysis
Clinical application of statistical analysisUmair hanif
 
WisconsinBreastCancerDiagnosticClassificationusingKNNandRandomForest
WisconsinBreastCancerDiagnosticClassificationusingKNNandRandomForestWisconsinBreastCancerDiagnosticClassificationusingKNNandRandomForest
WisconsinBreastCancerDiagnosticClassificationusingKNNandRandomForestSheing Jing Ng
 
Evaluation of Logistic Regression and Neural Network Model With Sensitivity A...
Evaluation of Logistic Regression and Neural Network Model With Sensitivity A...Evaluation of Logistic Regression and Neural Network Model With Sensitivity A...
Evaluation of Logistic Regression and Neural Network Model With Sensitivity A...
CSCJournals
 

Similar to 20170215 daniel gartner session 3_a1_kss_2016_paper_31 (20)

poster_INFORMS_healthcare_2015 - condensed
poster_INFORMS_healthcare_2015 - condensedposter_INFORMS_healthcare_2015 - condensed
poster_INFORMS_healthcare_2015 - condensed
 
Chi square(hospital admin) A
Chi square(hospital admin) AChi square(hospital admin) A
Chi square(hospital admin) A
 
Semantic Web Technologies as a Framework for Clinical Informatics
Semantic Web Technologies as a Framework for Clinical InformaticsSemantic Web Technologies as a Framework for Clinical Informatics
Semantic Web Technologies as a Framework for Clinical Informatics
 
Restricted Mean Survival Analysis
Restricted Mean Survival AnalysisRestricted Mean Survival Analysis
Restricted Mean Survival Analysis
 
Statistical modeling in pharmaceutical research and development
Statistical modeling in pharmaceutical research and developmentStatistical modeling in pharmaceutical research and development
Statistical modeling in pharmaceutical research and development
 
Automated Extraction Of Reported Statistical Analyses Towards A Logical Repr...
Automated Extraction Of Reported Statistical Analyses  Towards A Logical Repr...Automated Extraction Of Reported Statistical Analyses  Towards A Logical Repr...
Automated Extraction Of Reported Statistical Analyses Towards A Logical Repr...
 
QST Reference Data 2010 magerl pain
QST Reference Data 2010 magerl painQST Reference Data 2010 magerl pain
QST Reference Data 2010 magerl pain
 
coad_machine_learning
coad_machine_learningcoad_machine_learning
coad_machine_learning
 
001science
001science001science
001science
 
Application of Central Limit Theorem to Study the Student Skills in Verbal, A...
Application of Central Limit Theorem to Study the Student Skills in Verbal, A...Application of Central Limit Theorem to Study the Student Skills in Verbal, A...
Application of Central Limit Theorem to Study the Student Skills in Verbal, A...
 
A discriminative-feature-space-for-detecting-and-recognizing-pathologies-of-t...
A discriminative-feature-space-for-detecting-and-recognizing-pathologies-of-t...A discriminative-feature-space-for-detecting-and-recognizing-pathologies-of-t...
A discriminative-feature-space-for-detecting-and-recognizing-pathologies-of-t...
 
Berd 5-6
Berd 5-6Berd 5-6
Berd 5-6
 
NSG 6101.docx
NSG 6101.docxNSG 6101.docx
NSG 6101.docx
 
Statistics Introduction In Pharmacy
Statistics Introduction In PharmacyStatistics Introduction In Pharmacy
Statistics Introduction In Pharmacy
 
JSM2013,Proceedings,paper307699_79238,DSweitzer
JSM2013,Proceedings,paper307699_79238,DSweitzerJSM2013,Proceedings,paper307699_79238,DSweitzer
JSM2013,Proceedings,paper307699_79238,DSweitzer
 
Chi squared test
Chi squared testChi squared test
Chi squared test
 
Choosing statistical tests
Choosing statistical testsChoosing statistical tests
Choosing statistical tests
 
Clinical application of statistical analysis
Clinical application of statistical analysisClinical application of statistical analysis
Clinical application of statistical analysis
 
WisconsinBreastCancerDiagnosticClassificationusingKNNandRandomForest
WisconsinBreastCancerDiagnosticClassificationusingKNNandRandomForestWisconsinBreastCancerDiagnosticClassificationusingKNNandRandomForest
WisconsinBreastCancerDiagnosticClassificationusingKNNandRandomForest
 
Evaluation of Logistic Regression and Neural Network Model With Sensitivity A...
Evaluation of Logistic Regression and Neural Network Model With Sensitivity A...Evaluation of Logistic Regression and Neural Network Model With Sensitivity A...
Evaluation of Logistic Regression and Neural Network Model With Sensitivity A...
 

More from International Society of Service Innovation Professionals

EIT-Digital_Spohrer_AI_Intro 20240529 v5.pptx
EIT-Digital_Spohrer_AI_Intro 20240529 v5.pptxEIT-Digital_Spohrer_AI_Intro 20240529 v5.pptx
EIT-Digital_Spohrer_AI_Intro 20240529 v5.pptx
International Society of Service Innovation Professionals
 
20240526 Lou_Freund AHFE_HSSE T-shaped Skills Development.pptx
20240526 Lou_Freund AHFE_HSSE T-shaped Skills Development.pptx20240526 Lou_Freund AHFE_HSSE T-shaped Skills Development.pptx
20240526 Lou_Freund AHFE_HSSE T-shaped Skills Development.pptx
International Society of Service Innovation Professionals
 
20240515 ISSIP_Collab_SJSU_2024_Spring AI_Digital_Twins ISSIP_EC Final Presen...
20240515 ISSIP_Collab_SJSU_2024_Spring AI_Digital_Twins ISSIP_EC Final Presen...20240515 ISSIP_Collab_SJSU_2024_Spring AI_Digital_Twins ISSIP_EC Final Presen...
20240515 ISSIP_Collab_SJSU_2024_Spring AI_Digital_Twins ISSIP_EC Final Presen...
International Society of Service Innovation Professionals
 
20240515 SJSU White Paper Revised AI_Digital_Twins.pdf
20240515 SJSU White Paper Revised AI_Digital_Twins.pdf20240515 SJSU White Paper Revised AI_Digital_Twins.pdf
20240515 SJSU White Paper Revised AI_Digital_Twins.pdf
International Society of Service Innovation Professionals
 
20240515 MyTMe - Resumes and Teams Update for ISSIP 5-15-24.pptx
20240515 MyTMe - Resumes and Teams Update for ISSIP 5-15-24.pptx20240515 MyTMe - Resumes and Teams Update for ISSIP 5-15-24.pptx
20240515 MyTMe - Resumes and Teams Update for ISSIP 5-15-24.pptx
International Society of Service Innovation Professionals
 
SJSU Students AI Digital Twin of Jim Spohrer 20240506 v2.pptx
SJSU Students AI Digital Twin of Jim Spohrer 20240506 v2.pptxSJSU Students AI Digital Twin of Jim Spohrer 20240506 v2.pptx
SJSU Students AI Digital Twin of Jim Spohrer 20240506 v2.pptx
International Society of Service Innovation Professionals
 
20240501 Healthcare Transformation - PSU Event Series.pptx
20240501 Healthcare Transformation - PSU Event Series.pptx20240501 Healthcare Transformation - PSU Event Series.pptx
20240501 Healthcare Transformation - PSU Event Series.pptx
International Society of Service Innovation Professionals
 
20240426 PSU ISSIP AI_Digital_Twins Showcase Poster.pptx
20240426 PSU ISSIP AI_Digital_Twins Showcase Poster.pptx20240426 PSU ISSIP AI_Digital_Twins Showcase Poster.pptx
20240426 PSU ISSIP AI_Digital_Twins Showcase Poster.pptx
International Society of Service Innovation Professionals
 
20240118 ISSIP_Collab_PSU v1 AI Digital Twins.pptx
20240118 ISSIP_Collab_PSU v1 AI Digital Twins.pptx20240118 ISSIP_Collab_PSU v1 AI Digital Twins.pptx
20240118 ISSIP_Collab_PSU v1 AI Digital Twins.pptx
International Society of Service Innovation Professionals
 
20240425 PSU_Spring_2024 AI_Digital_Twins AI_Collab White Paper.pdf
20240425 PSU_Spring_2024 AI_Digital_Twins AI_Collab White Paper.pdf20240425 PSU_Spring_2024 AI_Digital_Twins AI_Collab White Paper.pdf
20240425 PSU_Spring_2024 AI_Digital_Twins AI_Collab White Paper.pdf
International Society of Service Innovation Professionals
 
20240425 PSU ISSIP SPR 24 Final Presentation.pptx
20240425 PSU ISSIP SPR 24 Final Presentation.pptx20240425 PSU ISSIP SPR 24 Final Presentation.pptx
20240425 PSU ISSIP SPR 24 Final Presentation.pptx
International Society of Service Innovation Professionals
 
20240410 ISSIP GGG Qtrly Community Connection Slides.pptx
20240410 ISSIP GGG Qtrly Community Connection Slides.pptx20240410 ISSIP GGG Qtrly Community Connection Slides.pptx
20240410 ISSIP GGG Qtrly Community Connection Slides.pptx
International Society of Service Innovation Professionals
 
20240409 Engage with ISSIP_2024 Michele_Carroll.pptx
20240409 Engage with ISSIP_2024 Michele_Carroll.pptx20240409 Engage with ISSIP_2024 Michele_Carroll.pptx
20240409 Engage with ISSIP_2024 Michele_Carroll.pptx
International Society of Service Innovation Professionals
 
20240313 Customer_Wellness_and_Fitness ISSIP_Ambassadors Kevin_Clark .pptx
20240313 Customer_Wellness_and_Fitness ISSIP_Ambassadors Kevin_Clark .pptx20240313 Customer_Wellness_and_Fitness ISSIP_Ambassadors Kevin_Clark .pptx
20240313 Customer_Wellness_and_Fitness ISSIP_Ambassadors Kevin_Clark .pptx
International Society of Service Innovation Professionals
 
20240131 Progress_Update_BoardofDirectors.pptx
20240131 Progress_Update_BoardofDirectors.pptx20240131 Progress_Update_BoardofDirectors.pptx
20240131 Progress_Update_BoardofDirectors.pptx
International Society of Service Innovation Professionals
 
MyTMe - The T-shape metric - ISSIP Workshop 1-17-24.pdf
MyTMe - The T-shape metric - ISSIP Workshop 1-17-24.pdfMyTMe - The T-shape metric - ISSIP Workshop 1-17-24.pdf
MyTMe - The T-shape metric - ISSIP Workshop 1-17-24.pdf
International Society of Service Innovation Professionals
 
PSU 2023 Final Showcase - ISSIP_AI_Collab.pptx
PSU 2023 Final Showcase - ISSIP_AI_Collab.pptxPSU 2023 Final Showcase - ISSIP_AI_Collab.pptx
PSU 2023 Final Showcase - ISSIP_AI_Collab.pptx
International Society of Service Innovation Professionals
 
PSU 2023 Final Presentation ISSIP_AI_Collab.pptx
PSU 2023 Final Presentation ISSIP_AI_Collab.pptxPSU 2023 Final Presentation ISSIP_AI_Collab.pptx
PSU 2023 Final Presentation ISSIP_AI_Collab.pptx
International Society of Service Innovation Professionals
 
PSU 2023 Final Report - ISSIP_AI_Collab.docx
PSU 2023 Final Report - ISSIP_AI_Collab.docxPSU 2023 Final Report - ISSIP_AI_Collab.docx
PSU 2023 Final Report - ISSIP_AI_Collab.docx
International Society of Service Innovation Professionals
 
PSU 2023 Automobile Case Study Guide.pptx
PSU 2023 Automobile Case Study Guide.pptxPSU 2023 Automobile Case Study Guide.pptx
PSU 2023 Automobile Case Study Guide.pptx
International Society of Service Innovation Professionals
 

More from International Society of Service Innovation Professionals (20)

EIT-Digital_Spohrer_AI_Intro 20240529 v5.pptx
EIT-Digital_Spohrer_AI_Intro 20240529 v5.pptxEIT-Digital_Spohrer_AI_Intro 20240529 v5.pptx
EIT-Digital_Spohrer_AI_Intro 20240529 v5.pptx
 
20240526 Lou_Freund AHFE_HSSE T-shaped Skills Development.pptx
20240526 Lou_Freund AHFE_HSSE T-shaped Skills Development.pptx20240526 Lou_Freund AHFE_HSSE T-shaped Skills Development.pptx
20240526 Lou_Freund AHFE_HSSE T-shaped Skills Development.pptx
 
20240515 ISSIP_Collab_SJSU_2024_Spring AI_Digital_Twins ISSIP_EC Final Presen...
20240515 ISSIP_Collab_SJSU_2024_Spring AI_Digital_Twins ISSIP_EC Final Presen...20240515 ISSIP_Collab_SJSU_2024_Spring AI_Digital_Twins ISSIP_EC Final Presen...
20240515 ISSIP_Collab_SJSU_2024_Spring AI_Digital_Twins ISSIP_EC Final Presen...
 
20240515 SJSU White Paper Revised AI_Digital_Twins.pdf
20240515 SJSU White Paper Revised AI_Digital_Twins.pdf20240515 SJSU White Paper Revised AI_Digital_Twins.pdf
20240515 SJSU White Paper Revised AI_Digital_Twins.pdf
 
20240515 MyTMe - Resumes and Teams Update for ISSIP 5-15-24.pptx
20240515 MyTMe - Resumes and Teams Update for ISSIP 5-15-24.pptx20240515 MyTMe - Resumes and Teams Update for ISSIP 5-15-24.pptx
20240515 MyTMe - Resumes and Teams Update for ISSIP 5-15-24.pptx
 
SJSU Students AI Digital Twin of Jim Spohrer 20240506 v2.pptx
SJSU Students AI Digital Twin of Jim Spohrer 20240506 v2.pptxSJSU Students AI Digital Twin of Jim Spohrer 20240506 v2.pptx
SJSU Students AI Digital Twin of Jim Spohrer 20240506 v2.pptx
 
20240501 Healthcare Transformation - PSU Event Series.pptx
20240501 Healthcare Transformation - PSU Event Series.pptx20240501 Healthcare Transformation - PSU Event Series.pptx
20240501 Healthcare Transformation - PSU Event Series.pptx
 
20240426 PSU ISSIP AI_Digital_Twins Showcase Poster.pptx
20240426 PSU ISSIP AI_Digital_Twins Showcase Poster.pptx20240426 PSU ISSIP AI_Digital_Twins Showcase Poster.pptx
20240426 PSU ISSIP AI_Digital_Twins Showcase Poster.pptx
 
20240118 ISSIP_Collab_PSU v1 AI Digital Twins.pptx
20240118 ISSIP_Collab_PSU v1 AI Digital Twins.pptx20240118 ISSIP_Collab_PSU v1 AI Digital Twins.pptx
20240118 ISSIP_Collab_PSU v1 AI Digital Twins.pptx
 
20240425 PSU_Spring_2024 AI_Digital_Twins AI_Collab White Paper.pdf
20240425 PSU_Spring_2024 AI_Digital_Twins AI_Collab White Paper.pdf20240425 PSU_Spring_2024 AI_Digital_Twins AI_Collab White Paper.pdf
20240425 PSU_Spring_2024 AI_Digital_Twins AI_Collab White Paper.pdf
 
20240425 PSU ISSIP SPR 24 Final Presentation.pptx
20240425 PSU ISSIP SPR 24 Final Presentation.pptx20240425 PSU ISSIP SPR 24 Final Presentation.pptx
20240425 PSU ISSIP SPR 24 Final Presentation.pptx
 
20240410 ISSIP GGG Qtrly Community Connection Slides.pptx
20240410 ISSIP GGG Qtrly Community Connection Slides.pptx20240410 ISSIP GGG Qtrly Community Connection Slides.pptx
20240410 ISSIP GGG Qtrly Community Connection Slides.pptx
 
20240409 Engage with ISSIP_2024 Michele_Carroll.pptx
20240409 Engage with ISSIP_2024 Michele_Carroll.pptx20240409 Engage with ISSIP_2024 Michele_Carroll.pptx
20240409 Engage with ISSIP_2024 Michele_Carroll.pptx
 
20240313 Customer_Wellness_and_Fitness ISSIP_Ambassadors Kevin_Clark .pptx
20240313 Customer_Wellness_and_Fitness ISSIP_Ambassadors Kevin_Clark .pptx20240313 Customer_Wellness_and_Fitness ISSIP_Ambassadors Kevin_Clark .pptx
20240313 Customer_Wellness_and_Fitness ISSIP_Ambassadors Kevin_Clark .pptx
 
20240131 Progress_Update_BoardofDirectors.pptx
20240131 Progress_Update_BoardofDirectors.pptx20240131 Progress_Update_BoardofDirectors.pptx
20240131 Progress_Update_BoardofDirectors.pptx
 
MyTMe - The T-shape metric - ISSIP Workshop 1-17-24.pdf
MyTMe - The T-shape metric - ISSIP Workshop 1-17-24.pdfMyTMe - The T-shape metric - ISSIP Workshop 1-17-24.pdf
MyTMe - The T-shape metric - ISSIP Workshop 1-17-24.pdf
 
PSU 2023 Final Showcase - ISSIP_AI_Collab.pptx
PSU 2023 Final Showcase - ISSIP_AI_Collab.pptxPSU 2023 Final Showcase - ISSIP_AI_Collab.pptx
PSU 2023 Final Showcase - ISSIP_AI_Collab.pptx
 
PSU 2023 Final Presentation ISSIP_AI_Collab.pptx
PSU 2023 Final Presentation ISSIP_AI_Collab.pptxPSU 2023 Final Presentation ISSIP_AI_Collab.pptx
PSU 2023 Final Presentation ISSIP_AI_Collab.pptx
 
PSU 2023 Final Report - ISSIP_AI_Collab.docx
PSU 2023 Final Report - ISSIP_AI_Collab.docxPSU 2023 Final Report - ISSIP_AI_Collab.docx
PSU 2023 Final Report - ISSIP_AI_Collab.docx
 
PSU 2023 Automobile Case Study Guide.pptx
PSU 2023 Automobile Case Study Guide.pptxPSU 2023 Automobile Case Study Guide.pptx
PSU 2023 Automobile Case Study Guide.pptx
 

Recently uploaded

The basics of sentences session 5pptx.pptx
The basics of sentences session 5pptx.pptxThe basics of sentences session 5pptx.pptx
The basics of sentences session 5pptx.pptx
heathfieldcps1
 
CACJapan - GROUP Presentation 1- Wk 4.pdf
CACJapan - GROUP Presentation 1- Wk 4.pdfCACJapan - GROUP Presentation 1- Wk 4.pdf
CACJapan - GROUP Presentation 1- Wk 4.pdf
camakaiclarkmusic
 
Palestine last event orientationfvgnh .pptx
Palestine last event orientationfvgnh .pptxPalestine last event orientationfvgnh .pptx
Palestine last event orientationfvgnh .pptx
RaedMohamed3
 
Chapter 3 - Islamic Banking Products and Services.pptx
Chapter 3 - Islamic Banking Products and Services.pptxChapter 3 - Islamic Banking Products and Services.pptx
Chapter 3 - Islamic Banking Products and Services.pptx
Mohd Adib Abd Muin, Senior Lecturer at Universiti Utara Malaysia
 
BÀI TẬP BỔ TRỢ TIẾNG ANH GLOBAL SUCCESS LỚP 3 - CẢ NĂM (CÓ FILE NGHE VÀ ĐÁP Á...
BÀI TẬP BỔ TRỢ TIẾNG ANH GLOBAL SUCCESS LỚP 3 - CẢ NĂM (CÓ FILE NGHE VÀ ĐÁP Á...BÀI TẬP BỔ TRỢ TIẾNG ANH GLOBAL SUCCESS LỚP 3 - CẢ NĂM (CÓ FILE NGHE VÀ ĐÁP Á...
BÀI TẬP BỔ TRỢ TIẾNG ANH GLOBAL SUCCESS LỚP 3 - CẢ NĂM (CÓ FILE NGHE VÀ ĐÁP Á...
Nguyen Thanh Tu Collection
 
Biological Screening of Herbal Drugs in detailed.
Biological Screening of Herbal Drugs in detailed.Biological Screening of Herbal Drugs in detailed.
Biological Screening of Herbal Drugs in detailed.
Ashokrao Mane college of Pharmacy Peth-Vadgaon
 
The French Revolution Class 9 Study Material pdf free download
The French Revolution Class 9 Study Material pdf free downloadThe French Revolution Class 9 Study Material pdf free download
The French Revolution Class 9 Study Material pdf free download
Vivekanand Anglo Vedic Academy
 
Welcome to TechSoup New Member Orientation and Q&A (May 2024).pdf
Welcome to TechSoup   New Member Orientation and Q&A (May 2024).pdfWelcome to TechSoup   New Member Orientation and Q&A (May 2024).pdf
Welcome to TechSoup New Member Orientation and Q&A (May 2024).pdf
TechSoup
 
Acetabularia Information For Class 9 .docx
Acetabularia Information For Class 9  .docxAcetabularia Information For Class 9  .docx
Acetabularia Information For Class 9 .docx
vaibhavrinwa19
 
CLASS 11 CBSE B.St Project AIDS TO TRADE - INSURANCE
CLASS 11 CBSE B.St Project AIDS TO TRADE - INSURANCECLASS 11 CBSE B.St Project AIDS TO TRADE - INSURANCE
CLASS 11 CBSE B.St Project AIDS TO TRADE - INSURANCE
BhavyaRajput3
 
How to Make a Field invisible in Odoo 17
How to Make a Field invisible in Odoo 17How to Make a Field invisible in Odoo 17
How to Make a Field invisible in Odoo 17
Celine George
 
Home assignment II on Spectroscopy 2024 Answers.pdf
Home assignment II on Spectroscopy 2024 Answers.pdfHome assignment II on Spectroscopy 2024 Answers.pdf
Home assignment II on Spectroscopy 2024 Answers.pdf
Tamralipta Mahavidyalaya
 
Additional Benefits for Employee Website.pdf
Additional Benefits for Employee Website.pdfAdditional Benefits for Employee Website.pdf
Additional Benefits for Employee Website.pdf
joachimlavalley1
 
"Protectable subject matters, Protection in biotechnology, Protection of othe...
"Protectable subject matters, Protection in biotechnology, Protection of othe..."Protectable subject matters, Protection in biotechnology, Protection of othe...
"Protectable subject matters, Protection in biotechnology, Protection of othe...
SACHIN R KONDAGURI
 
TESDA TM1 REVIEWER FOR NATIONAL ASSESSMENT WRITTEN AND ORAL QUESTIONS WITH A...
TESDA TM1 REVIEWER  FOR NATIONAL ASSESSMENT WRITTEN AND ORAL QUESTIONS WITH A...TESDA TM1 REVIEWER  FOR NATIONAL ASSESSMENT WRITTEN AND ORAL QUESTIONS WITH A...
TESDA TM1 REVIEWER FOR NATIONAL ASSESSMENT WRITTEN AND ORAL QUESTIONS WITH A...
EugeneSaldivar
 
Introduction to AI for Nonprofits with Tapp Network
Introduction to AI for Nonprofits with Tapp NetworkIntroduction to AI for Nonprofits with Tapp Network
Introduction to AI for Nonprofits with Tapp Network
TechSoup
 
special B.ed 2nd year old paper_20240531.pdf
special B.ed 2nd year old paper_20240531.pdfspecial B.ed 2nd year old paper_20240531.pdf
special B.ed 2nd year old paper_20240531.pdf
Special education needs
 
Lapbook sobre os Regimes Totalitários.pdf
Lapbook sobre os Regimes Totalitários.pdfLapbook sobre os Regimes Totalitários.pdf
Lapbook sobre os Regimes Totalitários.pdf
Jean Carlos Nunes Paixão
 
A Strategic Approach: GenAI in Education
A Strategic Approach: GenAI in EducationA Strategic Approach: GenAI in Education
A Strategic Approach: GenAI in Education
Peter Windle
 
Francesca Gottschalk - How can education support child empowerment.pptx
Francesca Gottschalk - How can education support child empowerment.pptxFrancesca Gottschalk - How can education support child empowerment.pptx
Francesca Gottschalk - How can education support child empowerment.pptx
EduSkills OECD
 

Recently uploaded (20)

The basics of sentences session 5pptx.pptx
The basics of sentences session 5pptx.pptxThe basics of sentences session 5pptx.pptx
The basics of sentences session 5pptx.pptx
 
CACJapan - GROUP Presentation 1- Wk 4.pdf
CACJapan - GROUP Presentation 1- Wk 4.pdfCACJapan - GROUP Presentation 1- Wk 4.pdf
CACJapan - GROUP Presentation 1- Wk 4.pdf
 
Palestine last event orientationfvgnh .pptx
Palestine last event orientationfvgnh .pptxPalestine last event orientationfvgnh .pptx
Palestine last event orientationfvgnh .pptx
 
Chapter 3 - Islamic Banking Products and Services.pptx
Chapter 3 - Islamic Banking Products and Services.pptxChapter 3 - Islamic Banking Products and Services.pptx
Chapter 3 - Islamic Banking Products and Services.pptx
 
BÀI TẬP BỔ TRỢ TIẾNG ANH GLOBAL SUCCESS LỚP 3 - CẢ NĂM (CÓ FILE NGHE VÀ ĐÁP Á...
BÀI TẬP BỔ TRỢ TIẾNG ANH GLOBAL SUCCESS LỚP 3 - CẢ NĂM (CÓ FILE NGHE VÀ ĐÁP Á...BÀI TẬP BỔ TRỢ TIẾNG ANH GLOBAL SUCCESS LỚP 3 - CẢ NĂM (CÓ FILE NGHE VÀ ĐÁP Á...
BÀI TẬP BỔ TRỢ TIẾNG ANH GLOBAL SUCCESS LỚP 3 - CẢ NĂM (CÓ FILE NGHE VÀ ĐÁP Á...
 
Biological Screening of Herbal Drugs in detailed.
Biological Screening of Herbal Drugs in detailed.Biological Screening of Herbal Drugs in detailed.
Biological Screening of Herbal Drugs in detailed.
 
The French Revolution Class 9 Study Material pdf free download
The French Revolution Class 9 Study Material pdf free downloadThe French Revolution Class 9 Study Material pdf free download
The French Revolution Class 9 Study Material pdf free download
 
Welcome to TechSoup New Member Orientation and Q&A (May 2024).pdf
Welcome to TechSoup   New Member Orientation and Q&A (May 2024).pdfWelcome to TechSoup   New Member Orientation and Q&A (May 2024).pdf
Welcome to TechSoup New Member Orientation and Q&A (May 2024).pdf
 
Acetabularia Information For Class 9 .docx
Acetabularia Information For Class 9  .docxAcetabularia Information For Class 9  .docx
Acetabularia Information For Class 9 .docx
 
CLASS 11 CBSE B.St Project AIDS TO TRADE - INSURANCE
CLASS 11 CBSE B.St Project AIDS TO TRADE - INSURANCECLASS 11 CBSE B.St Project AIDS TO TRADE - INSURANCE
CLASS 11 CBSE B.St Project AIDS TO TRADE - INSURANCE
 
How to Make a Field invisible in Odoo 17
How to Make a Field invisible in Odoo 17How to Make a Field invisible in Odoo 17
How to Make a Field invisible in Odoo 17
 
Home assignment II on Spectroscopy 2024 Answers.pdf
Home assignment II on Spectroscopy 2024 Answers.pdfHome assignment II on Spectroscopy 2024 Answers.pdf
Home assignment II on Spectroscopy 2024 Answers.pdf
 
Additional Benefits for Employee Website.pdf
Additional Benefits for Employee Website.pdfAdditional Benefits for Employee Website.pdf
Additional Benefits for Employee Website.pdf
 
"Protectable subject matters, Protection in biotechnology, Protection of othe...
"Protectable subject matters, Protection in biotechnology, Protection of othe..."Protectable subject matters, Protection in biotechnology, Protection of othe...
"Protectable subject matters, Protection in biotechnology, Protection of othe...
 
TESDA TM1 REVIEWER FOR NATIONAL ASSESSMENT WRITTEN AND ORAL QUESTIONS WITH A...
TESDA TM1 REVIEWER  FOR NATIONAL ASSESSMENT WRITTEN AND ORAL QUESTIONS WITH A...TESDA TM1 REVIEWER  FOR NATIONAL ASSESSMENT WRITTEN AND ORAL QUESTIONS WITH A...
TESDA TM1 REVIEWER FOR NATIONAL ASSESSMENT WRITTEN AND ORAL QUESTIONS WITH A...
 
Introduction to AI for Nonprofits with Tapp Network
Introduction to AI for Nonprofits with Tapp NetworkIntroduction to AI for Nonprofits with Tapp Network
Introduction to AI for Nonprofits with Tapp Network
 
special B.ed 2nd year old paper_20240531.pdf
special B.ed 2nd year old paper_20240531.pdfspecial B.ed 2nd year old paper_20240531.pdf
special B.ed 2nd year old paper_20240531.pdf
 
Lapbook sobre os Regimes Totalitários.pdf
Lapbook sobre os Regimes Totalitários.pdfLapbook sobre os Regimes Totalitários.pdf
Lapbook sobre os Regimes Totalitários.pdf
 
A Strategic Approach: GenAI in Education
A Strategic Approach: GenAI in EducationA Strategic Approach: GenAI in Education
A Strategic Approach: GenAI in Education
 
Francesca Gottschalk - How can education support child empowerment.pptx
Francesca Gottschalk - How can education support child empowerment.pptxFrancesca Gottschalk - How can education support child empowerment.pptx
Francesca Gottschalk - How can education support child empowerment.pptx
 

20170215 daniel gartner session 3_a1_kss_2016_paper_31

  • 1. Length of Stay Outlier Detection through Cluster Analysis: A Case Study in Pediatrics Daniel Gartnera , Rema Padmanb a School of Mathematics, Cardiff University, United Kingdom b The H. John Heinz III College, Carnegie Mellon University, Pittsburgh, USA Abstract The increasing availability of detailed inpatient data is enabling the develop- ment of data-driven approaches to provide novel insights for the management of Length of Stay (LOS), an important quality metric in hospitals. This study examines clustering of inpatients using clinical and demographic attributes to identify LOS outliers and investigates the opportunity to reduce their LOS by comparing their order sequences with similar non-outliers in the same cluster. Learning from retrospective data on 353 pediatric inpatients admit- ted for appendectomy, we develop a two-stage procedure that first identifies a typical cluster with LOS outliers. Our second stage analysis compares orders pairwise to determine candidates for switching to make LOS outliers simi- lar to non-outliers. Results indicate that switching orders in homogeneous inpatient sub-populations within the limits of clinical guidelines may be a promising decision support strategy for LOS management. Keywords: Machine Learning; Clustering; Health Care; Length of Stay Email addresses: gartnerd@cardiff.ac.uk (Daniel Gartner), rpadman@cmu.edu (Rema Padman)
  • 2. 1. Introduction Length of Stay (LOS) is an important quality metric in hospitals that has been studied for decades Kim and Soeken (2005); Tu et al. (1995). However, the increasing digitization of healthcare with Electronic Health Records and other clinical information systems is enabling the collection and analysis of vast amounts of data using advanced data-driven methods that may be par- ticularly valuable for LOS management Gartner (2015); Saria et al. (2010). When patients are treated in hospitals, information about each individual is necessary to perform optimal treatment and scheduling decisions, with the detailed data being documented in the current generation of information sys- tems. Recent research has highlighted that resource allocation decisions can be improved by scheduling patient admissions, treatments and discharges at the right time Gartner and Kolisch (2014); Hosseinifard et al. (2014) while machine learning methods can improve resource allocation decisions and the accuracy of hospital-wide predictive analytics tasks Gartner et al. (2015a). Thus, using data-driven analytic methods to understand length of stay (LOS) variations and exploring opportunities for reducing LOS with a specific focus on LOS outliers is the goal of this study. Using retrospective data on 353 inpatients treated for appendectomy at a major pediatric hospital, we first carry out a descriptive data analysis and test which (theoretical) probability distribution best fits our length of stay data. The results reveal that our data matches observations from the lit- erature. In a first stage cluster analysis, we identify one potential outlier cluster while a descriptive analysis using box plot comparisons of this cluster vs. the union of patients assigned to all other clusters supports this hypothe- sis. In a second clustering stage, we analyse the patient sub-population who belongs to that outlier cluster and provide order prescription behaviour in- sights. More specifically, on a pairwise comparison, we describe which orders are likely to be selected in the outlier population vs. ones that are deselected in the non-outlier population and vice versa. Our findings reveal that four order items are not prescribed in the outlier population while in the non- outlier sub-population, these orders were prescribed. On the other hand, 51 orders were prescribed for the outlier patients which are not enabled in the non-outlier population. These novel data-driven insights can be offered as suggestions for clinicians to apply new evidence-based, clinical guideline- compliant opportunities for LOS reduction through healthcare analytics.
  • 3. 2. Related Work Clustering algorithms and other machine learning approaches are discussed in Baesens et al. (2009); Jain (2010); Meisel and Mattfeld (2010); Olafsson et al. (2008) including an overview of operations research (OR) techniques applied to data mining. Mathematical programming and heuristics for clustering clinical activities in Healthcare Information Systems has been applied in Gartner et al. (2015b) while the identification of similar LOS groups has been studied by El-Darzi et al. (2009). Similar to our problem, the authors study the application of approaches to cluster patient records with similar de- mographic and clinical conditions. Using a stroke dataset, they compare the performance of Gaussian Mixture Models, k-means clustering and a two-step clustering algorithm. Determining cluster centers for patients in the Emer- gency Department (ED) is studied by Ashour and Okudan Kremer (2014). Having defined similar patient clusters, they study the improvement on pa- tient routing decisions based on the clusters. Similarly, Xu et al. (2014) focuses their clustering problem on the ED. Their objective is to cluster pa- tients to resource consumption classes determined by length of treatment while patient demographics are taken into consideration. The approaches proposed in our paper can be categorized and differentiated from the literature of clustering in length of stay management as follows: Using a descriptive data analysis we provide an overview about the charac- teristics of our length of stay data. Fitting several distribution types and pa- rameters of the theoretical probability distribution, we underline the skewed property of the probability distribution from our data. In a next step, we define homogeneous patient groups with respect to demographic, clinical at- tributes and length of stay outliers. Having learned homogeneous groups of inpatients, we evaluate patient orders within the group that potentially contains length of stay outliers and may be responsible for increasing LOS in that group. In conclusion, this study may be considered to be the first to link the discovery of similar clinical and demographic attributes in appendectomy inpatients while, within length of stay outlier clusters, we evaluate possibil- ities for switching of orders and how they potentially reduce the number of LOS outliers.
  • 4. 3. Methods Let P denote a set of individuals (hospital inpatients) and let K denote the set of clusters to which these individuals can be grouped. For each inpatient p ∈ P, we observe a set of attributes A during the patient’s LOS. Let Va denote the set of possible values for attribute a ∈ A and let vp,a ∈ Va denote the value of attribute a for inpatient p. In the following, we will describe how we label patients as LOS outliers, followed by a two-stage clustering approach: The first stage assigns patients’ attributes to homogeneous clusters while clusters with high likelihood to contain LOS outliers can be identified. In a second stage, we filter patients assigned to these clusters and evaluate which patient orders may be switched to reduce length of stay in the LOS outlier patient sub-population. The section closes with an illustrative example. Given the observed LOS of patient p ∈ P, denoted by lp, the 25 and 75 per- centile of the LOS distribution denoted by q25 and q75 , respectively then we assign a patient the flag “outlier” using the following expression (Pirson et al. (2006)): op = 1, 0, if lp q75 + (1.5 · (q75 − q25 )) otherwise . (1) Now, let Adem denote the set of binary demographic attributes and let va,p ∈ {0, 1} denote the attribute value of demographic attribute a ∈ Adem of patient p ∈ P. Let K := {1, 2, . . . , K} be a set of integers with maximum K which will be used for cluster indexing. Our objective is to find cluster centers of patient attributes in order to minimize deviations of each patient’s attribute values with the ones of the cluster centres. One algorithm that min- imizes this objective is the k-means clustering algorithm Jain (2010). The algorithm is a method of vector quantization. It seeks to partition observa- tions into clusters in which each observation belongs to the cluster with the nearest mean which serves as a prototype of the cluster. Once we have found patients with similar clinical, demographic and LOS characteristics, we wish to separate patients within the cluster that has the highest likelihood to contain LOS outliers. In this stage, we extract patients with these attributes and evaluate the order prescription behaviour for these patients between outliers and the false positively clustered outliers which ac- tually belong to the group of non-outliers. Orders prescribed by clinicians to
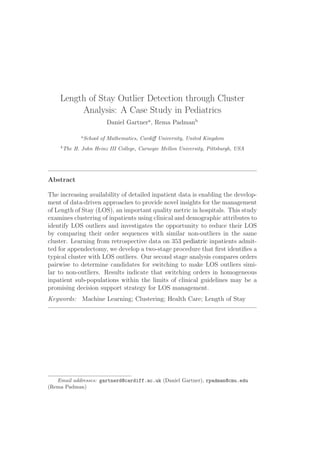
  • 5. patients are, for example, the application of drugs, examinations and ther- apies. Having determined patients with high likelihood of belonging to the group of outliers, we introduce a set Ao, off → on k for cluster k ∈ K which allows experts to evaluate orders which were switched off for outlier patients and were switched on for non-outlieres. The set is determined by Ao, off → on k := {a ∈ Aorder |va,p∗(p) − va,p = 1 ∀k ∈ K, p ∈ Pout k }. Similarly, we introduce the set Ao, on → off k := {a ∈ Aorder |va,p∗(p) − va,p = −1 ∀k ∈ K, p ∈ Pout k } to analyze which orders were given to LOS outlier patients while the reference patient didn’t receive the order. 4. Results The data for this study were obtained from a pediatric hospital in Pitts- burgh. |P| = 353 appendectomy patients were hospitalized for, on average, for 78.968 hours. Important variables extracted from the data warehouse include, among others, diagnosis codes, gender, age and 636 unique orders that were entered using Computerized Physician Order Entry. All patient- identifiable health information was removed to create a de-identified dataset for this study. A histogram of the LOS distribution including a Gaussian kernel density curve is shown in Figure 1(a). We used Equation (1) to determine the out- lier LOS threshold op which is 229.140 hours. The figure reveals a skewed distribution with a density maximum at the first interval. Another obser- vation is a large proportion of patients after the outlier LOS threshold. A boxplot of the LOS is shown in Figure 1(b). One can observe that the median is very close to the first quartile and some LOS outliers can be observed after the 95 percentile. To investigate whether a parametric model may be used to fit the data, we ran experiments with 9 distributions such as Beta, Log-normal, Weibull and Erlang. Our results revealed that the Beta distribution results in the best fit with respect to the squared error between the empirical and the best theoretical distribution. The log-normal distribution fits second best and its results of the fitting process will be analysed in more detail: Both the Chi- Square (CS) and the Kolmogorov-Smirnov (KS) test resulted in p 0.01 while the CS-test run with 7 intervals and 4 degrees of freedom resulted in a p 0.005. The optimal parameters of the (theoretical) log-normal
  • 6. Histogram of LOS (n=353) LOS (hours) Density 0 200 400 600 800 0.000 0.002 0.004 0.006 0.008 0.010 0.012 (a) 0 100 200 300 400 500 600 700 Box plot of LOS (n=353) LOS (hours) (b) cluster k=13 cluster 1,2,...,12 0 100 200 300 400 500 600 700 LOS(hours) (c) Figure 1: LOS distribution (a), LOS box plot (b) clustered patients’ LOS (c) distribution’s expected value and variance come up to µ = 72 and σ2 = 123, respectively with a LOS-intercept of 14 (hours) based on the empirical minimum LOS value. Using this distribution to fit our data, the squared error comes up to 0.137. The result that the log-normal distribution fits very well is not surprising and confirms assumptions from the literature, see Min and Yih (2010). In our first stage clustering, we varied the number of k until we reached a cluster in which the outlier flag was present. The first cluster was k = 13. The clinical and demographic information are shown in Table 1(a) and a summary statistics is shown in Table 1(b). The table shows that ICD- 9 code 540.1 – ‘Acute appendicitis with peritoneal abscess’, an emergency type of 4, a moderate APR DRG severity and ‘laparoscopic appendectomy’ are the attributes in which outlier patients are most likely to be present. Figure 1(c) shows a LOS boxplot of patients of which the demographic and clinical attributes belong to this cluster vs. all other patients. In a second stage, we clustered based on orders to determine the switching patterns. Again, we run the k-means algorithm and now want to discover differences in the prescription of orders. We came up with two clusters with a total number of 306 orders. Table 1(d) shows the results of the second stage clustering. The table reveals that the number of orders more than doubles from cluster k = 2 to cluster k = 1. One explanation for this phenomenon is that the length of stay is longer and therefore more orders are likely to be prescribed to patients. Another observation is that in cluster k = 2 the LOS more than triples as compared to cluster k = 1. Now, comparing both
  • 7. clusters, we observed |Ao, on → off 13 | = 52 occurrences with a switch from on-off while a off-on was only observed |Ao, off → on 13 | = 4 times. In the latter case, we predominantly observed order switches in drug and diet prescriptions. A va Diagnosis code 540.1 Emergency type 4 APR DRG Severity Moderate Laparoscopic appendectomy yes (a) Number of Data Points 17 Min Data Value 47.7 Max Data Value 730 Sample Mean 178.9 Sample Std Dev 156.5 1st quartile 88.5 2nd quartile 137.2 3rd quartile 190.4 (b) Number of Data Points 336 Min Data Value 14.5 Max Data Value 424.9 Sample Mean 73.9 Sample Std Dev 66.7 1st quartile 32.2 2nd quartile 43.7 3rd quartile 109.1 (c) cluster #orders on #orders off Mean LOS k = 1 90 216 371.6 k = 2 42 264 119.7 (d) Table 1: Outlier cluster k = 13 (a), its summary statistics (b) and summary statistics of patients not belonging to it (c) and order switchings after the 2nd stage clustering (d) As a consequence of our study, if we assume that the patient population in cluster k = 2 could be moved towards the patient population in cluster k = 1 through order switching, we can determine a lower LOS bound. Applied to our dataset, the total length of stay could be reduced from 78.97 to 76.11 hours which equals to a 3.8% LOS reduction. In practice and to create a decision support tool which involves clinicians, similar reference patients may be presented to a clinician when treating each particular patient. A clinician may then decide to what extent order switching is appropriate within the limits of clinical guidelines.
  • 8. 5. Summary and Conclusions In this paper, we have developed a clustering approach of patients for the management of length of stay outliers for pediatric appendectomy. We pro- vided a two-stage clustering method to cluster patients based on similar clinical, demographic and length of stay characteristics and applied it to a data set including more than 350 patients. We retrieved a cluster of patients in which LOS outliers are likely to occur. In a second stage, we compared or- der prescription for LOS outliers with the ones for patients who have similar clinical and demographic characteristics but are non-outlier patients. Future work will extend this work towards the LOS outlier management of chronic conditions such as asthma and to incorporate clinicians’ feedback into our methods. References Ashour, O. and Okudan Kremer, G. (2014). Dynamic patient grouping and prioritization: a new approach to emergency department flow improvement. Health Care Manag Sci, pages 1–14. Baesens, B., Mues, C., Martens, D., and Vanthienen, J. (2009). 50 years of data mining and OR: upcoming trends and challenges. J Oper Res Soc, 60(Supplement 1):16–23. El-Darzi, E., Abbi, R., Vasilakis, C., Gorunescu, F., Gorunescu, M., and Millard, P. (2009). Length of stay-based clustering methods for patient grouping. In McClean, S., Millard, P., El-Darzi, E., and Nugent, C., editors, Intelligent Patient Management, pages 39–56. Springer. Gartner, D. (2015). Scheduling the hospital-wide flow of elective patients – early classification of diagnosis- related groups through machine learning. Springer, Lect Notes Econ Math edition. Heidelberg. Gartner, D. and Kolisch, R. (2014). Scheduling the hospital-wide flow of elective patients. Eur J Oper Res, 223(3):689–699. Gartner, D., Kolisch, R., Neill, D. B., and Padman, R. (2015a). Machine Learning Approaches for Early DRG Classification and Resource Allocation. INFORMS Journal on Computing, 27(4):718–734. Gartner, D., Zhang, Y., and Padman, R. (2015b). Workload Reduction Through Usability Improvement of Hospital Information Systems – The Case of Order Set Optimization. Proceedings of the International Conference on Information Systems (ICIS). Fort Worth, TX. Hosseinifard, S., Abbasi, B., and Minas, J. (2014). Intensive care unit discharge policies prior to treatment completion. Oper Res Health Care, 3(3):168–175. Jain, A. (2010). Data clustering: 50 years beyond k-means. Pattern Recogn Lett, 31(8):651–666. Kim, Y.-J. and Soeken, K. (2005). A meta-analysis of the effect of hospital-based case management on hospital length-of-stay and readmission. Nurs Res, 54(4):255–264. Meisel, S. and Mattfeld, D. (2010). Synergies of operations research and data mining. Eur J Oper Res, 206(1):1–10.
  • 9. Min, D. and Yih, Y. (2010). Scheduling elective surgery under uncertainty and downstream capacity constraints. Eur J Oper Res, 206(3):642–652. Olafsson, S., Li, X., and Wu, S. (2008). Operations research and data mining. Eur J Oper Res, 187(3):1429– 1448. Pirson, M., Dramaix, M., Leclercq, P., and Jackson, T. (2006). Analysis of cost outliers within APR-DRGs in a Belgian general hospital: two complementary approaches. Health Policy, 76(1):13–25. Saria, S., Rajani, A., Gould, J., Koller, D., and Penn, A. (2010). Integration of early physiological responses predicts later illness severity in preterm infants. Sci Transl Med, 2(48):48–65. Tu, J., Jaglal, S., and Naylor, C. (1995). Multicenter validation of a risk index for mortality, intensive care unit stay, and overall hospital length of stay after cardiac surgery. Circulation, 91(3):677–684. Xu, M., Wong, T., and Chin, K. (2014). A medical procedure-based patient grouping method for an emergency department. Appl Soft Comp, 14(Part A):31–37.