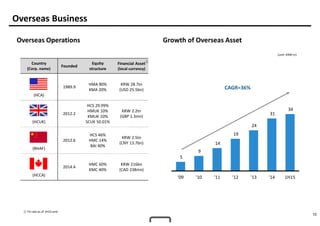
1H15 Earnings Release
Hyundai Capital Services
1
Disclaimer
This presentation material is being presented to you solely for your information only and may not be taken away by you and may not be
reproduced, redistributed or passed on, directly or indirectly, to any other person or published, in whole or in part, for any purpose.
These presentation materials have been prepared by Hyundai Capital Services., Inc. (“HCS or the Company”), solely for the use at this
presentation and have not been independently verified. No representations or warranties, express or implied, are made as to, and no reliance
should be placed on, the accuracy, fairness or completeness of the information presented or contained in this presentation. Neither the
Companies nor any of theirs affiliates, advisers or representatives accepts any responsibility whatsoever for any loss or damage arising from any
information presented or contained in this presentation. The information presented or contained in this presentation is current as of the date
hereof and is subject to change without notice and its accuracy is not guaranteed. Neither the Companies nor any of their affiliates, advisers or
representatives make any undertaking to update any such information subsequent to the date hereof. This presentation should not be
construed as legal, tax, investment or other advice.
Certain information and statements made in this presentation contain “forward-looking statements.” Such forward-looking statements can be
identified by the use of forward-looking terminology such as
“anticipate,”“believe,”“considering,”“depends,”“estimate,”“expect,”“intend,”“plan,” “planning, ”planned,” “project,” “trend,” and similar
expressions. All forward-looking statements are the Companies’ current expectation of future events and are subject to a number of factors
that could cause actual results to differ materially from those described in the forward-looking statements. Caution should be taken with
respect to such statements and you should not place undue reliance on any such forward-looking statements.
Certain industry and market data in this presentation was obtained from various trade associations, and the Companies have not verified such
data with independent sources. Accordingly, the Companies make no representations as to the accuracy or completeness of that data, and such
data involves risks and uncertainties and is subject to change based on various factors.
This presentation does not constitute an offer or invitation to purchase or subscribe for any shares or other securities of the Companies and
neither any part of this presentation nor any information or statement contained therein shall form the basis of or be relied upon in connection
with any contract or commitment whatsoever. Any decision to purchase shares in any offering of shares of the Companies should be made
solely on the basis of the information contained in the offering document which may be published or distributed in due course in connection
with any offering of shares of the Companies, if any.
2
Major Issues in 1H15
 Asset growth through Enhanced Business as a Captive Finance despite unfavorable market
conditions
 Laid foundations for better profitability through Asset Quality improvement and Bad Debt
Expense decrease, as a result of constant risk management.
 Overseas operation expansion through strengthened Global Business capabilities
3
Business Environment
Domestic Economy Domestic Auto Sales
Stagnant captive auto sales
• Strong sales recorded by Import auto makers
• Improvement expected in 2H through full model change of
best-sellers (HMC Avante, KMC K5 etc.)
(unit : *1,000)
Economic recovery delayed
• GDP growth rate lowered (Bank of Korea, ‘15. 7)
Low interest continued
• Competition intensified as funding cost gap narrows
2.0%
2.8%
3.3%
2.4%
2.75%
2.50%
2.00%
1.50%
2012 2013 2014 1H15
GDP growth rate Key rate
668 641 685
336
482 458 465
243
392 441 510
279
1,542 1,540 1,660
857
74.6%
71.4%
69.3%
67.5%
2012 2013 2014 1H15
HMC KMC Others HMG M/S
4
Asset
Asset Portfolio Business Strategies 2015
(unit: KRW bn)
2012 2013 2014 1H15 YTD
New car 11,000 10,510 10,472 10,832 3.4%
Auto lease 3,805 3,976 3,818 3,896 2.0%
Used car 1,410 1,484 1,464 1,418 -3.1%
P-loan 1,959 2,111 2,162 2,075 -4.0%
Mortgage 1,641 1,796 1,745 1,667 -4.5%
Auto-finance
• Competitiveness reinforced through OEM co-marketing
• Specialized products launch to meet customer needs
(PCP, Personal lease)
Personal-finance
• Strengthened marketing to target prime customers
 Reference : OEM co-marketing(unit: KRW bn)
Jan Interest lowered by 1% on all KMC vehicles
Mar Interest lowered by 1% on all HMC vehicles
KMC “Morning Coffee” promotion
HMC “KRW 100,000 Miracle – Avante”
promotion
May HMC interest-free on Sonata
16,214 15,970 15,754 16,146
4,070 4,428 4,569 4,590
20,285 20,397 20,323 20,735
79.9% 78.3% 77.5% 77.9%
2012 2013 2014 1H15
Auto asset Non-auto asset % of Auto asset
5
Profitability
① Excluding FX effects
② Including one-off disposal loss
Summary of Income Statement
2013 2014 1H14 1H15 YoY
Operating Rev①
2,915.1 2,745.9 1,355.6 1,328.2 -2.0%
Operating Exp①
2,486.8 2,423.8 1,212.0 1,121.3 -7.5%
Interest expense 800.6 752.6 387.3 336.2 -13.2%
Lease expense 505.9 500.5 250.1 250.3 0.1%
SG & A 671.7 702.3 321.2 360.1 12.1%
Bad debt expense 453.1 418.3 226.6 149.2 -34.2%
Operating Income 429.1 321.9 143.3 207.4 44.8%
Non-operating
Income
3.3 9.1 11.0 21.8 98.2%
Equity method
income
4.5 17.0 -20.9 19.1 TB
Net Income 391.4 237.7 85.1 173.9 104.3%
ROA 1.9% 1.3% 0.8%②
1.7% 0.9%p
Analysis on Income Statement
Operating Revenue
• Product interest lowered due to key rate drop
Operating Expense
• Interest expense decreased due to key rate drop
• Bad debt expense decreased due to asset quality
improvement
Net Income
• Equity method income increased due to stabilized
overseas operation
(unit: KRW bn)
6.8% 6.6% 6.0%
5.0%
2012 2013 2014 1H15
New car finance APR
6
Asset Quality
Delinquency Reserve
(unit: KRW bn)
2.5%
2.7%
2.4%
2.2%
1.0% 1.1% 1.0% 0.9%
2012 2013 2014 1H15
30+days delinquency ratio
30+days delinquency ratio (New car)
385 437 440 449
280
326 334 300
665
763 774 749
144.9%
154.4%
162.2% 163.4%
2012 2013 2014 1H15
Allowance Reserve 30+ days coverage
7
Capital Structure
Capital Adequacy RatioLeverage
① Based on previous quarter’s total capital since 2013
2012 2013 2014 1H15 YTD
Total Asset 21,885 22,369 22,508 22,682 0.8%
Total Capital① 3,031 3,400 3,395 3,502 3.2%
(unit: KRW bn)
2012 2013 2014 1H15 YTD
Adjusted
Total Asset
20,438 20,673 21,793 21,955 0.7%
Adjusted
Total Capital
2,954 3,130 3,346 3,552 6.2%
(Unit: KRW bn)
7.2X
6.6X 6.6X 6.5X
2012 2013 2014 1H15
14.5% 15.1% 15.4% 16.2%
2012 2013 2014 1H15
8
Domestic
bond
56.1%
Overseas
bond
22.0%
Domestic
ABS
9.3%
Overseas
ABS
3.9%
Loans
7.2%
CP
1.5%
Funding
Funding Portfolio by product Asset-Liability Maturity
2014 1H15
Total Funding 5,893 3,317
Bond 3,353 1,957
Domestic 2,510 1,511
Overseas 843 446
ABS 600 400
CP, Bank loan 1,940 960
2014 1H15
(unit: KRW bn)
Funding Guidelines
• Long-term debt : 60% or more
• By Product: ABS <20%, CP <10%
• ALM ratio : 100% or more
2.0yr 2.0yr
1.9yr
2.0yr
148.0%
142.0%
132.0%
139.2%
2012 2013 2014 1H15
Debt maturity ALM ratio
Domestic
bond
52.0%Overseas
bond
26.2%
Domestic
ABS
7.6%
Overseas
ABS
5.3%
Loans
7.8%
CP
1.1%
KRW
17.8tn
KRW
17.8tn
9
Liquidity
Liquidity Position Short-term debt Coverage
Contingency framework
• Early warning and response system in place
• Daily monitoring of key market indicators
(unit: KRW bn) (unit: KRW bn)
Liquidity Management
• Satisfies Basel III Liquidity coverage ratio
• Diversified Credit lines by lender and tenor
1,100 1,304 1,375 1,210
2,480 2,345 2,524 2,894
3,580 3,649 3,899 4,104
2012 2013 2014 1H15
Cash Credit line
5,176 4,953
5,790
4,889
69.2% 73.7%
67.3%
83.9%
2012 2013 2014 1H15
Short-term debt Short-term debt coverage ratio
10
Overseas Business
Overseas Operations
Country
(Corp. name)
Founded
Equity
structure
Financial Asset
(local currency)
(HCA)
1989.9
HMA 80%
KMA 20%
KRW 28.7tn
(USD 25.5bn)
(HCUK)
2012.2
HCS 29.99%
HMUK 10%
KMUK 10%
SCUK 50.01%
KRW 2.2tn
(GBP 1.3mn)
(BHAF)
2012.6
HCS 46%
HMC 14%
BAI 40%
KRW 2.5tn
(CNY 13.7bn)
(HCCA)
2014.4
HMC 60%
KMC 40%
KRW 216bn
(CAD 238mn)
Growth of Overseas Asset
(unit: KRW tn)
CAGR=36%
① FX rate as of 1H15-end
①
5
9
14
19
24
31
34
'09 '10 '11 '12 '13 '14 1H15
11
Appendix
Personal Lease Launch Certified Used Car Center Open
Reinforce Auto-finance Value chain
• Utilize systematically managed Lease-returned vehicles
• Manage Vehicles’ residual value efficiently
Initiate changes on vehicle “possession”
• Boost new car sales and shorten replacement period
• “Use” easy-to-manage cars on lower monthly payment
Further Information
IR Homepage: http://ir.hyundaicapital.com
IR email address: irhcs@hyundaicapital.com

20152 q캐피탈영문

  • 1.
  • 2.
    1 Disclaimer This presentation materialis being presented to you solely for your information only and may not be taken away by you and may not be reproduced, redistributed or passed on, directly or indirectly, to any other person or published, in whole or in part, for any purpose. These presentation materials have been prepared by Hyundai Capital Services., Inc. (“HCS or the Company”), solely for the use at this presentation and have not been independently verified. No representations or warranties, express or implied, are made as to, and no reliance should be placed on, the accuracy, fairness or completeness of the information presented or contained in this presentation. Neither the Companies nor any of theirs affiliates, advisers or representatives accepts any responsibility whatsoever for any loss or damage arising from any information presented or contained in this presentation. The information presented or contained in this presentation is current as of the date hereof and is subject to change without notice and its accuracy is not guaranteed. Neither the Companies nor any of their affiliates, advisers or representatives make any undertaking to update any such information subsequent to the date hereof. This presentation should not be construed as legal, tax, investment or other advice. Certain information and statements made in this presentation contain “forward-looking statements.” Such forward-looking statements can be identified by the use of forward-looking terminology such as “anticipate,”“believe,”“considering,”“depends,”“estimate,”“expect,”“intend,”“plan,” “planning, ”planned,” “project,” “trend,” and similar expressions. All forward-looking statements are the Companies’ current expectation of future events and are subject to a number of factors that could cause actual results to differ materially from those described in the forward-looking statements. Caution should be taken with respect to such statements and you should not place undue reliance on any such forward-looking statements. Certain industry and market data in this presentation was obtained from various trade associations, and the Companies have not verified such data with independent sources. Accordingly, the Companies make no representations as to the accuracy or completeness of that data, and such data involves risks and uncertainties and is subject to change based on various factors. This presentation does not constitute an offer or invitation to purchase or subscribe for any shares or other securities of the Companies and neither any part of this presentation nor any information or statement contained therein shall form the basis of or be relied upon in connection with any contract or commitment whatsoever. Any decision to purchase shares in any offering of shares of the Companies should be made solely on the basis of the information contained in the offering document which may be published or distributed in due course in connection with any offering of shares of the Companies, if any.
  • 3.
    2 Major Issues in1H15  Asset growth through Enhanced Business as a Captive Finance despite unfavorable market conditions  Laid foundations for better profitability through Asset Quality improvement and Bad Debt Expense decrease, as a result of constant risk management.  Overseas operation expansion through strengthened Global Business capabilities
  • 4.
    3 Business Environment Domestic EconomyDomestic Auto Sales Stagnant captive auto sales • Strong sales recorded by Import auto makers • Improvement expected in 2H through full model change of best-sellers (HMC Avante, KMC K5 etc.) (unit : *1,000) Economic recovery delayed • GDP growth rate lowered (Bank of Korea, ‘15. 7) Low interest continued • Competition intensified as funding cost gap narrows 2.0% 2.8% 3.3% 2.4% 2.75% 2.50% 2.00% 1.50% 2012 2013 2014 1H15 GDP growth rate Key rate 668 641 685 336 482 458 465 243 392 441 510 279 1,542 1,540 1,660 857 74.6% 71.4% 69.3% 67.5% 2012 2013 2014 1H15 HMC KMC Others HMG M/S
  • 5.
    4 Asset Asset Portfolio BusinessStrategies 2015 (unit: KRW bn) 2012 2013 2014 1H15 YTD New car 11,000 10,510 10,472 10,832 3.4% Auto lease 3,805 3,976 3,818 3,896 2.0% Used car 1,410 1,484 1,464 1,418 -3.1% P-loan 1,959 2,111 2,162 2,075 -4.0% Mortgage 1,641 1,796 1,745 1,667 -4.5% Auto-finance • Competitiveness reinforced through OEM co-marketing • Specialized products launch to meet customer needs (PCP, Personal lease) Personal-finance • Strengthened marketing to target prime customers  Reference : OEM co-marketing(unit: KRW bn) Jan Interest lowered by 1% on all KMC vehicles Mar Interest lowered by 1% on all HMC vehicles KMC “Morning Coffee” promotion HMC “KRW 100,000 Miracle – Avante” promotion May HMC interest-free on Sonata 16,214 15,970 15,754 16,146 4,070 4,428 4,569 4,590 20,285 20,397 20,323 20,735 79.9% 78.3% 77.5% 77.9% 2012 2013 2014 1H15 Auto asset Non-auto asset % of Auto asset
  • 6.
    5 Profitability ① Excluding FXeffects ② Including one-off disposal loss Summary of Income Statement 2013 2014 1H14 1H15 YoY Operating Rev① 2,915.1 2,745.9 1,355.6 1,328.2 -2.0% Operating Exp① 2,486.8 2,423.8 1,212.0 1,121.3 -7.5% Interest expense 800.6 752.6 387.3 336.2 -13.2% Lease expense 505.9 500.5 250.1 250.3 0.1% SG & A 671.7 702.3 321.2 360.1 12.1% Bad debt expense 453.1 418.3 226.6 149.2 -34.2% Operating Income 429.1 321.9 143.3 207.4 44.8% Non-operating Income 3.3 9.1 11.0 21.8 98.2% Equity method income 4.5 17.0 -20.9 19.1 TB Net Income 391.4 237.7 85.1 173.9 104.3% ROA 1.9% 1.3% 0.8%② 1.7% 0.9%p Analysis on Income Statement Operating Revenue • Product interest lowered due to key rate drop Operating Expense • Interest expense decreased due to key rate drop • Bad debt expense decreased due to asset quality improvement Net Income • Equity method income increased due to stabilized overseas operation (unit: KRW bn) 6.8% 6.6% 6.0% 5.0% 2012 2013 2014 1H15 New car finance APR
  • 7.
    6 Asset Quality Delinquency Reserve (unit:KRW bn) 2.5% 2.7% 2.4% 2.2% 1.0% 1.1% 1.0% 0.9% 2012 2013 2014 1H15 30+days delinquency ratio 30+days delinquency ratio (New car) 385 437 440 449 280 326 334 300 665 763 774 749 144.9% 154.4% 162.2% 163.4% 2012 2013 2014 1H15 Allowance Reserve 30+ days coverage
  • 8.
    7 Capital Structure Capital AdequacyRatioLeverage ① Based on previous quarter’s total capital since 2013 2012 2013 2014 1H15 YTD Total Asset 21,885 22,369 22,508 22,682 0.8% Total Capital① 3,031 3,400 3,395 3,502 3.2% (unit: KRW bn) 2012 2013 2014 1H15 YTD Adjusted Total Asset 20,438 20,673 21,793 21,955 0.7% Adjusted Total Capital 2,954 3,130 3,346 3,552 6.2% (Unit: KRW bn) 7.2X 6.6X 6.6X 6.5X 2012 2013 2014 1H15 14.5% 15.1% 15.4% 16.2% 2012 2013 2014 1H15
  • 9.
    8 Domestic bond 56.1% Overseas bond 22.0% Domestic ABS 9.3% Overseas ABS 3.9% Loans 7.2% CP 1.5% Funding Funding Portfolio byproduct Asset-Liability Maturity 2014 1H15 Total Funding 5,893 3,317 Bond 3,353 1,957 Domestic 2,510 1,511 Overseas 843 446 ABS 600 400 CP, Bank loan 1,940 960 2014 1H15 (unit: KRW bn) Funding Guidelines • Long-term debt : 60% or more • By Product: ABS <20%, CP <10% • ALM ratio : 100% or more 2.0yr 2.0yr 1.9yr 2.0yr 148.0% 142.0% 132.0% 139.2% 2012 2013 2014 1H15 Debt maturity ALM ratio Domestic bond 52.0%Overseas bond 26.2% Domestic ABS 7.6% Overseas ABS 5.3% Loans 7.8% CP 1.1% KRW 17.8tn KRW 17.8tn
  • 10.
    9 Liquidity Liquidity Position Short-termdebt Coverage Contingency framework • Early warning and response system in place • Daily monitoring of key market indicators (unit: KRW bn) (unit: KRW bn) Liquidity Management • Satisfies Basel III Liquidity coverage ratio • Diversified Credit lines by lender and tenor 1,100 1,304 1,375 1,210 2,480 2,345 2,524 2,894 3,580 3,649 3,899 4,104 2012 2013 2014 1H15 Cash Credit line 5,176 4,953 5,790 4,889 69.2% 73.7% 67.3% 83.9% 2012 2013 2014 1H15 Short-term debt Short-term debt coverage ratio
  • 11.
    10 Overseas Business Overseas Operations Country (Corp.name) Founded Equity structure Financial Asset (local currency) (HCA) 1989.9 HMA 80% KMA 20% KRW 28.7tn (USD 25.5bn) (HCUK) 2012.2 HCS 29.99% HMUK 10% KMUK 10% SCUK 50.01% KRW 2.2tn (GBP 1.3mn) (BHAF) 2012.6 HCS 46% HMC 14% BAI 40% KRW 2.5tn (CNY 13.7bn) (HCCA) 2014.4 HMC 60% KMC 40% KRW 216bn (CAD 238mn) Growth of Overseas Asset (unit: KRW tn) CAGR=36% ① FX rate as of 1H15-end ① 5 9 14 19 24 31 34 '09 '10 '11 '12 '13 '14 1H15
  • 12.
    11 Appendix Personal Lease LaunchCertified Used Car Center Open Reinforce Auto-finance Value chain • Utilize systematically managed Lease-returned vehicles • Manage Vehicles’ residual value efficiently Initiate changes on vehicle “possession” • Boost new car sales and shorten replacement period • “Use” easy-to-manage cars on lower monthly payment
  • 13.
    Further Information IR Homepage:http://ir.hyundaicapital.com IR email address: irhcs@hyundaicapital.com