- Hyundai Commercial Inc. presented its 3Q 2014 investor presentation which provided an overview of the company's financial performance and business strategies.
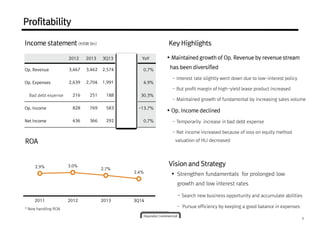
- While operating revenue grew slightly, operating income declined due to a temporary increase in bad debt expenses. Net income increased due to losses from equity investments.
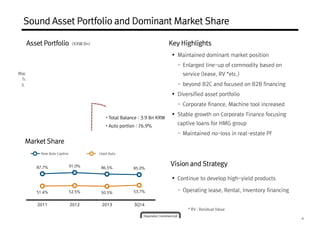
- The company maintained its dominant market share in commercial vehicle financing and focused on diversifying its asset portfolio and developing new high-yield products.
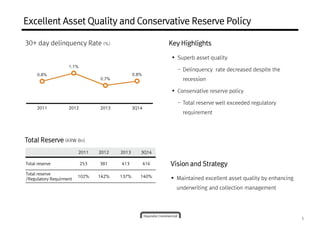
- It emphasized strengthening its fundamentals to prepare for a prolonged low growth, low interest rate environment through pursuing new business opportunities and efficiency.

![[Appendix 3] Fact Sheet - HCI
(Unit : KRW Bn, %) 2008 2009 2010 2011 2012 2013 3Q13 3Q14
Domestic Sales of
Commercial
Vehicles
Total (unit) 20,152 19,795 21,479 18,842 15,620 14,851 10,812 10,852
HMG M/S 54.0% 60.1% 64.2% 65.8% 62.3% 70.2% 67.7% 77.5%
Asset
Portfolio
Total 1,050 1,439 2,333 2,882 3,254 3,503 3,485 3,968
Auto Sector 77.8% 86.4% 85.4% 82.1% 80.7% 77.5% 79.3% 77.9%
Others 22.2% 13.6% 14.6% 17.9% 19.3% 22.5% 20.7% 22.1%
Asset
Quality
Substandard & Below 1.2% 0.7% 0.9% 1.2% 1.5% 1.1% 1.0% 2.7%
NPL 1.2% 0.6% 0.6% 1.0% 1.0% 1.0% 1.0% 0.5%
30+ Delinquency 2.1% 0.9% 1.0% 0.8% 1.1% 0.7% 0.6% 0.8%
NPL Coverage Ratio 140.8% 224.7% 172.5% 84.1% 114.8% 126.4% 132.4% 263.9%
Profitability Operating Income 14.1 27.6 57.5 86.4 82.8 75.9 58.3 50.3
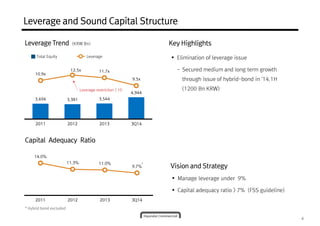
Asset & Capital Adequacy Ratio 7.8% 9.3% 10.1% 14.0% 11.3% 11.0% 10.9% 9.7%
Leverage Borrowing Leverage 13.5X 15.0X 16.1X 10.9X 12.5X 11.6X 11.7X 9.5X
Funding
Portfolio
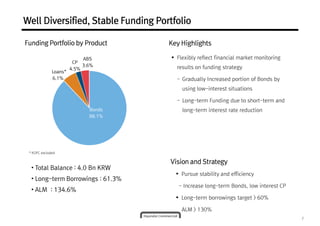
Total 998 1,481 2,477 3,026 3,464 3,663 3,659 4,039
Bond / Loan 91.1% 80.9% 78.9% 83.5% 85.0% 90.2% 86.8% 94.2%
CP/Asset backed
8.9% 19.1% 13.0% short-term bond
4.6% 6.1% 2.5% 5.0% 2.3%
ABS - - 8.1% 11.9% 8.9% 7.3% 8.1% 3.6%
Short-term debt
coverage
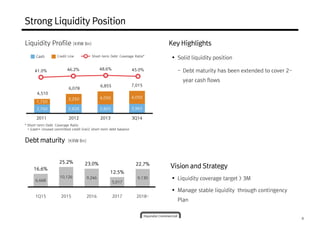
24.0% 13.8% 26.4% 41.0% 46.2% 48.6% 47.8% 45.0%
Debt
Maturity
ALM ratio 93.2% 105.5% 132.3% 143.0% 129.5% 132.4% 134.2% 129.7%
Asset maturity (Y) 1.33 1.30 1.28 1.27 1.28 1.27 1.29 1.37
Debt maturity (Y) 1.24 1.37 1.69 1.79 1.66 1.69 1.73 1.85
9](https://image.slidesharecdn.com/hci3q14eng-141208044459-conversion-gate02/85/Hci-3-q14_eng-9-320.jpg)


