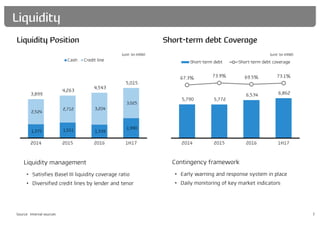
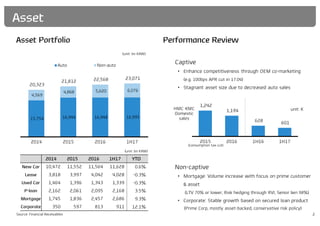
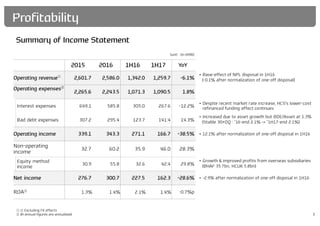
Hyundai Capital Services reported financial results for the first half of 2017. While total assets grew 3.4% to 25.9 trillion won, net income decreased 28.6% to 162.3 billion won due to one-time gains in the prior year period. Asset quality remained stable with the 30+ day delinquency ratio unchanged at 2.1% and the FSS requirement coverage ratio slightly decreased to 120.8%. Overseas subsidiaries continued growing, contributing 42.4 billion won in equity method income. Going forward, Hyundai Capital will focus on expanding its global operations and diversifying its funding sources.
![440 465 529 531
334 254 208 198
774 719 737 729
110.6%
124.0% 124.0%
120.8%
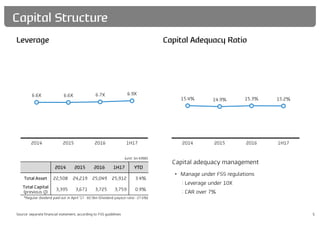
2014 2015 2016 1H17
Allowance Reserve FSS reruirement coverage
2.4%
1.9%
2.1% 2.1%
1.0%
0.7% 0.7% 0.7%
2014 2015 2016 1H17
30+ days DQ ratio New car 30+ days DQ ratio
②
4
Delinquency Reserves
Asset Quality
① Assets written off at 7th time overdue → 8th time overdue
② (Allowance + Reserves) / FSS requirement
Asset quality management
• Reinforced U/W led to asset quality improvement
Reserve policy
• Max of expected loss, incurred loss or FSS requirement
• [1H17] Slight decease of FSS requirement coverage
- Reinforced FSS required allowance amount
①
(unit: bn KRW)](https://image.slidesharecdn.com/hcse-170920003631/85/Hcs-e-5-320.jpg)
![53.5%
22.1%
9.6%
6.0%
6.6%
2.2%
Domestic Bond Overseas Bond Domestic ABS
Overseas ABS Bank Loan CP & ST debt
1.9yr 2.0yr 2.0yr
2.1yr
132.2% 129.8%
134.9%
145.2%
2014 2015 2016 1H17
Debt maturity ALM ratio
21.0tn
KRW
6
Funding Position Maturity
Funding
Source: Internal sources
Portfolio diversification
• Stable portfolio through product, maturity, currency
diversification
• [1H17]Overseas Bond: USD 600mn, AUD 400mn, EUR 400mn
Funding guidelines
• By product: ABS <20%, Short-term funding <10%
• ALM ratio: 100% or higher](https://image.slidesharecdn.com/hcse-170920003631/85/Hcs-e-7-320.jpg)