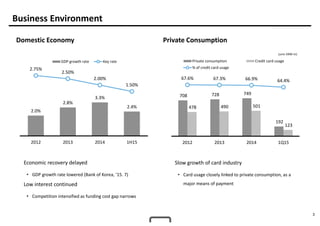
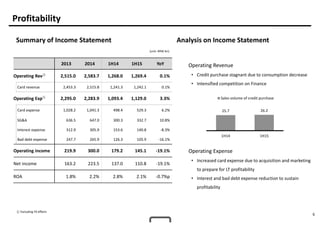
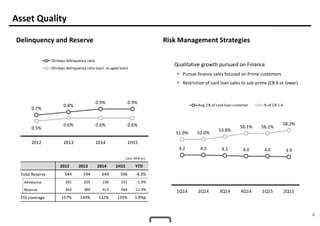
1H15 Earnings Release
Hyundai Card Corporation
1
Disclaimer
This presentation material is being presented to you solely for your information only and may not be taken away by you and may not be
reproduced, redistributed or passed on, directly or indirectly, to any other person or published, in whole or in part, for any purpose.
These presentation materials have been prepared by Hyundai Card Corporation., Ltd. (“HCC or the Company”), solely for the use at this
presentation and have not been independently verified. No representations or warranties, express or implied, are made as to, and no reliance
should be placed on, the accuracy, fairness or completeness of the information presented or contained in this presentation. Neither the
Companies nor any of theirs affiliates, advisers or representatives accepts any responsibility whatsoever for any loss or damage arising from any
information presented or contained in this presentation. The information presented or contained in this presentation is current as of the date
hereof and is subject to change without notice and its accuracy is not guaranteed. Neither the Companies nor any of their affiliates, advisers or
representatives make any undertaking to update any such information subsequent to the date hereof. This presentation should not be
construed as legal, tax, investment or other advice.
Certain information and statements made in this presentation contain “forward-looking statements.” Such forward-looking statements can be
identified by the use of forward-looking terminology such as
“anticipate,”“believe,”“considering,”“depends,”“estimate,”“expect,”“intend,”“plan,” “planning, ”planned,” “project,” “trend,” and similar
expressions. All forward-looking statements are the Companies’ current expectation of future events and are subject to a number of factors
that could cause actual results to differ materially from those described in the forward-looking statements. Caution should be taken with
respect to such statements and you should not place undue reliance on any such forward-looking statements.
Certain industry and market data in this presentation was obtained from various trade associations, and the Companies have not verified such
data with independent sources. Accordingly, the Companies make no representations as to the accuracy or completeness of that data, and such
data involves risks and uncertainties and is subject to change based on various factors.
This presentation does not constitute an offer or invitation to purchase or subscribe for any shares or other securities of the Companies and
neither any part of this presentation nor any information or statement contained therein shall form the basis of or be relied upon in connection
with any contract or commitment whatsoever. Any decision to purchase shares in any offering of shares of the Companies should be made
solely on the basis of the information contained in the offering document which may be published or distributed in due course in connection
with any offering of shares of the Companies, if any.
2
Major issues in 1H15
§ Focus on Member acquisition and management to prepare for enhanced profitability going-
forward
§ Maintain Stability and improve customer profile through finance product's qualitative growth
§ Secure Loyal members and strengthen New members’ lock-in through Differentiated branding
3
Business Environment
Domestic Economy Private Consumption
(unit: KRW tn)
Slow growth of card industry
• Card usage closely linked to private consumption, as a
major means of payment
Economic recovery delayed
• GDP growth rate lowered (Bank of Korea, ‘15. 7)
Low interest continued
• Competition intensified as funding cost gap narrows
2.0%
2.8%
3.3%
2.4%
2.75%
2.50%
2.00%
1.50%
2012 2013 2014 1H15
GDP growth rate Key rate
708 728 749
192
478 490 501
123
67.6% 67.3% 66.9% 64.4%
2012 2013 2014 1Q15
Private consumption Credit card usage
% of credit card usage
4
Asset
Asset Portfolio Business Strategies 2015
(unit: KRW tn)
2012 2013 2014 1H15 YTD
Lump sum 4,397 4,263 4,445 4,113 -7.5%
Installment 2,208 2,133 2,470 2,488 0.7%
Cash advance 940 849 838 785 -6.3%
Card loan 2,352 2,702 3,048 3,072 0.8%
(unit: KRW bn)
v Reference : E-mart E card
Strengthened New member Acquisition
• Focus on prime customer
• Expand recruiting channel strategic alliance with large
distribution company
Prime-focused Recruitment
• Provide customized benefits
• Mobile App integrating Card mgmt. and payment (1st in industry)
• Reinforce finance service marketing to prime customers
Creating a New Rule of Alliance
• SSG Point accumulated for all spending
• No hurdles e.g. Min. usage etc.
• Full line-up : check card to corporate card
→ Differentiated benefits and wide usage
6,605 6,396 6,915 6,601
3,292 3,552
3,885 3,857
9,898 9,947
10,800 10,458
66.7% 64.3% 64.0% 63.1%
2012 2013 2014 1H15
Credit purchase Finance % of Credit purchase
5
Profitability
(unit: KRW bn)
① Excluding FX effects
Summary of Income Statement
2013 2014 1H14 1H15 YoY
Operating Rev①
2,515.0 2,583.7 1,268.0 1,269.4 0.1%
Card revenue 2,453.3 2,515.8 1,241.3 1,242.1 0.1%
Operating Exp①
2,295.0 2,283.9 1,093.4 1,129.0 3.3%
Card expense 1,028.2 1,041.3 498.4 529.3 6.2%
SG&A 636.5 647.0 300.3 332.7 10.8%
Interest expense 312.9 305.9 153.6 140.8 -8.3%
Bad debt expense 247.7 265.9 126.3 105.9 -16.1%
Operating income 219.9 300.0 179.2 145.1 -19.1%
Net income 163.2 223.5 137.0 110.8 -19.1%
ROA 1.8% 2.2% 2.8% 2.1% -0.7%p
Analysis on Income Statement
Operating Revenue
• Credit purchase stagnant due to consumption decrease
• Intensified competition on Finance
Operating Expense
• Increased card expense due to acquisition and marketing
to prepare for LT profitability
• Interest and bad debt expense reduction to sustain
profitability
25.7 26.2
1H14 1H15
Sales volume of credit purchase
6
Asset Quality
Delinquency and Reserve Risk Management Strategies
2012 2013 2014 1H15 YTD
Total Reserve 544 594 649 596 -8.3%
Allowance 181 205 236 231 -1.9%
Reserve 363 389 413 364 -11.9%
FSS coverage 157% 144% 132% 133% 1.0%p
Qualitative growth pursued on Finance
• Pursue finance sales focused on Prime customers
• Restriction of card loan sales to sub-prime (CB 8 or lower)
(unit: KRW bn)
0.7%
0.8%
0.9% 0.9%
0.5%
0.6% 0.6% 0.6%
2012 2013 2014 1H15
30+days delinquency ratio
30+days delinquency ratio (excl. re-aged loan)
4.2 4.2 4.1 4.0 4.0 3.9
51.9% 52.0%
53.8%
56.1% 56.1%
58.2%
1Q14 2Q14 3Q14 4Q14 1Q15 2Q15
Avg. CB of card loan customer % of CB 1-4
7
Capital Structure
Leverage
① Based on previous quarter’s total capital since 2013
2012 2013 2014 1H15 YTD
Total Asset 11,252 11,521 12,397 12,112 -2.3%
Total Capital① 2,192 2,325 2,549 2,615 2.6%
(Unit: KRW bn)
Capital Adequacy Ratio
2012 2013 2014 1H15 YTD
Adjusted
Total Asset
9,638 9,616 11,273 10,928 -3.1%
Adjusted
Total Capital
1,801 1,869 2,048 2,198 7.4%
(unit: KRW bn)
5.1X 5.0X 4.9X 4.6X
2012 2013 2014 1H15
18.7% 19.4%
18.2%
20.1%
2012 2013 2014 1H15
8
Funding
Funding Portfolio by product Asset-Liability Maturity
2014 1H15
Total Funding 3,584 900
Bond 1,820 540
ABS 604 -
others 1,160 360
(unit: KRW bn)
Funding Portfolio Guidelines
• Long-term debt : 60% or more
• By Product: ABS <20%, CP <10%
• ALM ratio : 100% or more
Domestic
bond
87.6%
Domestic
ABS
4.0%
Overseas
ABS
5.0%
Loans
2.7%
CP
0.7%
2014 1H15
1.8yr
2.1yr 2.1yr
1.9yr
133.4%
158.7%
137.9% 140.7%
2012 2013 2014 1H15
Debt maturity ALM ratio
Domestic
bond
84.2%
Domestic
ABS
3.8%
Overseas
ABS
9.5%
Loans
2.5%
KRW
7.9tn
KRW
7.5tn
9
Liquidity
Liquidity Position Short-term debt Coverage
Contingency framework
• Early warning and response system in place
• Daily monitoring of key market indicators
(unit: KRW bn)
Liquidity Management
• Satisfies Basel III Liquidity coverage ratio
• Diversified Credit lines by lender and tenor
(unit: KRW bn)
690 780 810 973
824
866
490
490
1,514
1,646
1,300
1,463
2012 2013 2014 1H15
Cash Credit line
2,311
1,881 2,083 2,103
65.5%
87.5%
62.4%
69.6%
2012 2013 2014 1H15
Short-term debt Short-term debt coverage ratio
10
Branding Progress
2013.2
Design Library
2015.5
Music Library + UNDERSTAGE
Hyundai card Library Card Factory
2014.4
Travel Library
Visualize financial capital through industrial capital
• Demonstrates manufacturing process of “Card”, the most
advanced currency
• Design motifs on Industrial Revolution
• Provides user experience of actual card issuance
Further Information
IR Homepage: http://ir.hyundaicard.com
IR email address: irhcc@hyundaicard.com

1 h15 hcc_presentation_eng_v4

  • 1.
  • 2.
    1 Disclaimer This presentation materialis being presented to you solely for your information only and may not be taken away by you and may not be reproduced, redistributed or passed on, directly or indirectly, to any other person or published, in whole or in part, for any purpose. These presentation materials have been prepared by Hyundai Card Corporation., Ltd. (“HCC or the Company”), solely for the use at this presentation and have not been independently verified. No representations or warranties, express or implied, are made as to, and no reliance should be placed on, the accuracy, fairness or completeness of the information presented or contained in this presentation. Neither the Companies nor any of theirs affiliates, advisers or representatives accepts any responsibility whatsoever for any loss or damage arising from any information presented or contained in this presentation. The information presented or contained in this presentation is current as of the date hereof and is subject to change without notice and its accuracy is not guaranteed. Neither the Companies nor any of their affiliates, advisers or representatives make any undertaking to update any such information subsequent to the date hereof. This presentation should not be construed as legal, tax, investment or other advice. Certain information and statements made in this presentation contain “forward-looking statements.” Such forward-looking statements can be identified by the use of forward-looking terminology such as “anticipate,”“believe,”“considering,”“depends,”“estimate,”“expect,”“intend,”“plan,” “planning, ”planned,” “project,” “trend,” and similar expressions. All forward-looking statements are the Companies’ current expectation of future events and are subject to a number of factors that could cause actual results to differ materially from those described in the forward-looking statements. Caution should be taken with respect to such statements and you should not place undue reliance on any such forward-looking statements. Certain industry and market data in this presentation was obtained from various trade associations, and the Companies have not verified such data with independent sources. Accordingly, the Companies make no representations as to the accuracy or completeness of that data, and such data involves risks and uncertainties and is subject to change based on various factors. This presentation does not constitute an offer or invitation to purchase or subscribe for any shares or other securities of the Companies and neither any part of this presentation nor any information or statement contained therein shall form the basis of or be relied upon in connection with any contract or commitment whatsoever. Any decision to purchase shares in any offering of shares of the Companies should be made solely on the basis of the information contained in the offering document which may be published or distributed in due course in connection with any offering of shares of the Companies, if any.
  • 3.
    2 Major issues in1H15 § Focus on Member acquisition and management to prepare for enhanced profitability going- forward § Maintain Stability and improve customer profile through finance product's qualitative growth § Secure Loyal members and strengthen New members’ lock-in through Differentiated branding
  • 4.
    3 Business Environment Domestic EconomyPrivate Consumption (unit: KRW tn) Slow growth of card industry • Card usage closely linked to private consumption, as a major means of payment Economic recovery delayed • GDP growth rate lowered (Bank of Korea, ‘15. 7) Low interest continued • Competition intensified as funding cost gap narrows 2.0% 2.8% 3.3% 2.4% 2.75% 2.50% 2.00% 1.50% 2012 2013 2014 1H15 GDP growth rate Key rate 708 728 749 192 478 490 501 123 67.6% 67.3% 66.9% 64.4% 2012 2013 2014 1Q15 Private consumption Credit card usage % of credit card usage
  • 5.
    4 Asset Asset Portfolio BusinessStrategies 2015 (unit: KRW tn) 2012 2013 2014 1H15 YTD Lump sum 4,397 4,263 4,445 4,113 -7.5% Installment 2,208 2,133 2,470 2,488 0.7% Cash advance 940 849 838 785 -6.3% Card loan 2,352 2,702 3,048 3,072 0.8% (unit: KRW bn) v Reference : E-mart E card Strengthened New member Acquisition • Focus on prime customer • Expand recruiting channel strategic alliance with large distribution company Prime-focused Recruitment • Provide customized benefits • Mobile App integrating Card mgmt. and payment (1st in industry) • Reinforce finance service marketing to prime customers Creating a New Rule of Alliance • SSG Point accumulated for all spending • No hurdles e.g. Min. usage etc. • Full line-up : check card to corporate card → Differentiated benefits and wide usage 6,605 6,396 6,915 6,601 3,292 3,552 3,885 3,857 9,898 9,947 10,800 10,458 66.7% 64.3% 64.0% 63.1% 2012 2013 2014 1H15 Credit purchase Finance % of Credit purchase
  • 6.
    5 Profitability (unit: KRW bn) ①Excluding FX effects Summary of Income Statement 2013 2014 1H14 1H15 YoY Operating Rev① 2,515.0 2,583.7 1,268.0 1,269.4 0.1% Card revenue 2,453.3 2,515.8 1,241.3 1,242.1 0.1% Operating Exp① 2,295.0 2,283.9 1,093.4 1,129.0 3.3% Card expense 1,028.2 1,041.3 498.4 529.3 6.2% SG&A 636.5 647.0 300.3 332.7 10.8% Interest expense 312.9 305.9 153.6 140.8 -8.3% Bad debt expense 247.7 265.9 126.3 105.9 -16.1% Operating income 219.9 300.0 179.2 145.1 -19.1% Net income 163.2 223.5 137.0 110.8 -19.1% ROA 1.8% 2.2% 2.8% 2.1% -0.7%p Analysis on Income Statement Operating Revenue • Credit purchase stagnant due to consumption decrease • Intensified competition on Finance Operating Expense • Increased card expense due to acquisition and marketing to prepare for LT profitability • Interest and bad debt expense reduction to sustain profitability 25.7 26.2 1H14 1H15 Sales volume of credit purchase
  • 7.
    6 Asset Quality Delinquency andReserve Risk Management Strategies 2012 2013 2014 1H15 YTD Total Reserve 544 594 649 596 -8.3% Allowance 181 205 236 231 -1.9% Reserve 363 389 413 364 -11.9% FSS coverage 157% 144% 132% 133% 1.0%p Qualitative growth pursued on Finance • Pursue finance sales focused on Prime customers • Restriction of card loan sales to sub-prime (CB 8 or lower) (unit: KRW bn) 0.7% 0.8% 0.9% 0.9% 0.5% 0.6% 0.6% 0.6% 2012 2013 2014 1H15 30+days delinquency ratio 30+days delinquency ratio (excl. re-aged loan) 4.2 4.2 4.1 4.0 4.0 3.9 51.9% 52.0% 53.8% 56.1% 56.1% 58.2% 1Q14 2Q14 3Q14 4Q14 1Q15 2Q15 Avg. CB of card loan customer % of CB 1-4
  • 8.
    7 Capital Structure Leverage ① Basedon previous quarter’s total capital since 2013 2012 2013 2014 1H15 YTD Total Asset 11,252 11,521 12,397 12,112 -2.3% Total Capital① 2,192 2,325 2,549 2,615 2.6% (Unit: KRW bn) Capital Adequacy Ratio 2012 2013 2014 1H15 YTD Adjusted Total Asset 9,638 9,616 11,273 10,928 -3.1% Adjusted Total Capital 1,801 1,869 2,048 2,198 7.4% (unit: KRW bn) 5.1X 5.0X 4.9X 4.6X 2012 2013 2014 1H15 18.7% 19.4% 18.2% 20.1% 2012 2013 2014 1H15
  • 9.
    8 Funding Funding Portfolio byproduct Asset-Liability Maturity 2014 1H15 Total Funding 3,584 900 Bond 1,820 540 ABS 604 - others 1,160 360 (unit: KRW bn) Funding Portfolio Guidelines • Long-term debt : 60% or more • By Product: ABS <20%, CP <10% • ALM ratio : 100% or more Domestic bond 87.6% Domestic ABS 4.0% Overseas ABS 5.0% Loans 2.7% CP 0.7% 2014 1H15 1.8yr 2.1yr 2.1yr 1.9yr 133.4% 158.7% 137.9% 140.7% 2012 2013 2014 1H15 Debt maturity ALM ratio Domestic bond 84.2% Domestic ABS 3.8% Overseas ABS 9.5% Loans 2.5% KRW 7.9tn KRW 7.5tn
  • 10.
    9 Liquidity Liquidity Position Short-termdebt Coverage Contingency framework • Early warning and response system in place • Daily monitoring of key market indicators (unit: KRW bn) Liquidity Management • Satisfies Basel III Liquidity coverage ratio • Diversified Credit lines by lender and tenor (unit: KRW bn) 690 780 810 973 824 866 490 490 1,514 1,646 1,300 1,463 2012 2013 2014 1H15 Cash Credit line 2,311 1,881 2,083 2,103 65.5% 87.5% 62.4% 69.6% 2012 2013 2014 1H15 Short-term debt Short-term debt coverage ratio
  • 11.
    10 Branding Progress 2013.2 Design Library 2015.5 MusicLibrary + UNDERSTAGE Hyundai card Library Card Factory 2014.4 Travel Library Visualize financial capital through industrial capital • Demonstrates manufacturing process of “Card”, the most advanced currency • Design motifs on Industrial Revolution • Provides user experience of actual card issuance
  • 12.
    Further Information IR Homepage:http://ir.hyundaicard.com IR email address: irhcc@hyundaicard.com