Download to read offline


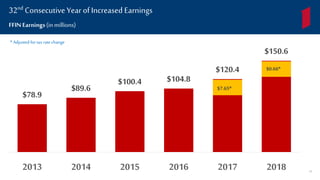
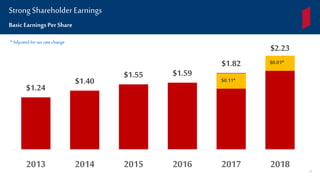
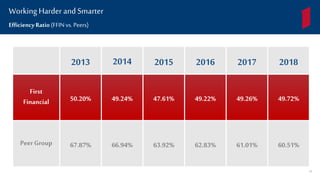
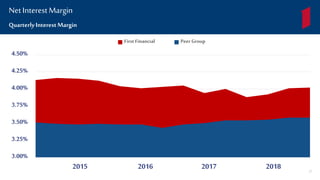
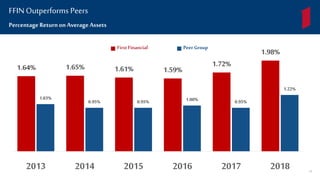
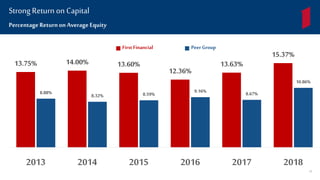
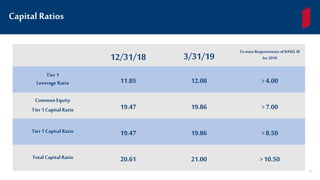
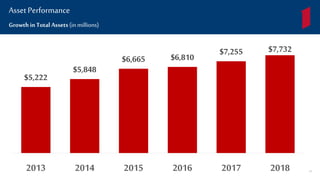
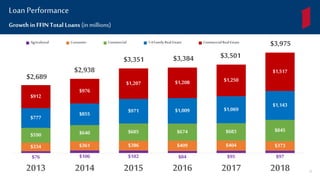
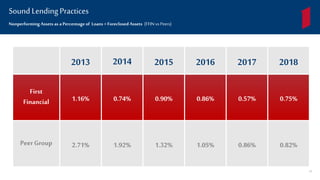
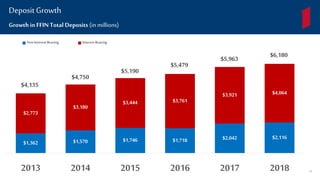
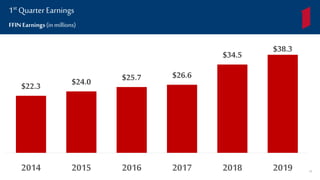
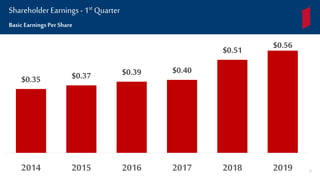
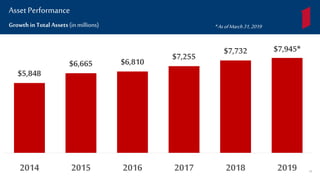
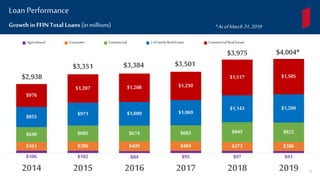
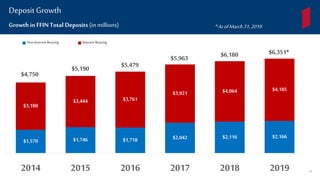


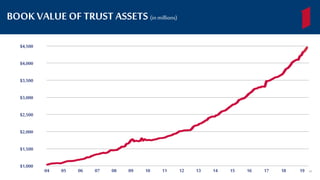


The document provides information about First Financial Bank's executive management team, board of directors, and financial performance in 2018 and the first quarter of 2019. It summarizes that First Financial had strong earnings growth, outperforming its peers in key metrics like return on assets and equity. Total assets, loans, and deposits all increased significantly from 2013 to 2018.


