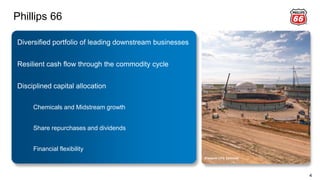
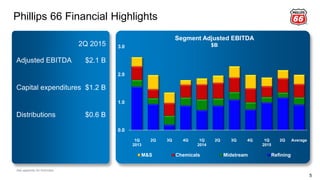
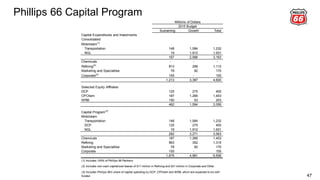
SlideShare a Scribd company logo
1 of 62
Download to read offline
Investor Update
Second Quarter 2015
Investor Update
Second Quarter 2015
Execution
NYSE: PSX
www.phillips66.com
Cautionary Statement
3
This presentation contains certain forward-looking statements within the meaning of Section 27A of the Securities Act of 1933, as amended, and
Section 21E of the Securities Exchange Act of 1934, as amended, which are intended to be covered by the safe harbors created thereby. Words
and phrases such as “is anticipated,” “is estimated,” “is expected,” “is planned,” “is scheduled,” “is targeted,” “believes,” “intends,” “objectives,”
“projects,” “strategies” and similar expressions are used to identify such forward-looking statements. However, the absence of these words does
not mean that a statement is not forward-looking. Forward-looking statements relating to Phillips 66’s operations (including joint venture
operations) are based on management’s expectations, estimates and projections about the company, its interests and the energy industry in
general on the date this presentation was prepared. These statements are not guarantees of future performance and involve certain risks,
uncertainties and assumptions that are difficult to predict. Therefore, actual outcomes and results may differ materially from what is expressed or
forecast in such forward-looking statements. Factors that could cause actual results or events to differ materially from those described in the
forward-looking statements include fluctuations in NGL, crude oil and natural gas prices, and petrochemical and refining margins; unexpected
changes in costs for constructing, modifying or operating our facilities; unexpected difficulties in manufacturing, refining or transporting our
products; lack of, or disruptions in, adequate and reliable transportation for our NGL, crude oil, natural gas and refined products; potential liability
from litigation or for remedial actions, including removal and reclamation obligations, under environmental regulations; limited access to capital or
significantly higher cost of capital related to illiquidity or uncertainty in the domestic or international financial markets; and other economic,
business, competitive and/or regulatory factors affecting Phillips 66’s businesses generally as set forth in our filings with the Securities and
Exchange Commission. Phillips 66 is under no obligation (and expressly disclaims any such obligation) to update or alter its forward-looking
statements, whether as a result of new information, future events or otherwise.
This presentation includes non-GAAP financial measures. You can find the reconciliations to comparable GAAP financial measures at the end of
the presentation materials or in the “Investors” section of our website.
Phillips 66
4
Diversified portfolio of leading downstream businesses
Resilient cash flow through the commodity cycle
Disciplined capital allocation
Chemicals and Midstream growth
Share repurchases and dividends
Financial flexibility
Freeport LPG Terminal
0.0
1.0
2.0
3.0
1Q
2013
2Q 3Q 4Q 1Q
2014
2Q 3Q 4Q 1Q
2015
2Q Average
M&S Chemicals Midstream Refining
Segment Adjusted EBITDA
$B
Phillips 66 Financial Highlights
5
Adjusted EBITDA
Capital expenditures
Distributions
2Q 2015
$2.1 B
$1.2 B
$0.6 B
See appendix for footnotes.
Operating Excellence
6
Industry Average
Total Recordable Rates
Incidents per 200,000 Hours Worked
’08 ’10 ’12 ’14
880
450 430 300
2008 2010 2012 2014
Refining Environmental Metrics
93% 90% 93% 94%
2008 2010 2012 2014
Refining Capacity Utilization
%
6.5 5.5 5.7 5.8
0.3
2008 2010 2012 2014
Midstream Growth
Operating Costs and SG&A
$B
Phillips 66 CPChem DCP
See appendix for footnotes.
Energy Landscape
7
Historical and Forward Crude Oil Prices
$/bbl
Markets seeking balance
Global economic boost from
lower energy prices should
stimulate demand
Reduced E&P investment slows
U.S. infrastructure growth
Source: Bloomberg
0
30
60
90
120
2009 2011 2013 2015 2017
Brent
WTI
Segment Strategy
8
Refining:
Enhance Returns
Midstream: Growth Chemicals: Growth Marketing and
Specialties:
Selective Growth
Execute Sweeny hub
Grow integrated
Transportation system
PSXP as a funding vehicle
Expand DCP G&P
Pursue organic and M&A
opportunities
Grow CPChem organically
Advance olefins and
polyolefins projects
Capitalize on domestic
feedstock advantage
Leverage proprietary
technology
Optimize crude slate
Expand export capability
Increase yields
Maintain cost discipline
Enhance portfolio
Expand European retail
marketing
Grow lubricants
Ensure domestic refinery
pull-through
2018E EBITDA2014 EBITDA
Fee Based Market Based
Midstream
9
NGL
NGL fractionation capacity growing to
200 MBD
Fractionator One start up 3Q 2015
LPG export facility start up 4Q 2016
Transportation
Beaumont crude/products hub
Bakken to Patoka/Beaumont pipelines
Bayou Bridge Pipeline
DCP EBITDA excluded.
See appendix for additional footnotes.
0.3
1.1
0.7
0.9
0.4
1.2
PSXP 2Q 2015 Run-Rate
EBITDA
PSX Operating Assets Projects Under
Construction
Planned Run Rate EBITDA
10
Midstream EBITDA Growth
$B
DCP EBITDA excluded.
See appendix for additional footnotes.
2018E and in-flight
projects
~ 2.3
PSXP
EBITDA
EBITDA
Remaining
at PSX
Phillips 66 Partners Growth
Fee-based business model
Growing cash flows
30% distribution CAGR through 2018
Funding Midstream growth
11
0.3
1.1
1.9
8 - 10
2Q 2015 2018E 2Q 2015 2018E
Dropdown
Proceeds
Distributions
$B
Run-Rate Annual
EBITDA
Cumulative Cash to PSX
since IPO
See appendix for footnotes.
DCP Midstream
12
Major U.S. midstream business
Largest NGL producer
Largest natural gas processing company
Third largest NGL pipeline operator
Footprint of strategically integrated assets
Growing gathering and processing business
Chemicals Environment
13
Narrowing spread of ethane/LPG
feedstocks
Record 2014 ethane chain margins,
expect good chain margins to
continue
Expect high operating rates
Global Ethylene Production
Cost Supply Curve$/MT
0
100
200
300
400
500
600
700
800
900
0 2 4 6 8 10 12
M.E.
Ethane
N.A.
LPG
N.A.
Ethane
M.E. LPG/
Naphtha
Rest of
World
N.A.
Naphtha
Asia
Naphtha
Asia
LPG
W. Europe
LPG
W. Europe
Naphtha
Production MM Tons
Source: Chief Economist Office; Wood Mackenzie.
CPChem
14
Leading petrochemical company
Feedstock advantaged
10.5 B Lb/yr worldwide ethylene capacity
Strong global aromatics position
USGC Petrochemicals project on track
$6 B estimated capital spend
50% complete, start-up 2Q 2017
3.3 B Lb/yr ethane cracker
2.2 B Lb/yr polyethylene production
Self-funded capital program
$1.3 - 1.6 B/yr incremental EBITDA by 2018
$1.3 – $1.6 B estimated incremental EBITDA based on 2012 industry margins.
See appendix for additional footnotes.
Phillips 66 Chemicals Adjusted ROCE
0%
5%
10%
15%
20%
25%
30%
35%
2009 2010 2011 2012 2013 2014
Range of peer ROCE Phillips 66 Chemicals Adjusted ROCE
Atlantic
Basin/Europe
588 MBD
Gulf Coast
738 MBD
Central
Corridor
492 MBD
West Coast
360 MBD
Light/
Medium
Heavy
Worldwide
Refining
15
Optimizing crude slate
Improving yields
Expanding export capability
Managing costs
Enhancing portfolio
2.2 MMBD Global Refining Capacity
0.0
0.5
1.0
1.5
2009 2010 2011 2012 2013 2014
U.S. Marketing International Marketing Specialties
Marketing and Specialties
16
High-returning businesses
U.S. Marketing
Wholesale network
~8,600 branded sites
International Marketing
Low-cost, high-volume business
~1,520 sites
Specialties
Finished lubricants
Base oil joint venture
Adjusted EBITDA
$B
Avg. $1.2 B
6.4
8.4
2009-2014 Avg. 2018E
Refining Midstream Chemicals M&S
EBITDA Growth
17
Segment Adjusted EBITDA
$B
More than 30% EBITDA growth
Cash flows less volatile by 2018E
2018E portfolio shift to higher-value
businesses
20% Midstream
25% Chemicals
40% Refining
15% Marketing & Specialties
Corporate not included in bars on chart, but included in totals.
Midstream EBITDA reflects Phillips 66’s ownership percentage of PSXP
Financial Strategy
18
Ensuring financial flexibility
Investment grade credit rating
Adequate liquidity
Funding transformational growth
Cash from operations
Dropdowns to PSXP
Returning capital to shareholders
Dividend growth
Ongoing share repurchases
Distributions
Reinvestment
2014E – 2016E
2015 Capital Budget
19
PSX Sustaining Refining Returns
M&S Growth Midstream Growth
PSXP Growth
$3.4 B Growth capital
Sweeny Fractionator One
LPG Export Terminal
Bakken to Patoka/Beaumont pipelines
Beaumont Terminal expansion
$0.2 B for PSXP projects
$1.2 B Sustaining capital
Distributions
20
Dividend Growth
Quarterly ¢/share
Share Count and Capital Returned
180% dividend growth
624 MM
590 MM
538 MM
$7.0 B
$1.4 B remaining authorized share repurchases
3Q
2012
4Q
2013
2Q
2015
3Q
2012
2Q
2015
20
56
4Q
2013
See appendix for footnotes.
Midstream PSXP Chemicals M&S Refining
Creating Value
21
Enterprise Value
2014 2018E
Uniquely positioned portfolio
Disciplined capital allocation
More than 30% EBITDA growth
Multiple expansion
Commitment to distributions
Strong balance sheet
Institutional Investors Contact
Kevin Mitchell
Vice President, Investor Relations
C.W. Mallon
Manager, Investor Relations
InvestorRelations@p66.com
832-765-2297
Investor Update
August 2015
NYSE: PSXP
www.phillips66partners.com
Cautionary Statement
24
This presentation contains forward-looking statements as defined under the federal securities laws, including projections, plans and
objectives. Although Phillips 66 Partners believes that expectations reflected in such forward-looking statements are reasonable, no
assurance can be given that such expectations will prove to be correct. In addition, these statements are subject to certain risks,
uncertainties and other assumptions that are difficult to predict and may be beyond Phillips 66 Partners’ control. If one or more of these
risks or uncertainties materialize, or if underlying assumptions prove incorrect, actual results may vary materially from what Phillips 66
Partners anticipated, estimated, projected or expected. The key risk factors that may have a direct bearing on the forward-looking
statements in the presentation are the accuracy of our assumptions used to estimate the benefits to be realized from Phillips 66
Partners’ acquisition of interests in certain joint ventures that own or control midstream pipeline assets (the “acquisition”), our ability to
successfully integrate the assets into our operations, the decisions made by Explorer Pipeline Company, DCP Sand Hills Pipeline, LLC,
and DCP Southern Hills Pipeline, LLC regarding distributions these entities make to us as an equity owner, and other factors as
described in the filings that Phillips 66 Partners makes with the Securities and Exchange Commission. In light of these risks,
uncertainties and assumptions, the events described in the forward-looking statements might not occur or might occur to a different
extent or at a different time than as described. All forward-looking statements in this presentation are made as of the date hereof and
Phillips 66 Partners undertakes no obligation to publicly update or revise any forward-looking statements, whether as a result of new
information, future events or otherwise. This presentation is not, and under no circumstance is to be construed to be, a prospectus,
offering memorandum, or advertisement and is not an offer to sell securities. The SEC and state securities regulators have not
reviewed or determined if this presentation is truthful or complete.
Non-GAAP Financial Measure Disclosure
Today’s presentation includes certain non-GAAP financial measures as defined under Regulation G of the Securities Exchange Act of
1934, as amended. A reconciliation of those measures to the most directly comparable GAAP measures is available in the appendix to
this presentation.
Phillips 66 Partners Ownership Structure
25
Phillips 66 Partners GP LLC
(PSXP General Partner)
General Partner Units
IDRs
Operating Subsidiaries
PSXP Public
Unitholders
(NYSE: PSX)
(NYSE: PSXP)
100% ownership
interest
29% limited partner
interest
Joint Ventures
2% general
partner interest
69% limited partner
interest
Phillips 66 Partners
26
Strong alignment with Phillips 66
Highly integrated assets
Stable and predictable cash flows
Significant growth potential
Financial flexibility
Pecan Grove Marine Dock
Phillips 66 Partners Financial Highlights
27
Distributable cash flow
Adjusted EBITDA
Acquired interest in three pipeline
assets in Q1 2015
$47.8 MM
$57.0 MM
0.2125 0.2248
0.2743
0.3017
0.3168
0.34
0.37
0.40
0.10
0.15
0.20
0.25
0.30
0.35
0.40
0.45
3Q 2013 4Q 2013 1Q 2014 2Q 2014 3Q 2014 4Q 2014 1Q 2015 2Q 2015
*
(MQD)
Coverage
Ratio
1.13x 1.10x 1.10x 1.44x 1.32x 1.28x 1.14x 1.15x
Distribution / LP Unit ($)
* Represents the minimum quarterly distribution for 3Q 2013, actual distribution of $0.1548 equal to MQD prorated
See appendix for footnotes.
2Q 2015
Q1 2015 Acquisition
28
Drop down assets
33.3% interest in Sand Hills NGL pipeline
33.3% interest in Southern Hills NGL pipeline
19.5% interest in Explorer refined products pipeline
$1.1 B acquisition
Asset-level 2015E EBITDA of $115 million
Implied 9.5x purchase multiple on assets’ 2015E EBITDA
Assets supported by long-term, fee-based
agreements, primarily under take-or-pay terms
Additional organic growth opportunities through
identified expansion projects
29
$275 MM In Announced Organic Growth
Cross-Channel
Connector Pipeline
Eagle Ford Crude
Gathering System
Bakken Joint Ventures
• Capital cost: $22 MM
• Increases access to export docks for shippers in Houston Ship Channel
• Expected completion in 4Q 2015
• Capital cost: $50 MM
• Connects Eagle Ford crude oil production to third-party pipelines
• Initial operations commenced January 2015; expected completion in 3Q 2015
• Capital cost: $160 MM (PSXP share)
• 100 MBD Palermo crude oil rail-loading facility, 76-mile Sacagawea Pipeline and
central delivery facility for gathering systems
• Provides increased logistics options for shippers in the Bakken region
• Expected terminal completion in 4Q 2015; pipeline completion in 2016
Sand Hills Pipeline
• Capital cost: ~ $45 MM (PSXP share)
• Adding lateral connections and increasing pumping capacity beyond 200 MBD
See appendix for footnotes.
30
Highly Integrated Assets
Palermo Rail Terminal expected to be operational Q4 2015.
31
Fee-based, Long-term contracts provide stability
Asset Initial Term (years) Maximum Term with Options (years)
Clifton Ridge to Lake Charles 10 20
Sweeny to Pasadena 10 20
Hartford Connector 23 * 23
Gold Line 10 15
Sand Hills 15 15
Southern Hills 15 15
Explorer Various Various
Clifton Ridge terminal 5 20
Clifton Ridge / Pecan grove docks 5 20
Pasadena terminal 5 20
Pasadena and Hartford truck racks 5 20
Gold Line terminals 5 15
Medford Spheres 10 20
Bayway Rail Rack 10 20
Ferndale Rail Rack 10 20
* Includes PSX JV Wood River Refinery to Hartford and Hartford to Explorer pipelines. The term of the Hartford Connector throughput and deficiency agreement began in January 2008
PipelinesTerminals/Storage
Adjusted EBITDA and DCF
32
34.3 33.4
37.2
41.9
47.8
Q2 2014 Q3 2014 Q4 2014 Q1 2015 Q2 2015
Distributable Cash Flow ($MM)
37.6 35.9
43.7
49.0
57.0
Q2 2014 Q3 2014 Q4 2014 Q1 2015 Q2 2015
Adjusted EBITDA ($MM)
Balanced Debt Maturity Profile
33
2020 2025 2045
5-year notes
2.646% coupon
10-year notes
3.605% coupon
30-year notes
4.68% coupon
$1.1 B debt issuance February 2015
5-Year $300 MM notes
10-Year $500 MM notes
30-Year $300 MM notes
Average cost of 3.64%
BBB (stable) / Baa3 (stable)
$300MM
$500MM
$300MM
Financial Flexibility
34
Investment grade credit rating
Target 3.5x debt / EBITDA
30% distribution CAGR through 2018
Target 1.1x annual coverage ratio
Support Phillips 66 Midstream growth
Closed 1st
acquisition -
$700 MM
Closed 2nd
acquisition -
$340 MM
-30%
-10%
10%
30%
50%
70%
90%
110%
130%
150%
170%
190%
210%
230%
250%
Jul-13 Sep-13 Nov-13 Jan-14 Mar-14 May-14 Jul-14 Sep-14 Nov-14 Jan-15 Mar-15 May-15 Jul-15
35
Total Return Since IPO
PSXP 172%
Alerian MLP Index -10%
IPO
Closed 3rd
acquisition -
$1.1 B
Source: Bloomberg
Institutional Investors Contact
Kevin Mitchell - Investor Relations
Kevin.Mitchell@p66.com 832-765-2297
C.W. Mallon - Investor Relations
C.W.Mallon@p66.com 832-765-2297
Footnotes
37
Slide 5
The chart represents look-through EBITDA and the Corporate segment EBITDA is excluded. Average Corporate adjusted
quarterly EBITDA for 2013-2014 is ($86) MM.
Slide 6
Injury statistics do not include major projects.
Industry Averages are from: Phillips 66 – American Fuel & Petrochemical Manufacturers (AFPM) refining data, CPChem –
American Chemistry Council (ACC), DCP – Gas Processors Association (GPA).
Refining Environmental Event – is a key operational compliance indicator and generally reflects events when an
exceedance of a numeric emissions or discharge limit occurs. It includes all events regardless of reporting frequency
resulting in permit or regulatory-based numeric emissions exceedances. It also includes immediately agency-reportable
exceedances.
Slide 9
EBITDA excludes DCP but includes 100% PSXP EBITDA.
Slide 10
PSXP EBITDA includes EBITDA attributable to Phillips 66 noncontrolling interests.
Footnotes
38
Slide 11
PSXP is a consolidated subsidiary of PSX. Accordingly, quarterly cash distributions paid from PSXP to PSX, and
consideration paid by PSXP to PSX in a dropdown transaction, both eliminate in consolidation and do not impact PSX’s
consolidated cash balance. PSX’s consolidated cash balance increases to the extent PSXP funds consideration for a
dropdown transaction with public debt and equity offerings
Slide 14
Growth capital reflects 100% CPChem growth capital. Growth EBITDA (& start-up year) includes: 1-hexene (2014), 10th
Sweeny furnace (2014), NAO expansion project (2015) and USGC petrochemical project (2017).
Peers: Dow, ExxonMobil Chemical, LyondellBasell, Westlake
Slide 17
The chart represents look-through EBITDA and the Corporate segment EBITDA is excluded.
Slide 20
Capital returned includes the 2014 PSPI share exchange and excludes dividends payments
Slide 27
Debt and equity issuance amounts are gross of fees. Transaction between PSX and PSXP eliminate in consolidation.
Slide 29
$275 MM organic capital includes 2014 and 2015 spending
22.4 22.0 23.2
6.2
8.7 9.0
5.4 5.2 5.1
22%
28% 28%
2013 2014 2Q 2015
22.0 21.6 22.4
6.2
8.7 7.9
5.0 5.2 5.0
22%
29%
26%
2013 2014 2Q 2015
Equity $B Debt $B Cash & Cash Equivalents $B Debt to Capital
Capital Structure
39
20- 30%
Fully consolidated Excluding PSXP
Free Cash Flow
40
0.8
0.5
0.3
CFO (excl. WC) Sustaining Capex Free Cash Flow
0.9
0.7
0.2
CFO (excl. WC) Sustaining Capex Free Cash Flow
Midstream
$B
Chemicals
$B
Average from 2009-2014, DCP Midstream, CPChem and WRB free cash flow calculated at the enterprise level
2.5
1.6
0.9
CFO (excl. WC) Sustaining Capex Free Cash Flow
0.7 0.6
0.1
CFO (excl. WC) Sustaining Capex Free Cash Flow
Refining
$B
Marketing & Specialties
$B
32%
27%
13% 12%
M&S
Chemicals
Midstream Refining
-10%
0%
10%
20%
30%
40%
Average Capital Employed ($B)
Corporate
-5%
41
2014 Adjusted ROCE
P66 Total
14%
0 2 4 6 8 10 12 14 16 18 20 22 24 26 28 30
36%
27%
15%
17%
M&S
Chemicals
Refining
Midstream
-10%
0%
10%
20%
30%
40%
Average Capital Employed ($B)
Corporate
-2%
42
2014 Adjusted CROCE
CROCE defined as Adjusted Net Income plus Depreciation and Amortization divided by Average Capital Employed.
P66 Total
17%
0 2 4 6 8 10 12 14 16 18 20 22 24 26 28 30
-2
0
2
4
6
8
10
2009 2010 2011 2012 2013 2014 2018E
Refining Midstream Chemicals M&S Corporate
$B
43
Adjusted EBITDA
Average is 2009 through 2014.
Avg. $6.4 B
1.1
1.9
2.5
3.4 3.4
4.2
2009 2010 2011 2012 2013 2014
Adjusted EBITDA
$B
44
Chemicals – CPChem
Reflects 100% CPChem.
1.0
1.2
1.4
0.9 1.0
0.8
2009 2010 2011 2012 2013 2014
Adjusted EBITDA
$B
45
Midstream – DCP
Reflects 100% DCP Midstream.
2015 Sensitivities – Phillips 66
46
Sensitivities shown above are independent and are only valid within a limited price range.
Annual Net Income $MM
Midstream - DCP (net to Phillips 66)
10¢/Gal Increase in NGL price 30
$1/MMBtu Increase in Natural Gas price 25
$10/BBL Increase in WTI price 15
Chemicals - CPChem (net to Phillips 66)
1¢/Lb Increase in Chain Margin (Ethylene, Polyethylene, NAO) 35
Worldwide Refining
$1/BBL Increase in Gasoline Margin 220
$1/BBL Increase in Distillate Margin 200
$1/BBL Widening LLS / Maya Differential (LLS less Maya) 50
$1/BBL Widening WTI / WCS Differential (WTI less WCS) 40
$1/BBL Widening WTI / WTS Differential (WTI less WTS) 15
$1/BBL Widening LLS / Medium Sour Differential (LLS less Medium Sour) 15
$1/BBL Widening ANS / WCS Differential (ANS less WCS) 10
10¢/MMBtu Increase in Natural Gas price (10)
Impacts due to Actual Crude Feedstock Differing from Feedstock Assumed in Market Indicators:
Phillips 66 Capital Program
47
Sustaining Growth Total
Capital Expenditures and Investments
Consolidated
Midstream(1)
Transportation 148 1,084 1,232
NGL 19 1,912 1,931
167 2,996 3,163
Chemicals - - -
Refining(2)
813 299 1,112
Marketing and Specialties 78 92 170
Corporate(2)
155 - 155
1,213 3,387 4,600
Selected Equity Affiliates
DCP 125 275 400
CPChem 187 1,266 1,453
WRB 150 53 203
462 1,594 2,056
Capital Program(3)
Midstream
Transportation 148 1,084 1,232
DCP 125 275 400
NGL 19 1,912 1,931
292 3,271 3,563
Chemicals 187 1,266 1,453
Refining 963 352 1,315
Marketing and Specialties 78 92 170
Corporate 155 - 155
1,675 4,981 6,656
(1) Includes 100% of Phillips 66 Partners
Millions of Dollars
2015 Budget
(2) Includes non-cash capitalized leases of $11 million in Refining and $21 million in Corporate and Other
(3) Includes Phillips 66's share of capital spending by DCP, CPChem and WRB, which are expected to be self-
funded.
Non-GAAP Reconciliations
48
Adjusted EBITDA forecasts were derived on an EBITDA-only basis. Accordingly, elements of net income including tax
and depreciation information are not available. Together, these items generally result in a significant uplift in EBITDA
over net income.
2018E Adjusted EBITDA/ EBITDA project backlog post 2018
PSXP Run Rate EBITDA
PSXP 2014 and 2018 run rate EBITDA estimates were derived on an EBITDA-only basis. Accordingly, elements of net
income including tax and depreciation information are not available. Together, these items generally result in a
significant uplift in EBITDA over net income. Run rate EBITDA reflects annualized EBITDA projections of assets
immediately upon acquisition.
Millions
of Dollars
Year ending February 29 2016
Reconciliation of PSXP Estimated EBITDA to Estimated Net Income*
Estimated net income 82$
Plus:
Depreciation 20
Interest expense 4
Income taxes 9
Estimated EBITDA 115$
*Amounts reflect the sum of EBITDA and net income forecasts within each joint venture, multiplied
by PSXP's expected ownership interest.
PSXP Run Rate EBITDA
PSXP 2014 and 2018 run rate EBITDA estimates were derived on an EBITDA-only basis. Accordingly, elements of net
income including tax and depreciation information are not available. Together, these items generally result in a
significant uplift in EBITDA over net income. Run rate EBITDA reflects annualized EBITDA projections of assets
immediately upon acquisition.
49
Non-GAAP Reconciliations
2009 2010 2011 2012 2013 2014
Phillips 66 Chemicals Segment ROCE
Numerator
Net Income 228$ 486 716 823 987 1,137
After-tax interest expense - - - - - -
GAAP ROCE earnings 228 486 716 823 987 1,137
Special Items - - - 157 - 72
Adjusted ROCE earnings 228$ 486 716 980 987 1,209
Denominator
GAAP average capital employed* 2,024$ 2,275 2,563 3,142 3,825 4,489
*Total equity plus debt.
Annualized Adjusted ROCE (percent) 11% 21% 28% 31% 26% 27%
Annualized GAAP ROCE (percent) 11% 21% 28% 26% 26% 25%
Millions of Dollars
Non-GAAP Reconciliations
50
Marketing & Specialties Adjusted EBITDA Reconciliation 2009 2010 2011 2012 2013 2014
2009-2014
Average
U.S. Marketing
U.S. Marketing net income attributable to Phillips 66 232$ 338 154 116 426 439 284
Plus:
Provision for income taxes 151 225 120 56 248 251 175
Net interest expense (47) (41) (32) - (0) (0) (20)
Depreciation and amortization 34 30 30 29 15 15 25
U.S. Marketing EBITDA 370$ 553 271 201 689 705 465
Adjustments (pretax):
Gain on asset dispositions (22)$ (234) - (4) - - (43)
Impairments 59 12 - - - - 12
Pending claims and settlements - (56) - 62 (25) (44) (11)
Tax law impacts - - - - (6) - (1)
U.S. Marketing Adjusted EBITDA* 407$ 275 271 259 658 661 422
International Marketing
International Marketing net income attributable to Phillips 66 155$ 110 256 159 261 397 223
Plus:
Provision for income taxes 216 52 111 105 59 75 103
Net interest expense 1 - - - - - 0
Depreciation and amortization 92 104 114 107 80 68 94
International Marketing EBITDA 463$ 266 481 371 400 540 420
Adjustments (pretax):
Gain on asset dispositions -$ - 3 - - (125) (20)
International Marketing Adjusted EBITDA* 463$ 266 484 371 400 415 400
Millions of Dollars
Marketing & Specialties Adjusted EBITDA Reconciliation 2009 2010 2011 2012 2013 2014
2009-2014
Average
Specialties
Specialties net income attributable to Phillips 66 154$ 207 283 269 206 199 220
Plus:
Provision for income taxes 90 121 175 158 126 114 131
Net interest expense 2 - - - - - 0
Depreciation and amortization 6 7 8 11 8 11 9
Specialties EBITDA 252$ 335 466 438 341 324 359
Adjustments (pretax):
Gain on asset dispositions -$ - (43) - (40) - (14)
Exit of a business line - - - - 54 - 9
Specialties Adjusted EBITDA* 252$ 335 423 438 355 324 354
Marketing & Specialties Consolidated Segment
Marketing and Specialties net income attributable to Phillips 66 541$ 656 693 544 894 1,034 727
Plus:
Provision for income taxes 457 398 405 319 433 440 409
Net interest expense (44) (41) (32) - (0) (0) (20)
Depreciation and amortization 131 140 153 147 103 95 128
Marketing and Specialties EBITDA 1,085$ 1,153 1,218 1,010 1,430 1,569 1,244
Adjustments (pretax):
Gain on asset dispositions (22)$ (234) (40) (4) (40) (125) (78)
Impairments 59 12 - - - - 12
Pending claims and settlements - (56) - 62 (25) (44) (11)
Exit of a business line - - - - 54 - 9
Tax law impacts - - - - (6) - (1)
Marketing and Specialties Adjusted EBITDA 1,122$ 875 1,178 1,068 1,413 1,400 1,176
Millions of Dollars
Non-GAAP Reconciliations
51
Adjusted EBITDA by Segment Reconciliation 2009 2010 2011 2012 2013 2014
2009-2014
Average
Midstream
Midstream net income attributable to Phillips 66 384$ 384 2,147 52 469 507 657
Plus:
Net income attributable to noncontrolling interests 3 5 5 7 17 35 12
Provision for income taxes 204 184 453 29 264 309 241
Depreciation and amortization 99 74 82 83 88 91 86
Midstream EBITDA 690$ 647 2,687 171 838 942 996
Adjustments (pretax):
EBITDA attributable to Phillips 66 noncontrolling interests -$ (9) (10) (13) (24) (45) (17)
Proportional share of selected equity affiliates income taxes 9 3 1 - 4 3 3
Proportional share of selected equity affiliates net interest 119 119 97 85 110 118 108
Proportional share of selected equity affiliates depreciation and amortization 187 188 202 131 139 150 166
Lower-of-cost-or-market inventory adjustments - - - - - 2 0
Gain on asset dispositions (15) - (1,830) - - - (308)
Gain on share issuance by equity affiliate (135) - - - - - (23)
Impairments 70 - 6 523 - - 100
Pending Claims and settlements - - - (37) - - (6)
Hurricane-related costs - - - 2 - - 0
Midstream Adjusted EBITDA* 925$ 948 1,153 862 1,067 1,170 1,021
* Proportional share of selected equity affiliates is net of noncontrolling interests.
Chemicals
Chemicals net income attributable to Phillips 66 228$ 486 716 823 986 1,137 729
Plus:
Provision for income taxes 67 194 252 366 375 495 292
Chemicals EBITDA 295$ 680 968 1,189 1,361 1,632 1,021
Adjustments (pretax):
Proportional share of selected equity affiliates income taxes 37$ 59 75 79 93 111 76
Proportional share of selected equity affiliates net interest 34 35 16 13 10 9 20
Proportional share of selected equity affiliates depreciation and amortization 192 183 198 213 246 258 215
Impairments - - - 43 - 88 22
Premium on early debt retirement - - - 144 - - 24
Lower-of-cost-or-market inventory adjustments - - - - - 3 1
Chemicals Adjusted EBITDA 558$ 957 1,257 1,681 1,710 2,101 1,377
Millions of Dollars
Non-GAAP Reconciliations
52
Adjusted EBITDA by Segment Reconciliation 2009 2010 2011 2012 2013 2014
2009-2014
Average
Refining
Refining net income (loss) attributable to Phillips 66 (556)$ (661) 1,369 3,091 1,747 1,771 1,127
Plus:
Provision for income taxes (296) (121) 808 1,998 1,035 696 687
Net interest expense (1) (2) (1) - - - (1)
Depreciation and amortization 641 659 664 655 685 704 668
Refining EBITDA (212)$ (125) 2,840 5,744 3,467 3,171 2,481
Adjustments (pretax):
Proportional share of selected equity affiliates income taxes 1$ 1 4 5 (4) 3 2
Proportional share of selected equity affiliates net interest (179) (160) (140) (118) (95) (19) (119)
Proportional share of selected equity affiliates depreciation and amortization 178 169 184 236 237 245 208
Net (gain) loss on asset dispositions - - 234 (185) - (145) (16)
Impairments - 1,500 500 606 - 131 456
Canceled projects - 106 44 - - - 25
Pending claims and settlements 39 - - 31 - 23 16
Severence accruals - 28 24 - - - 9
Hurrican-related costs - - - 54 - - 9
Tax law impacts - - - - (22) - (4)
Lower-of-cost-or-market inventory adjustments - - - - - 40 7
Refining Adjusted EBITDA (173)$ 1,519 3,690 6,373 3,583 3,449 3,074
Millions of Dollars
Non-GAAP Reconciliations
53
Adjusted EBITDA by Segment Reconciliation 2009 2010 2011 2012 2013 2014
2009-2014
Average
Marketing and Specialties
Marketing and Specialties net income attributable to Phillips 66 541$ 655 692 544 894 1,034 727
Plus:
Provision for income taxes 457 398 406 319 433 441 409
Net interest expense (44) (40) (32) - - - (19)
Depreciation and amortization 132 140 152 147 103 95 128
Marketing and Specialties EBITDA 1,086$ 1,153 1,218 1,010 1,430 1,570 1,245
Adjustments (pretax):
Gain on asset dispositions (22)$ (234) (40) (4) (40) (125) (78)
Impairments 59 12 - - - - 12
Pending claims and settlements - (56) - 62 (25) (44) (11)
Exit of a business line - - - - 54 - 9
Tax law impacts - - - - (6) - (1)
Marketing and Specialties Adjusted EBITDA 1,123$ 875 1,178 1,068 1,413 1,401 1,176
Corporate
Corporate net income (loss) attributable to Phillips 66 (140)$ (159) (192) (434) (431) (393) (292)
Plus:
Provision for income taxes (75) (93) (97) (239) (263) (287) (176)
Net interest expense 1 1 17 231 258 246 126
Depreciation and amortization 1 1 4 21 71 105 34
Corporate EBITDA (213)$ (250) (268) (421) (365) (329) (308)
Adjustments (pretax):
Impairments -$ - - 25 - - 4
Repositioning Costs - - - 85 - - 14
Corporate Adjusted EBITDA (213)$ (250) (268) (311) (365) (329) (289)
Millions of Dollars
Non-GAAP Reconciliations
54
Adjusted EBITDA by Segment Reconciliation 2009 2010 2011 2012 2013 2014
2009-2014
Average
Phillips 66
Phillips 66 net income attributable to Phillips 66 476$ 735 4,775 4,124 3,726 4,762 3,100
Less:
Income from discontinued operations 19 30 43 48 61 706 151
Plus:
Net income attributable to noncontrolling interests 3 5 5 7 17 35 12
Provision for income taxes 357 562 1,822 2,473 1,844 1,654 1,452
Net interest expense (44) (41) (16) 231 258 246 106
Depreciation and amortization 873 874 902 906 947 995 916
Phillips 66 EBITDA 1,646$ 2,105 7,445 7,693 6,731 6,986 5,434
Adjustments (pretax):
EBITDA attributable to Phillips 66 noncontrolling interests -$ (9) (10) (13) (24) (45) (17)
Proportional share of selected equity affiliates income taxes 47 63 80 84 93 117 81
Proportional share of selected equity affiliates net interest (26) (6) (27) (20) 25 108 9
Proportional share of selected equity affiliates depreciation and amortization 557 540 584 580 622 653 589
Gain on asset dispositions (37) (234) (1,636) (189) (40) (270) (401)
Gain on share issuance by equity affiliate (135) - - - - - (23)
Impairments 129 1,512 506 1,197 - 219 594
Cancelled projects - 106 44 - - - 25
Severence accruals - 28 24 - - - 9
Exit of a business line - - - - 54 - 9
Pending claims and settlements 39 (56) - 56 (25) (21) (1)
Premium on early debt retirement - - - 144 - - 24
Repositioning Costs - - - 85 - - 14
Hurricane-related costs - - - 56 - - 9
Tax law impacts - - - - (28) - (5)
Lower-of-cost-or-market inventory adjustments - - - - - 45 8
Phillips 66 Adjusted EBITDA 2,220$ 4,049 7,010 9,673 7,408 7,792 6,359
Millions of Dollars
Non-GAAP Reconciliations
55
Low High
100% CPChem Incremental Project Earnings Projections
Estimated incremental net income 1,000$ 1,313
Plus:
Estimated income taxes 20 27
Estimated net interest expense - -
Estimated depreciation 280 260
Estimated EBITDA 1,300$ 1,600
Millions of Dollars
Non-GAAP Reconciliations
56
Phillips 66 Midstream Chemicals Refining
Marketing &
Specialties Corporate
Phillips 66 ROCE
Numerator
Net Income 4,797$ 541 1,137 1,771 1,034 (393)
After-tax interest expense 173 - - - - 173
GAAP ROCE earnings 4,970 541 1,137 1,771 1,034 (220)
Special Items (981) 1 72 (195) (152) 0
Adjusted ROCE earnings 3,990$ 542 1,209 1,576 882 (220)
Denominator
GAAP average capital employed* 29,634$ 4,207 4,489 13,377 2,743 4,722
Discontinued Operations (96) - - - - -
Adjusted average capital employed* 29,537$ 4,207 4,489 13,377 2,743 4,722
*Total equity plus debt.
Annualized Adjusted ROCE (percent) 14% 13% 27% 12% 32% -5%
Annualized GAAP ROCE (percent) 17% 13% 25% 13% 38% -5%
Phillips 66 Midstream Chemicals Refining
Marketing &
Specialties Corporate
Phillips 66 CROCE
Numerator
Net Income 4,797$ 541 1,137 1,771 1,034 (393)
After-tax interest expense 173 - - - - 173
Depreciation and amortization 995 91 - 704 95 106
5,966 633 1,137 2,475 1,129 (114)
Special Items (981) 1 72 (195) (152) 0
Adjusted CROCE earnings 4,985$ 634 1,209 2,280 977 (114)
Denominator
GAAP average capital employed* 29,634$ 4,207 4,489 13,377 2,743 4,722
Discontinued Operations (96) - - - - -
Adjusted average capital employed* 29,537$ 4,207 4,489 13,377 2,743 4,722
*Total equity plus debt.
Adjusted CROCE (percent) 17% 15% 27% 17% 36% -2%
Net Income/ GAAP Average Capital Employed (percent) 16% 13% 25% 13% 38% -8%
Millions of Dollars
2014
Non-GAAP Reconciliations
57
Midstream Chemicals Refining
Marketing &
Specialties
FCF Yield
Numerator
Cash From Operations GAAP 559$ 230 2,615 563
Less: Change in Non-Cash Working Cap. (13) - 152 (127)
Cash From Operations (excluding WC) 572 230 2,463 690
Less: P66 Equity affiliate cash from ops 205 230 584 -
Add: Equity look through cash from ops 396 855 573 -
Adjusted FCF (excl WC) 763$ 855 2,452 690
Total Capex GAAP 2,173 - 1,038 439
Less: Growth Capex 2,058 - 287 388
Sustaining Capex 115 - 751 51
Less: P66 Equity affiliate sustaining capex - - - -
Add: Equity look through sustaining capex 148 150 134 -
Adjusted Sustaining Capex 263$ 150 885 51
Free Cash Flow 500$ 705 1,567 639
Denominator
GAAP average capital employed* 3,346$ 3,053 15,052 3,382
Less: P66 Equity affiliate capital employed 512 3,053 2,507 -
Add: Equity look through capital employed 3,667 3,515 5,231 -
Adjusted average capital employed* 6,501$ 3,515$ 17,776$ 3,382$
*Total equity plus debt.
Adjusted FCFY (percent) 8% 20% 9% 19%
GAAP CFO/ GAAP Capital Employed (percent) 17% 8% 17% 17%
Average 2009-2014
Non-GAAP Reconciliations
58
2009 2010 2011 2012 2013 2014
100% CPChem
Net Income $ 615 1,388 1,970 2,403 2,743 3,288
Plus:
Income taxes 26 42 57 67 71 86
Net interest expense 58 63 18 8 (3) (2)
Depreciation and amortization 285 255 258 265 278 296
EBITDA $ 984 1,748 2,303 2,743 3,089 3,668
Adjustments (pre-tax):
Proportional share of equity affiliates income taxes 48 76 93 91 115 136
Proportional share of equity affiliates net interest expense 10 8 14 17 24 19
Proportional share of equity affiliates depreciation and amortization 98 112 138 157 214 220
Impairments - - - 91 - 175
Premium on early debt retirement - - - 287 - -
Lower-of-cost-or-market inventory adjustments - - - - - 6
Adjusted EBITDA $ 1,140 1,944 2,548 3,386 3,442 4,224
Millions of Dollars
2009 2010 2011 2012 2013 2014
100% DCP Midstream
Net Income $ 339 592 863 486 491 288
Plus:
Income taxes 18 5 3 2 10 11
Net interest expense 254 253 213 193 249 287
Depreciation and amortization 405 413 449 291 314 348
EBITDA $ 1,016 1,263 1,528 972 1,064 934
Adjustments (pre-tax):
Proportional share of equity affiliates income taxes (1) - - (1) (3) (6)
Proportional share of equity affiliates net interest expense (18) (20) (25) (32) (40) (67)
Proportional share of equity affiliates depreciation and amortization (41) (50) (59) (43) (67) (86)
Adjusted EBITDA $ 956 1,193 1,444 896 954 775
Millions of Dollars
Non-GAAP Reconciliations
59
Adjusted EBITDA by Segment Reconciliation 1Q 2Q 3Q 4Q 1Q 2Q 3Q 4Q 1Q 2Q
Midstream
Midstream net income 114$ 92 152 128 194 117 124 107 78 (62) 104
Plus:
Provision for income taxes 63 49 87 65 108 63 70 68 38 (37) 57
Depreciation and amortization 19 19 19 31 19 21 24 27 26 27 23
Midstream EBITDA 196$ 160 258 224 321 201 218 202 142 (72) 185
Adjustments (pretax):
EBITDA attributable to Phillips 66 noncontrolling interests (5)$ (4) (7) (8) (8) (12) (13) (12) (16) (17) (10)
Proportional share of selected equity affiliates income taxes - 2 1 1 2 - 2 (1) 1 (2) 1
Proportional share of selected equity affiliates net interest 22 22 33 33 30 31 29 28 32 33 29
Proportional share of selected equity affiliates depreciation and amortization 31 33 37 38 39 36 37 38 40 41 37
Lower-of-cost-or-market inventory adjustments - - - - - - - 2 - - -
Impairments by equity affiliates - - - - - - - - - 194 19
Midstream Adjusted EBITDA* 244$ 213$ 322$ 288$ 384 256 273 257 199 177 261
* Proportional share of selected equity affiliates is net of noncontrolling interests.
Chemicals
Chemicals net income 282$ 181 262 261 316 324 230 267 203 295 262
Plus:
Provision for income taxes 121 51 105 98 126 142 98 129 88 121 108
Chemicals EBITDA 403$ 232 367 359 442 466 328 396 291 416 370
Adjustments (pretax):
Proportional share of selected equity affiliates income taxes 19$ 25 25 24 27 28 35 21 22 25 25
Proportional share of selected equity affiliates net interest 2 3 2 3 3 1 2 3 2 1 2
Proportional share of selected equity affiliates depreciation and amortization 58 60 60 68 62 62 64 70 65 65 63
Impairments - - - - - - 88 - - - 9
Lower-of-cost-or-market inventory adjustments - - - - - - - 3 - - -
Chemicals Adjusted EBITDA 482$ 320 454 454 534 557 517 493 380 507 470
Millions of Dollars
2013 2014 2015
Average
Non-GAAP Reconciliations
60
Adjusted EBITDA by Segment Reconciliation 1Q 2Q 3Q 4Q 1Q 2Q 3Q 4Q 1Q 2Q
Refining
Refining net income 904$ 455 (30) 418 306 390 558 517 538 604 466
Plus:
Provision for income taxes 467 280 22 266 202 257 301 (64) 226 328 229
Depreciation and amortization 177 168 170 170 172 174 178 180 177 183 175
Refining EBITDA 1,548$ 903 162 854 680 821 1,037 633 941 1,115 869
Adjustments (pretax):
Proportional share of selected equity affiliates income taxes 2$ 1 - (7) - 1 - 2 - (2) (0)
Proportional share of selected equity affiliates net interest (26) (24) (23) (22) (19) - - - - - (11)
Proportional share of selected equity affiliates depreciation and amortization 58 57 60 62 61 61 61 62 63 63 61
Asset dispositions - - - - - - - (145) (8) - (15)
Impairments - - - - - - - 131 - - 13
Pending claims and settlements - - - - - - - 23 - - 2
Tax law impacts (22) - - - - - - - - - (2)
Lower-of-cost-or-market inventory adjustments - - - - - - - 40 - - 4
Refining Adjusted EBITDA 1,560$ 937 199 887 722 883 1,098 746 996 1,176 920
Marketing and Specialties
Marketing and Specialties net income 190$ 344 255 105 137 162 368 367 304 314 255
Plus:
Provision for income taxes 92 187 107 47 68 86 127 160 102 96 107
Depreciation and amortization 33 25 22 23 21 23 24 27 24 23 25
Marketing and Specialties EBITDA 315$ 556 384 175 226 271 519 554 430 433 386
Adjustments (pretax):
Asset dispositions -$ (40) - - - - (109) (16) (110) (132) (41)
Pending claims and settlements (25) - - - - - - (44) - - (7)
Exit of a business line 54 - - - - - - - - - 5
Tax law impacts (6) - - - - - - - - - (1)
Marketing and Specialties Adjusted EBITDA 338$ 516 384 175 226 271 410 494 320 301 344
Millions of Dollars
2013 2014 2015
Average
Non-GAAP Reconciliations
61
Adjusted EBITDA by Segment Reconciliation 1Q 2Q 3Q 4Q 1Q 2Q 3Q 4Q 1Q 2Q
Corporate
Corporate net income (loss) (95)$ (126) (113) (97) (81) (121) (91) (100) (126) (125) (106)
Plus:
Provision for income taxes (80) (60) (43) (80) (78) (61) (58) (90) (63) (68) (68)
Net interest expense 65 66 65 62 63 60 55 68 81 67 65
Depreciation and amortization 13 17 22 19 22 21 23 39 26 40 22
Corporate EBITDA (97)$ (103) (69) (96) (74) (101) (71) (83) (82) (86) (86)
Adjustments (pretax):
Impairments -$ - - - - - - - - - -
Pending claims and settlements -$ - - - - - - - - (5)
Corporate Adjusted EBITDA (97)$ (103) (69) (96) (74) (101) (71) (83) (82) (91) (86)
Phillips 66
Phillips 66 net income 1,410$ 960 540 833 1,578 872 1,189 1,158 997 1,025 1,056
Less:
Income from discontinued operations 15 14 14 18 706 - - - - - 77
Plus:
Provision for income taxes 663 507 278 396 426 487 538 203 391 440 433
Net interest expense 65 66 65 62 63 60 55 68 81 67 65
Depreciation and amortization 242 229 233 243 234 239 249 273 253 274 247
Phillips 66 EBITDA 2,365$ 1,748 1,102 1,516 1,595 1,658 2,031 1,702 1,722 1,806 1,725
Adjustments (pretax):
EBITDA attributable to Phillips 66 noncontrolling interests (5)$ (4) (7) (8) (8) (12) (13) (12) (16) (17) (10)
Proportional share of selected equity affiliates income taxes 21 28 26 18 29 29 37 22 23 21 25
Proportional share of selected equity affiliates net interest (2) 1 12 14 14 32 31 31 34 34 20
Proportional share of selected equity affiliates depreciation and amortization 147 150 157 168 162 159 162 170 168 169 161
Asset dispositions - (40) - - - - (109) (161) (118) (132) (56)
Impairments - - - - - - 88 131 - - 22
Exit of a business line 54 - - - - - - - - - 5
Tax law impacts (28) - - - - - - - - - (3)
Impairments by equity affiliates - - - - - - - - - 194 19
Pending claims and settlements (25) - - - - - - (21) - (5) (5)
Lower-of-cost-or-market inventory adjustments - - - - - - - 45 - - 5
Phillips 66 Adjusted EBITDA 2,527$ 1,883 1,290 1,708 1,792 1,866 2,227 1,907 1,813 2,070 1,908
Millions of Dollars
2013 2014 2015
Average
Adjusted EBITDA and Distributable Cash Flow
Reconciliation to Net Income
62
$ MM
2Q 2015 1Q 2015 4Q 2014 3Q 2014 2Q 2014
Net Income $ 42.0 $ 35.4 $ 36.3 $ 30.0 $ 30.9
Plus:
Depreciation 5.3 5.1 4.5 4.2 3.9
Net interest expense 9.5 5.8 2.1 1.4 1.3
Amortization of deferred rentals 0.1 0.1 0.1 0.1 0.1
Provision for (benefit from) income taxes (0.1) 0.2 0.2 0.1 0.2
EBITDA 56.8 46.6 43.2 35.8 36.4
Distributions in excess of equity earnings 0.2 0.7 - - -
Expenses indemnified or prefunded by Phillips 66 - 0.3 0.1 0.7 -
Transaction costs associated with acquisitions - 1.4 1.0 0.2 -
EBITDA attributable to predecessors - - (0.6) (0.8) 1.2
Adjusted EBITDA 57.0 49.0 43.7 35.9 37.6
Plus:
Adjustments related to minimum volume commitments 2.2 1.1 (2.4) 1.4 (0.7)
Phillip 66 prefunded maintenance capital expenditures - - 0.1 - 1.1
Less:
Net interest 9.5 6.5 1.4 1.7 0.1
Income taxes paid 0.4 - - - 0.2
Maintenance capital expenditures 1.5 1.7 2.8 2.2 3.4
Distributable Cash Flow 47.8 41.9 37.2 33.4 34.3

More Related Content

What's hot

Molson coors boston 2017 slides final
Molson coors boston 2017 slides finalMolson coors boston 2017 slides final
Molson coors boston 2017 slides finalmolsoncoorsir
 
Strategic Plan 2040 || Business and Management Plan 2019-2023
Strategic Plan 2040 || Business and Management Plan 2019-2023Strategic Plan 2040 || Business and Management Plan 2019-2023
Strategic Plan 2040 || Business and Management Plan 2019-2023Petrobras
 
Ugi investor day combined_v_final
Ugi investor day combined_v_finalUgi investor day combined_v_final
Ugi investor day combined_v_finalUGI_Corporation
 
Phillips 66 Third-Quarter Earnings Conference Call
Phillips 66 Third-Quarter Earnings Conference CallPhillips 66 Third-Quarter Earnings Conference Call
Phillips 66 Third-Quarter Earnings Conference Callinvestor_phillips66
 
Sysco 3Q16 Earnings Results
Sysco 3Q16 Earnings ResultsSysco 3Q16 Earnings Results
Sysco 3Q16 Earnings ResultsSysco_Investors
 
06 26-16 jpm energy conference final
06 26-16 jpm energy conference final06 26-16 jpm energy conference final
06 26-16 jpm energy conference finalAES_BigSky
 
Apresentação de Pedro Parente no Investor Day Nova York
Apresentação de Pedro Parente no Investor Day Nova YorkApresentação de Pedro Parente no Investor Day Nova York
Apresentação de Pedro Parente no Investor Day Nova YorkPetrobras
 
Q4 fy17 earnings presentation v f
Q4 fy17 earnings presentation v fQ4 fy17 earnings presentation v f
Q4 fy17 earnings presentation v fir_westrock
 
AES Q1 2016 Financial Review FINAL
AES Q1 2016 Financial Review FINALAES Q1 2016 Financial Review FINAL
AES Q1 2016 Financial Review FINALAES_BigSky
 
12 12-16 barclays beaver creek utilities conference final
12 12-16 barclays beaver creek utilities conference final12 12-16 barclays beaver creek utilities conference final
12 12-16 barclays beaver creek utilities conference finalAES_BigSky
 
Sun september investor presentation
Sun september investor presentationSun september investor presentation
Sun september investor presentationSunocoLP
 
Q2 16 slides ugi-v_final
Q2 16 slides ugi-v_finalQ2 16 slides ugi-v_final
Q2 16 slides ugi-v_finalUGI_Corporation
 
Brink's Fourth Quarter 2015 Earnings Presentation
Brink's Fourth Quarter 2015 Earnings PresentationBrink's Fourth Quarter 2015 Earnings Presentation
Brink's Fourth Quarter 2015 Earnings Presentationbrinks2015
 
Why invest-page-update-071017
Why invest-page-update-071017Why invest-page-update-071017
Why invest-page-update-071017molsoncoorsir
 
Rbc capital markets mlp conference
Rbc capital markets mlp conferenceRbc capital markets mlp conference
Rbc capital markets mlp conferenceir_jpenergy
 
Clorox investor-presentation-(fy19 q1)
Clorox investor-presentation-(fy19 q1)Clorox investor-presentation-(fy19 q1)
Clorox investor-presentation-(fy19 q1)cloroxir2016
 
REITWeek 2016 Investor Conference
REITWeek 2016 Investor ConferenceREITWeek 2016 Investor Conference
REITWeek 2016 Investor ConferenceIronMInc
 
Investor Presentation March 20, 2014
Investor Presentation March 20, 2014Investor Presentation March 20, 2014
Investor Presentation March 20, 2014FinningInternational
 
Petrobras Investor Day - London 2018
Petrobras Investor Day - London 2018Petrobras Investor Day - London 2018
Petrobras Investor Day - London 2018Petrobras
 

What's hot (20)

Molson coors boston 2017 slides final
Molson coors boston 2017 slides finalMolson coors boston 2017 slides final
Molson coors boston 2017 slides final
 
Strategic Plan 2040 || Business and Management Plan 2019-2023
Strategic Plan 2040 || Business and Management Plan 2019-2023Strategic Plan 2040 || Business and Management Plan 2019-2023
Strategic Plan 2040 || Business and Management Plan 2019-2023
 
Ugi investor day combined_v_final
Ugi investor day combined_v_finalUgi investor day combined_v_final
Ugi investor day combined_v_final
 
Phillips 66 Third-Quarter Earnings Conference Call
Phillips 66 Third-Quarter Earnings Conference CallPhillips 66 Third-Quarter Earnings Conference Call
Phillips 66 Third-Quarter Earnings Conference Call
 
Sysco 3Q16 Earnings Results
Sysco 3Q16 Earnings ResultsSysco 3Q16 Earnings Results
Sysco 3Q16 Earnings Results
 
06 26-16 jpm energy conference final
06 26-16 jpm energy conference final06 26-16 jpm energy conference final
06 26-16 jpm energy conference final
 
Apresentação de Pedro Parente no Investor Day Nova York
Apresentação de Pedro Parente no Investor Day Nova YorkApresentação de Pedro Parente no Investor Day Nova York
Apresentação de Pedro Parente no Investor Day Nova York
 
Q4 fy17 earnings presentation v f
Q4 fy17 earnings presentation v fQ4 fy17 earnings presentation v f
Q4 fy17 earnings presentation v f
 
AES Q1 2016 Financial Review FINAL
AES Q1 2016 Financial Review FINALAES Q1 2016 Financial Review FINAL
AES Q1 2016 Financial Review FINAL
 
12 12-16 barclays beaver creek utilities conference final
12 12-16 barclays beaver creek utilities conference final12 12-16 barclays beaver creek utilities conference final
12 12-16 barclays beaver creek utilities conference final
 
Sun september investor presentation
Sun september investor presentationSun september investor presentation
Sun september investor presentation
 
Q2 16 slides ugi-v_final
Q2 16 slides ugi-v_finalQ2 16 slides ugi-v_final
Q2 16 slides ugi-v_final
 
Brink's Fourth Quarter 2015 Earnings Presentation
Brink's Fourth Quarter 2015 Earnings PresentationBrink's Fourth Quarter 2015 Earnings Presentation
Brink's Fourth Quarter 2015 Earnings Presentation
 
Why invest-page-update-071017
Why invest-page-update-071017Why invest-page-update-071017
Why invest-page-update-071017
 
Rbc capital markets mlp conference
Rbc capital markets mlp conferenceRbc capital markets mlp conference
Rbc capital markets mlp conference
 
Clorox investor-presentation-(fy19 q1)
Clorox investor-presentation-(fy19 q1)Clorox investor-presentation-(fy19 q1)
Clorox investor-presentation-(fy19 q1)
 
REITWeek 2016 Investor Conference
REITWeek 2016 Investor ConferenceREITWeek 2016 Investor Conference
REITWeek 2016 Investor Conference
 
Investor Update September 2015
Investor Update September 2015Investor Update September 2015
Investor Update September 2015
 
Investor Presentation March 20, 2014
Investor Presentation March 20, 2014Investor Presentation March 20, 2014
Investor Presentation March 20, 2014
 
Petrobras Investor Day - London 2018
Petrobras Investor Day - London 2018Petrobras Investor Day - London 2018
Petrobras Investor Day - London 2018
 

Viewers also liked

Q1 2008 Motorola, Inc. Earnings Conference Call Presentation
 	Q1 2008 Motorola, Inc. Earnings Conference Call Presentation 	Q1 2008 Motorola, Inc. Earnings Conference Call Presentation
Q1 2008 Motorola, Inc. Earnings Conference Call Presentationfinance7
 
Skyharbour Resources Ltd. Investor Presentation
Skyharbour Resources Ltd. Investor PresentationSkyharbour Resources Ltd. Investor Presentation
Skyharbour Resources Ltd. Investor PresentationCompany Spotlight
 
Quintiles’ Second Quarter 2015 Earnings Call
Quintiles’ Second Quarter 2015 Earnings CallQuintiles’ Second Quarter 2015 Earnings Call
Quintiles’ Second Quarter 2015 Earnings CallQuintiles2014
 
Second Quarter 2015 Earnings Conference Call
Second Quarter 2015 Earnings Conference CallSecond Quarter 2015 Earnings Conference Call
Second Quarter 2015 Earnings Conference Callinvestorswci
 
1Q FY2014 Cardinal Health, Inc. Earnings Conference Call
1Q FY2014 Cardinal Health, Inc. Earnings Conference Call1Q FY2014 Cardinal Health, Inc. Earnings Conference Call
1Q FY2014 Cardinal Health, Inc. Earnings Conference CallCardinal_Health
 
Pitfalls of Startup Team Building
Pitfalls of Startup Team BuildingPitfalls of Startup Team Building
Pitfalls of Startup Team BuildingRand Fishkin
 
LinkedIn's Q1 2012 Earnings
LinkedIn's Q1 2012 EarningsLinkedIn's Q1 2012 Earnings
LinkedIn's Q1 2012 EarningsLinkedIn
 

Viewers also liked (9)

Future Now
Future NowFuture Now
Future Now
 
2Q 2014 Earnings Conference Call Presentation
2Q 2014 Earnings Conference Call Presentation2Q 2014 Earnings Conference Call Presentation
2Q 2014 Earnings Conference Call Presentation
 
Q1 2008 Motorola, Inc. Earnings Conference Call Presentation
 	Q1 2008 Motorola, Inc. Earnings Conference Call Presentation 	Q1 2008 Motorola, Inc. Earnings Conference Call Presentation
Q1 2008 Motorola, Inc. Earnings Conference Call Presentation
 
Skyharbour Resources Ltd. Investor Presentation
Skyharbour Resources Ltd. Investor PresentationSkyharbour Resources Ltd. Investor Presentation
Skyharbour Resources Ltd. Investor Presentation
 
Quintiles’ Second Quarter 2015 Earnings Call
Quintiles’ Second Quarter 2015 Earnings CallQuintiles’ Second Quarter 2015 Earnings Call
Quintiles’ Second Quarter 2015 Earnings Call
 
Second Quarter 2015 Earnings Conference Call
Second Quarter 2015 Earnings Conference CallSecond Quarter 2015 Earnings Conference Call
Second Quarter 2015 Earnings Conference Call
 
1Q FY2014 Cardinal Health, Inc. Earnings Conference Call
1Q FY2014 Cardinal Health, Inc. Earnings Conference Call1Q FY2014 Cardinal Health, Inc. Earnings Conference Call
1Q FY2014 Cardinal Health, Inc. Earnings Conference Call
 
Pitfalls of Startup Team Building
Pitfalls of Startup Team BuildingPitfalls of Startup Team Building
Pitfalls of Startup Team Building
 
LinkedIn's Q1 2012 Earnings
LinkedIn's Q1 2012 EarningsLinkedIn's Q1 2012 Earnings
LinkedIn's Q1 2012 Earnings
 

Similar to Q22015 investorupdatepsxpsxp

2015 citi may presentation-final
2015 citi  may presentation-final2015 citi  may presentation-final
2015 citi may presentation-finalinvestor_phillips66
 
Phillips 66 Fourth-Quarter Earnings Conference Call
Phillips 66 Fourth-Quarter Earnings Conference CallPhillips 66 Fourth-Quarter Earnings Conference Call
Phillips 66 Fourth-Quarter Earnings Conference Callinvestor_phillips66
 
2017 1 q conference presentation tgt -final for posting
2017 1 q conference presentation tgt -final for posting2017 1 q conference presentation tgt -final for posting
2017 1 q conference presentation tgt -final for postinginvestor_phillips66
 
Earnings and kap stone acquistion slides vf
Earnings and kap stone acquistion slides vfEarnings and kap stone acquistion slides vf
Earnings and kap stone acquistion slides vfir_westrock
 
Earnings and kap stone acquisition slides vf
Earnings and kap stone acquisition slides vfEarnings and kap stone acquisition slides vf
Earnings and kap stone acquisition slides vfir_westrock
 
Strategic Plan and 2017-2021 Business & Management Plan
Strategic Plan and 2017-2021 Business & Management PlanStrategic Plan and 2017-2021 Business & Management Plan
Strategic Plan and 2017-2021 Business & Management PlanPetrobras
 
03 30-15 april investor presentation final
03 30-15 april investor presentation final03 30-15 april investor presentation final
03 30-15 april investor presentation finalAES_BigSky
 
03 30-15 april investor presentation final
03 30-15 april investor presentation final03 30-15 april investor presentation final
03 30-15 april investor presentation finalAES_BigSky
 
Petrobras General Overview
Petrobras General OverviewPetrobras General Overview
Petrobras General OverviewPetrobras
 
Barclays Energy Conference - 2014
Barclays Energy Conference - 2014Barclays Energy Conference - 2014
Barclays Energy Conference - 2014investor_phillips66
 
Mdr day1-ir presentation final 051018 230 pm cst
Mdr day1-ir presentation final 051018 230 pm cstMdr day1-ir presentation final 051018 230 pm cst
Mdr day1-ir presentation final 051018 230 pm cstinvestorcbi
 
Q2 fy18 earnings presentation v f
Q2 fy18 earnings presentation v fQ2 fy18 earnings presentation v f
Q2 fy18 earnings presentation v fir_westrock
 
12 15-14 december investor presentation final
12 15-14 december investor presentation final12 15-14 december investor presentation final
12 15-14 december investor presentation finalAES_BigSky
 
Q4 2016 earnings call presentation 11.16.16
Q4 2016 earnings call presentation 11.16.16Q4 2016 earnings call presentation 11.16.16
Q4 2016 earnings call presentation 11.16.16Hillenbrand_IR
 
Webcast 4Q15
Webcast 4Q15Webcast 4Q15
Webcast 4Q15Petrobras
 
April Investor Presentation
April Investor PresentationApril Investor Presentation
April Investor PresentationAES_BigSky
 
04 15-15 april investor presentation wc-final
04 15-15 april investor presentation wc-final04 15-15 april investor presentation wc-final
04 15-15 april investor presentation wc-finalAES_BigSky
 

Similar to Q22015 investorupdatepsxpsxp (20)

Investor update feb 2016 final
Investor update feb 2016 finalInvestor update feb 2016 final
Investor update feb 2016 final
 
Investor Update - February 2016
Investor Update - February 2016Investor Update - February 2016
Investor Update - February 2016
 
2015 citi may presentation-final
2015 citi  may presentation-final2015 citi  may presentation-final
2015 citi may presentation-final
 
Phillips 66 Fourth-Quarter Earnings Conference Call
Phillips 66 Fourth-Quarter Earnings Conference CallPhillips 66 Fourth-Quarter Earnings Conference Call
Phillips 66 Fourth-Quarter Earnings Conference Call
 
2017 1 q conference presentation tgt -final for posting
2017 1 q conference presentation tgt -final for posting2017 1 q conference presentation tgt -final for posting
2017 1 q conference presentation tgt -final for posting
 
Earnings and kap stone acquistion slides vf
Earnings and kap stone acquistion slides vfEarnings and kap stone acquistion slides vf
Earnings and kap stone acquistion slides vf
 
Earnings and kap stone acquisition slides vf
Earnings and kap stone acquisition slides vfEarnings and kap stone acquisition slides vf
Earnings and kap stone acquisition slides vf
 
Strategic Plan and 2017-2021 Business & Management Plan
Strategic Plan and 2017-2021 Business & Management PlanStrategic Plan and 2017-2021 Business & Management Plan
Strategic Plan and 2017-2021 Business & Management Plan
 
03 30-15 april investor presentation final
03 30-15 april investor presentation final03 30-15 april investor presentation final
03 30-15 april investor presentation final
 
03 30-15 april investor presentation final
03 30-15 april investor presentation final03 30-15 april investor presentation final
03 30-15 april investor presentation final
 
Petrobras General Overview
Petrobras General OverviewPetrobras General Overview
Petrobras General Overview
 
Winter 2018
Winter 2018Winter 2018
Winter 2018
 
Barclays Energy Conference - 2014
Barclays Energy Conference - 2014Barclays Energy Conference - 2014
Barclays Energy Conference - 2014
 
Mdr day1-ir presentation final 051018 230 pm cst
Mdr day1-ir presentation final 051018 230 pm cstMdr day1-ir presentation final 051018 230 pm cst
Mdr day1-ir presentation final 051018 230 pm cst
 
Q2 fy18 earnings presentation v f
Q2 fy18 earnings presentation v fQ2 fy18 earnings presentation v f
Q2 fy18 earnings presentation v f
 
12 15-14 december investor presentation final
12 15-14 december investor presentation final12 15-14 december investor presentation final
12 15-14 december investor presentation final
 
Q4 2016 earnings call presentation 11.16.16
Q4 2016 earnings call presentation 11.16.16Q4 2016 earnings call presentation 11.16.16
Q4 2016 earnings call presentation 11.16.16
 
Webcast 4Q15
Webcast 4Q15Webcast 4Q15
Webcast 4Q15
 
April Investor Presentation
April Investor PresentationApril Investor Presentation
April Investor Presentation
 
04 15-15 april investor presentation wc-final
04 15-15 april investor presentation wc-final04 15-15 april investor presentation wc-final
04 15-15 april investor presentation wc-final
 

More from investor_phillips66

Q2 2017 press release slides final
Q2 2017 press release slides finalQ2 2017 press release slides final
Q2 2017 press release slides finalinvestor_phillips66
 
Q1 2017 press release slides final
Q1 2017 press release slides finalQ1 2017 press release slides final
Q1 2017 press release slides finalinvestor_phillips66
 
Psx 2017 baml conference presentation final for posting
Psx 2017 baml conference presentation final for postingPsx 2017 baml conference presentation final for posting
Psx 2017 baml conference presentation final for postinginvestor_phillips66
 
Phillips 66 Fourth-Quarter Earnings Conference Call
Phillips 66 Fourth-Quarter Earnings Conference CallPhillips 66 Fourth-Quarter Earnings Conference Call
Phillips 66 Fourth-Quarter Earnings Conference Callinvestor_phillips66
 
Psx q3 2016 earnings slides final
Psx q3 2016 earnings slides   finalPsx q3 2016 earnings slides   final
Psx q3 2016 earnings slides finalinvestor_phillips66
 
Psx q2 2016 press release slides final
Psx q2 2016 press release slides finalPsx q2 2016 press release slides final
Psx q2 2016 press release slides finalinvestor_phillips66
 
Investor update march 2016 website
Investor update march 2016 websiteInvestor update march 2016 website
Investor update march 2016 websiteinvestor_phillips66
 
PHILLIPS 66 FIRST QUARTER CONFERENCE CALL
PHILLIPS 66 FIRST QUARTER CONFERENCE CALLPHILLIPS 66 FIRST QUARTER CONFERENCE CALL
PHILLIPS 66 FIRST QUARTER CONFERENCE CALLinvestor_phillips66
 
2015 credit-suisse-final v001-h4mb7r
2015 credit-suisse-final v001-h4mb7r2015 credit-suisse-final v001-h4mb7r
2015 credit-suisse-final v001-h4mb7rinvestor_phillips66
 
Phillips66 Q4 2014 Press Release Slides
Phillips66 Q4 2014 Press Release SlidesPhillips66 Q4 2014 Press Release Slides
Phillips66 Q4 2014 Press Release Slidesinvestor_phillips66
 

More from investor_phillips66 (14)

Q2 2017 press release slides final
Q2 2017 press release slides finalQ2 2017 press release slides final
Q2 2017 press release slides final
 
Q1 2017 press release slides final
Q1 2017 press release slides finalQ1 2017 press release slides final
Q1 2017 press release slides final
 
Psx 2017 baml conference presentation final for posting
Psx 2017 baml conference presentation final for postingPsx 2017 baml conference presentation final for posting
Psx 2017 baml conference presentation final for posting
 
Phillips 66 Fourth-Quarter Earnings Conference Call
Phillips 66 Fourth-Quarter Earnings Conference CallPhillips 66 Fourth-Quarter Earnings Conference Call
Phillips 66 Fourth-Quarter Earnings Conference Call
 
Psx q3 2016 earnings slides final
Psx q3 2016 earnings slides   finalPsx q3 2016 earnings slides   final
Psx q3 2016 earnings slides final
 
Psx q2 2016 press release slides final
Psx q2 2016 press release slides finalPsx q2 2016 press release slides final
Psx q2 2016 press release slides final
 
2016 shareholdermeetingfinal
2016 shareholdermeetingfinal2016 shareholdermeetingfinal
2016 shareholdermeetingfinal
 
Investor update march 2016 website
Investor update march 2016 websiteInvestor update march 2016 website
Investor update march 2016 website
 
PHILLIPS 66 FIRST QUARTER CONFERENCE CALL
PHILLIPS 66 FIRST QUARTER CONFERENCE CALLPHILLIPS 66 FIRST QUARTER CONFERENCE CALL
PHILLIPS 66 FIRST QUARTER CONFERENCE CALL
 
Phillips 66 2015 baml-p66.com
Phillips 66   2015 baml-p66.comPhillips 66   2015 baml-p66.com
Phillips 66 2015 baml-p66.com
 
2015 credit-suisse-final v001-h4mb7r
2015 credit-suisse-final v001-h4mb7r2015 credit-suisse-final v001-h4mb7r
2015 credit-suisse-final v001-h4mb7r
 
2015 credit suisse final
2015 credit suisse final2015 credit suisse final
2015 credit suisse final
 
Phillips66 Q4 2014 Press Release Slides
Phillips66 Q4 2014 Press Release SlidesPhillips66 Q4 2014 Press Release Slides
Phillips66 Q4 2014 Press Release Slides
 
2014 baml-presentation
2014 baml-presentation2014 baml-presentation
2014 baml-presentation
 

Recently uploaded

VIP Kolkata Call Girl Entally 👉 8250192130 Available With Room
VIP Kolkata Call Girl Entally 👉 8250192130  Available With RoomVIP Kolkata Call Girl Entally 👉 8250192130  Available With Room
VIP Kolkata Call Girl Entally 👉 8250192130 Available With Roomdivyansh0kumar0
 
VIP 7001035870 Find & Meet Hyderabad Call Girls Banjara Hills high-profile Ca...
VIP 7001035870 Find & Meet Hyderabad Call Girls Banjara Hills high-profile Ca...VIP 7001035870 Find & Meet Hyderabad Call Girls Banjara Hills high-profile Ca...
VIP 7001035870 Find & Meet Hyderabad Call Girls Banjara Hills high-profile Ca...aditipandeya
 
如何办理圣何塞州立大学毕业证(文凭)SJSU学位证书
如何办理圣何塞州立大学毕业证(文凭)SJSU学位证书如何办理圣何塞州立大学毕业证(文凭)SJSU学位证书
如何办理圣何塞州立大学毕业证(文凭)SJSU学位证书Fir La
 
9654467111 Low Rate Call Girls In Tughlakabad, Delhi NCR
9654467111 Low Rate Call Girls In Tughlakabad, Delhi NCR9654467111 Low Rate Call Girls In Tughlakabad, Delhi NCR
9654467111 Low Rate Call Girls In Tughlakabad, Delhi NCRSapana Sha
 
No 1 AMil Baba In Islamabad No 1 Amil Baba In Lahore No 1 Amil Baba In Faisl...
No 1 AMil Baba In Islamabad  No 1 Amil Baba In Lahore No 1 Amil Baba In Faisl...No 1 AMil Baba In Islamabad  No 1 Amil Baba In Lahore No 1 Amil Baba In Faisl...
No 1 AMil Baba In Islamabad No 1 Amil Baba In Lahore No 1 Amil Baba In Faisl...First NO1 World Amil baba in Faisalabad
 
Call Girl Kolkata Sia 🤌 8250192130 🚀 Vip Call Girls Kolkata
Call Girl Kolkata Sia 🤌  8250192130 🚀 Vip Call Girls KolkataCall Girl Kolkata Sia 🤌  8250192130 🚀 Vip Call Girls Kolkata
Call Girl Kolkata Sia 🤌 8250192130 🚀 Vip Call Girls Kolkataanamikaraghav4
 
VIP 7001035870 Find & Meet Hyderabad Call Girls Abids high-profile Call Girl
VIP 7001035870 Find & Meet Hyderabad Call Girls Abids high-profile Call GirlVIP 7001035870 Find & Meet Hyderabad Call Girls Abids high-profile Call Girl
VIP 7001035870 Find & Meet Hyderabad Call Girls Abids high-profile Call Girladitipandeya
 
Osisko Gold Royalties Ltd - Corporate Presentation, April 23, 2024
Osisko Gold Royalties Ltd - Corporate Presentation, April 23, 2024Osisko Gold Royalties Ltd - Corporate Presentation, April 23, 2024
Osisko Gold Royalties Ltd - Corporate Presentation, April 23, 2024Osisko Gold Royalties Ltd
 
High Profile Call Girls Kolkata Gayatri 🤌 8250192130 🚀 Vip Call Girls Kolkata
High Profile Call Girls Kolkata Gayatri 🤌  8250192130 🚀 Vip Call Girls KolkataHigh Profile Call Girls Kolkata Gayatri 🤌  8250192130 🚀 Vip Call Girls Kolkata
High Profile Call Girls Kolkata Gayatri 🤌 8250192130 🚀 Vip Call Girls Kolkataanamikaraghav4
 
Malad Escorts, (Pooja 09892124323), Malad Call Girls Service
Malad Escorts, (Pooja 09892124323), Malad Call Girls ServiceMalad Escorts, (Pooja 09892124323), Malad Call Girls Service
Malad Escorts, (Pooja 09892124323), Malad Call Girls ServicePooja Nehwal
 
如何办理密苏里大学堪萨斯分校毕业证(文凭)UMKC学位证书
如何办理密苏里大学堪萨斯分校毕业证(文凭)UMKC学位证书如何办理密苏里大学堪萨斯分校毕业证(文凭)UMKC学位证书
如何办理密苏里大学堪萨斯分校毕业证(文凭)UMKC学位证书Fir La
 
The Concept of Humanity in Islam and its effects at future of humanity
The Concept of Humanity in Islam and its effects at future of humanityThe Concept of Humanity in Islam and its effects at future of humanity
The Concept of Humanity in Islam and its effects at future of humanityJohanAspro
 

Recently uploaded (20)

Call Girls 🫤 Mukherjee Nagar ➡️ 9999965857 ➡️ Delhi 🫦 Russian Escorts FULL ...
Call Girls 🫤 Mukherjee Nagar ➡️ 9999965857  ➡️ Delhi 🫦  Russian Escorts FULL ...Call Girls 🫤 Mukherjee Nagar ➡️ 9999965857  ➡️ Delhi 🫦  Russian Escorts FULL ...
Call Girls 🫤 Mukherjee Nagar ➡️ 9999965857 ➡️ Delhi 🫦 Russian Escorts FULL ...
 
Model Call Girl in Uttam Nagar Delhi reach out to us at 🔝9953056974🔝
Model Call Girl in Uttam Nagar Delhi reach out to us at 🔝9953056974🔝Model Call Girl in Uttam Nagar Delhi reach out to us at 🔝9953056974🔝
Model Call Girl in Uttam Nagar Delhi reach out to us at 🔝9953056974🔝
 
VIP Kolkata Call Girl Entally 👉 8250192130 Available With Room
VIP Kolkata Call Girl Entally 👉 8250192130  Available With RoomVIP Kolkata Call Girl Entally 👉 8250192130  Available With Room
VIP Kolkata Call Girl Entally 👉 8250192130 Available With Room
 
VIP 7001035870 Find & Meet Hyderabad Call Girls Banjara Hills high-profile Ca...
VIP 7001035870 Find & Meet Hyderabad Call Girls Banjara Hills high-profile Ca...VIP 7001035870 Find & Meet Hyderabad Call Girls Banjara Hills high-profile Ca...
VIP 7001035870 Find & Meet Hyderabad Call Girls Banjara Hills high-profile Ca...
 
Call Girls in South Ex⎝⎝9953056974⎝⎝ Escort Delhi NCR
Call Girls in South Ex⎝⎝9953056974⎝⎝ Escort Delhi NCRCall Girls in South Ex⎝⎝9953056974⎝⎝ Escort Delhi NCR
Call Girls in South Ex⎝⎝9953056974⎝⎝ Escort Delhi NCR
 
如何办理圣何塞州立大学毕业证(文凭)SJSU学位证书
如何办理圣何塞州立大学毕业证(文凭)SJSU学位证书如何办理圣何塞州立大学毕业证(文凭)SJSU学位证书
如何办理圣何塞州立大学毕业证(文凭)SJSU学位证书
 
Call Girls In South Delhi 📱 9999965857 🤩 Delhi 🫦 HOT AND SEXY VVIP 🍎 SERVICE
Call Girls In South Delhi 📱  9999965857  🤩 Delhi 🫦 HOT AND SEXY VVIP 🍎 SERVICECall Girls In South Delhi 📱  9999965857  🤩 Delhi 🫦 HOT AND SEXY VVIP 🍎 SERVICE
Call Girls In South Delhi 📱 9999965857 🤩 Delhi 🫦 HOT AND SEXY VVIP 🍎 SERVICE
 
9654467111 Low Rate Call Girls In Tughlakabad, Delhi NCR
9654467111 Low Rate Call Girls In Tughlakabad, Delhi NCR9654467111 Low Rate Call Girls In Tughlakabad, Delhi NCR
9654467111 Low Rate Call Girls In Tughlakabad, Delhi NCR
 
Call Girls 🫤 Nehru Place ➡️ 9999965857 ➡️ Delhi 🫦 Russian Escorts FULL ENJOY
Call Girls 🫤 Nehru Place ➡️ 9999965857  ➡️ Delhi 🫦  Russian Escorts FULL ENJOYCall Girls 🫤 Nehru Place ➡️ 9999965857  ➡️ Delhi 🫦  Russian Escorts FULL ENJOY
Call Girls 🫤 Nehru Place ➡️ 9999965857 ➡️ Delhi 🫦 Russian Escorts FULL ENJOY
 
No 1 AMil Baba In Islamabad No 1 Amil Baba In Lahore No 1 Amil Baba In Faisl...
No 1 AMil Baba In Islamabad  No 1 Amil Baba In Lahore No 1 Amil Baba In Faisl...No 1 AMil Baba In Islamabad  No 1 Amil Baba In Lahore No 1 Amil Baba In Faisl...
No 1 AMil Baba In Islamabad No 1 Amil Baba In Lahore No 1 Amil Baba In Faisl...
 
Call Girl Kolkata Sia 🤌 8250192130 🚀 Vip Call Girls Kolkata
Call Girl Kolkata Sia 🤌  8250192130 🚀 Vip Call Girls KolkataCall Girl Kolkata Sia 🤌  8250192130 🚀 Vip Call Girls Kolkata
Call Girl Kolkata Sia 🤌 8250192130 🚀 Vip Call Girls Kolkata
 
VIP 7001035870 Find & Meet Hyderabad Call Girls Abids high-profile Call Girl
VIP 7001035870 Find & Meet Hyderabad Call Girls Abids high-profile Call GirlVIP 7001035870 Find & Meet Hyderabad Call Girls Abids high-profile Call Girl
VIP 7001035870 Find & Meet Hyderabad Call Girls Abids high-profile Call Girl
 
Osisko Gold Royalties Ltd - Corporate Presentation, April 23, 2024
Osisko Gold Royalties Ltd - Corporate Presentation, April 23, 2024Osisko Gold Royalties Ltd - Corporate Presentation, April 23, 2024
Osisko Gold Royalties Ltd - Corporate Presentation, April 23, 2024
 
High Profile Call Girls Kolkata Gayatri 🤌 8250192130 🚀 Vip Call Girls Kolkata
High Profile Call Girls Kolkata Gayatri 🤌  8250192130 🚀 Vip Call Girls KolkataHigh Profile Call Girls Kolkata Gayatri 🤌  8250192130 🚀 Vip Call Girls Kolkata
High Profile Call Girls Kolkata Gayatri 🤌 8250192130 🚀 Vip Call Girls Kolkata
 
Model Call Girl in Udyog Vihar Delhi reach out to us at 🔝9953056974🔝
Model Call Girl in Udyog Vihar Delhi reach out to us at 🔝9953056974🔝Model Call Girl in Udyog Vihar Delhi reach out to us at 🔝9953056974🔝
Model Call Girl in Udyog Vihar Delhi reach out to us at 🔝9953056974🔝
 
Malad Escorts, (Pooja 09892124323), Malad Call Girls Service
Malad Escorts, (Pooja 09892124323), Malad Call Girls ServiceMalad Escorts, (Pooja 09892124323), Malad Call Girls Service
Malad Escorts, (Pooja 09892124323), Malad Call Girls Service
 
如何办理密苏里大学堪萨斯分校毕业证(文凭)UMKC学位证书
如何办理密苏里大学堪萨斯分校毕业证(文凭)UMKC学位证书如何办理密苏里大学堪萨斯分校毕业证(文凭)UMKC学位证书
如何办理密苏里大学堪萨斯分校毕业证(文凭)UMKC学位证书
 
The Concept of Humanity in Islam and its effects at future of humanity
The Concept of Humanity in Islam and its effects at future of humanityThe Concept of Humanity in Islam and its effects at future of humanity
The Concept of Humanity in Islam and its effects at future of humanity
 
young call girls in Yamuna Vihar 🔝 9953056974 🔝 Delhi escort Service
young  call girls in   Yamuna Vihar 🔝 9953056974 🔝 Delhi escort Serviceyoung  call girls in   Yamuna Vihar 🔝 9953056974 🔝 Delhi escort Service
young call girls in Yamuna Vihar 🔝 9953056974 🔝 Delhi escort Service
 
young Call girls in Dwarka sector 1🔝 9953056974 🔝 Delhi escort Service
young Call girls in Dwarka sector 1🔝 9953056974 🔝 Delhi escort Serviceyoung Call girls in Dwarka sector 1🔝 9953056974 🔝 Delhi escort Service
young Call girls in Dwarka sector 1🔝 9953056974 🔝 Delhi escort Service
 

Q22015 investorupdatepsxpsxp

  • 2. Investor Update Second Quarter 2015 Execution NYSE: PSX www.phillips66.com
  • 3. Cautionary Statement 3 This presentation contains certain forward-looking statements within the meaning of Section 27A of the Securities Act of 1933, as amended, and Section 21E of the Securities Exchange Act of 1934, as amended, which are intended to be covered by the safe harbors created thereby. Words and phrases such as “is anticipated,” “is estimated,” “is expected,” “is planned,” “is scheduled,” “is targeted,” “believes,” “intends,” “objectives,” “projects,” “strategies” and similar expressions are used to identify such forward-looking statements. However, the absence of these words does not mean that a statement is not forward-looking. Forward-looking statements relating to Phillips 66’s operations (including joint venture operations) are based on management’s expectations, estimates and projections about the company, its interests and the energy industry in general on the date this presentation was prepared. These statements are not guarantees of future performance and involve certain risks, uncertainties and assumptions that are difficult to predict. Therefore, actual outcomes and results may differ materially from what is expressed or forecast in such forward-looking statements. Factors that could cause actual results or events to differ materially from those described in the forward-looking statements include fluctuations in NGL, crude oil and natural gas prices, and petrochemical and refining margins; unexpected changes in costs for constructing, modifying or operating our facilities; unexpected difficulties in manufacturing, refining or transporting our products; lack of, or disruptions in, adequate and reliable transportation for our NGL, crude oil, natural gas and refined products; potential liability from litigation or for remedial actions, including removal and reclamation obligations, under environmental regulations; limited access to capital or significantly higher cost of capital related to illiquidity or uncertainty in the domestic or international financial markets; and other economic, business, competitive and/or regulatory factors affecting Phillips 66’s businesses generally as set forth in our filings with the Securities and Exchange Commission. Phillips 66 is under no obligation (and expressly disclaims any such obligation) to update or alter its forward-looking statements, whether as a result of new information, future events or otherwise. This presentation includes non-GAAP financial measures. You can find the reconciliations to comparable GAAP financial measures at the end of the presentation materials or in the “Investors” section of our website.
  • 4. Phillips 66 4 Diversified portfolio of leading downstream businesses Resilient cash flow through the commodity cycle Disciplined capital allocation Chemicals and Midstream growth Share repurchases and dividends Financial flexibility Freeport LPG Terminal
  • 5. 0.0 1.0 2.0 3.0 1Q 2013 2Q 3Q 4Q 1Q 2014 2Q 3Q 4Q 1Q 2015 2Q Average M&S Chemicals Midstream Refining Segment Adjusted EBITDA $B Phillips 66 Financial Highlights 5 Adjusted EBITDA Capital expenditures Distributions 2Q 2015 $2.1 B $1.2 B $0.6 B See appendix for footnotes.
  • 6. Operating Excellence 6 Industry Average Total Recordable Rates Incidents per 200,000 Hours Worked ’08 ’10 ’12 ’14 880 450 430 300 2008 2010 2012 2014 Refining Environmental Metrics 93% 90% 93% 94% 2008 2010 2012 2014 Refining Capacity Utilization % 6.5 5.5 5.7 5.8 0.3 2008 2010 2012 2014 Midstream Growth Operating Costs and SG&A $B Phillips 66 CPChem DCP See appendix for footnotes.
  • 7. Energy Landscape 7 Historical and Forward Crude Oil Prices $/bbl Markets seeking balance Global economic boost from lower energy prices should stimulate demand Reduced E&P investment slows U.S. infrastructure growth Source: Bloomberg 0 30 60 90 120 2009 2011 2013 2015 2017 Brent WTI
  • 8. Segment Strategy 8 Refining: Enhance Returns Midstream: Growth Chemicals: Growth Marketing and Specialties: Selective Growth Execute Sweeny hub Grow integrated Transportation system PSXP as a funding vehicle Expand DCP G&P Pursue organic and M&A opportunities Grow CPChem organically Advance olefins and polyolefins projects Capitalize on domestic feedstock advantage Leverage proprietary technology Optimize crude slate Expand export capability Increase yields Maintain cost discipline Enhance portfolio Expand European retail marketing Grow lubricants Ensure domestic refinery pull-through
  • 9. 2018E EBITDA2014 EBITDA Fee Based Market Based Midstream 9 NGL NGL fractionation capacity growing to 200 MBD Fractionator One start up 3Q 2015 LPG export facility start up 4Q 2016 Transportation Beaumont crude/products hub Bakken to Patoka/Beaumont pipelines Bayou Bridge Pipeline DCP EBITDA excluded. See appendix for additional footnotes.
  • 10. 0.3 1.1 0.7 0.9 0.4 1.2 PSXP 2Q 2015 Run-Rate EBITDA PSX Operating Assets Projects Under Construction Planned Run Rate EBITDA 10 Midstream EBITDA Growth $B DCP EBITDA excluded. See appendix for additional footnotes. 2018E and in-flight projects ~ 2.3 PSXP EBITDA EBITDA Remaining at PSX
  • 11. Phillips 66 Partners Growth Fee-based business model Growing cash flows 30% distribution CAGR through 2018 Funding Midstream growth 11 0.3 1.1 1.9 8 - 10 2Q 2015 2018E 2Q 2015 2018E Dropdown Proceeds Distributions $B Run-Rate Annual EBITDA Cumulative Cash to PSX since IPO See appendix for footnotes.
  • 12. DCP Midstream 12 Major U.S. midstream business Largest NGL producer Largest natural gas processing company Third largest NGL pipeline operator Footprint of strategically integrated assets Growing gathering and processing business
  • 13. Chemicals Environment 13 Narrowing spread of ethane/LPG feedstocks Record 2014 ethane chain margins, expect good chain margins to continue Expect high operating rates Global Ethylene Production Cost Supply Curve$/MT 0 100 200 300 400 500 600 700 800 900 0 2 4 6 8 10 12 M.E. Ethane N.A. LPG N.A. Ethane M.E. LPG/ Naphtha Rest of World N.A. Naphtha Asia Naphtha Asia LPG W. Europe LPG W. Europe Naphtha Production MM Tons Source: Chief Economist Office; Wood Mackenzie.
  • 14. CPChem 14 Leading petrochemical company Feedstock advantaged 10.5 B Lb/yr worldwide ethylene capacity Strong global aromatics position USGC Petrochemicals project on track $6 B estimated capital spend 50% complete, start-up 2Q 2017 3.3 B Lb/yr ethane cracker 2.2 B Lb/yr polyethylene production Self-funded capital program $1.3 - 1.6 B/yr incremental EBITDA by 2018 $1.3 – $1.6 B estimated incremental EBITDA based on 2012 industry margins. See appendix for additional footnotes. Phillips 66 Chemicals Adjusted ROCE 0% 5% 10% 15% 20% 25% 30% 35% 2009 2010 2011 2012 2013 2014 Range of peer ROCE Phillips 66 Chemicals Adjusted ROCE
  • 15. Atlantic Basin/Europe 588 MBD Gulf Coast 738 MBD Central Corridor 492 MBD West Coast 360 MBD Light/ Medium Heavy Worldwide Refining 15 Optimizing crude slate Improving yields Expanding export capability Managing costs Enhancing portfolio 2.2 MMBD Global Refining Capacity
  • 16. 0.0 0.5 1.0 1.5 2009 2010 2011 2012 2013 2014 U.S. Marketing International Marketing Specialties Marketing and Specialties 16 High-returning businesses U.S. Marketing Wholesale network ~8,600 branded sites International Marketing Low-cost, high-volume business ~1,520 sites Specialties Finished lubricants Base oil joint venture Adjusted EBITDA $B Avg. $1.2 B
  • 17. 6.4 8.4 2009-2014 Avg. 2018E Refining Midstream Chemicals M&S EBITDA Growth 17 Segment Adjusted EBITDA $B More than 30% EBITDA growth Cash flows less volatile by 2018E 2018E portfolio shift to higher-value businesses 20% Midstream 25% Chemicals 40% Refining 15% Marketing & Specialties Corporate not included in bars on chart, but included in totals. Midstream EBITDA reflects Phillips 66’s ownership percentage of PSXP
  • 18. Financial Strategy 18 Ensuring financial flexibility Investment grade credit rating Adequate liquidity Funding transformational growth Cash from operations Dropdowns to PSXP Returning capital to shareholders Dividend growth Ongoing share repurchases Distributions Reinvestment 2014E – 2016E
  • 19. 2015 Capital Budget 19 PSX Sustaining Refining Returns M&S Growth Midstream Growth PSXP Growth $3.4 B Growth capital Sweeny Fractionator One LPG Export Terminal Bakken to Patoka/Beaumont pipelines Beaumont Terminal expansion $0.2 B for PSXP projects $1.2 B Sustaining capital
  • 20. Distributions 20 Dividend Growth Quarterly ¢/share Share Count and Capital Returned 180% dividend growth 624 MM 590 MM 538 MM $7.0 B $1.4 B remaining authorized share repurchases 3Q 2012 4Q 2013 2Q 2015 3Q 2012 2Q 2015 20 56 4Q 2013 See appendix for footnotes.
  • 21. Midstream PSXP Chemicals M&S Refining Creating Value 21 Enterprise Value 2014 2018E Uniquely positioned portfolio Disciplined capital allocation More than 30% EBITDA growth Multiple expansion Commitment to distributions Strong balance sheet
  • 22. Institutional Investors Contact Kevin Mitchell Vice President, Investor Relations C.W. Mallon Manager, Investor Relations InvestorRelations@p66.com 832-765-2297
  • 23. Investor Update August 2015 NYSE: PSXP www.phillips66partners.com
  • 24. Cautionary Statement 24 This presentation contains forward-looking statements as defined under the federal securities laws, including projections, plans and objectives. Although Phillips 66 Partners believes that expectations reflected in such forward-looking statements are reasonable, no assurance can be given that such expectations will prove to be correct. In addition, these statements are subject to certain risks, uncertainties and other assumptions that are difficult to predict and may be beyond Phillips 66 Partners’ control. If one or more of these risks or uncertainties materialize, or if underlying assumptions prove incorrect, actual results may vary materially from what Phillips 66 Partners anticipated, estimated, projected or expected. The key risk factors that may have a direct bearing on the forward-looking statements in the presentation are the accuracy of our assumptions used to estimate the benefits to be realized from Phillips 66 Partners’ acquisition of interests in certain joint ventures that own or control midstream pipeline assets (the “acquisition”), our ability to successfully integrate the assets into our operations, the decisions made by Explorer Pipeline Company, DCP Sand Hills Pipeline, LLC, and DCP Southern Hills Pipeline, LLC regarding distributions these entities make to us as an equity owner, and other factors as described in the filings that Phillips 66 Partners makes with the Securities and Exchange Commission. In light of these risks, uncertainties and assumptions, the events described in the forward-looking statements might not occur or might occur to a different extent or at a different time than as described. All forward-looking statements in this presentation are made as of the date hereof and Phillips 66 Partners undertakes no obligation to publicly update or revise any forward-looking statements, whether as a result of new information, future events or otherwise. This presentation is not, and under no circumstance is to be construed to be, a prospectus, offering memorandum, or advertisement and is not an offer to sell securities. The SEC and state securities regulators have not reviewed or determined if this presentation is truthful or complete. Non-GAAP Financial Measure Disclosure Today’s presentation includes certain non-GAAP financial measures as defined under Regulation G of the Securities Exchange Act of 1934, as amended. A reconciliation of those measures to the most directly comparable GAAP measures is available in the appendix to this presentation.
  • 25. Phillips 66 Partners Ownership Structure 25 Phillips 66 Partners GP LLC (PSXP General Partner) General Partner Units IDRs Operating Subsidiaries PSXP Public Unitholders (NYSE: PSX) (NYSE: PSXP) 100% ownership interest 29% limited partner interest Joint Ventures 2% general partner interest 69% limited partner interest
  • 26. Phillips 66 Partners 26 Strong alignment with Phillips 66 Highly integrated assets Stable and predictable cash flows Significant growth potential Financial flexibility Pecan Grove Marine Dock
  • 27. Phillips 66 Partners Financial Highlights 27 Distributable cash flow Adjusted EBITDA Acquired interest in three pipeline assets in Q1 2015 $47.8 MM $57.0 MM 0.2125 0.2248 0.2743 0.3017 0.3168 0.34 0.37 0.40 0.10 0.15 0.20 0.25 0.30 0.35 0.40 0.45 3Q 2013 4Q 2013 1Q 2014 2Q 2014 3Q 2014 4Q 2014 1Q 2015 2Q 2015 * (MQD) Coverage Ratio 1.13x 1.10x 1.10x 1.44x 1.32x 1.28x 1.14x 1.15x Distribution / LP Unit ($) * Represents the minimum quarterly distribution for 3Q 2013, actual distribution of $0.1548 equal to MQD prorated See appendix for footnotes. 2Q 2015
  • 28. Q1 2015 Acquisition 28 Drop down assets 33.3% interest in Sand Hills NGL pipeline 33.3% interest in Southern Hills NGL pipeline 19.5% interest in Explorer refined products pipeline $1.1 B acquisition Asset-level 2015E EBITDA of $115 million Implied 9.5x purchase multiple on assets’ 2015E EBITDA Assets supported by long-term, fee-based agreements, primarily under take-or-pay terms Additional organic growth opportunities through identified expansion projects
  • 29. 29 $275 MM In Announced Organic Growth Cross-Channel Connector Pipeline Eagle Ford Crude Gathering System Bakken Joint Ventures • Capital cost: $22 MM • Increases access to export docks for shippers in Houston Ship Channel • Expected completion in 4Q 2015 • Capital cost: $50 MM • Connects Eagle Ford crude oil production to third-party pipelines • Initial operations commenced January 2015; expected completion in 3Q 2015 • Capital cost: $160 MM (PSXP share) • 100 MBD Palermo crude oil rail-loading facility, 76-mile Sacagawea Pipeline and central delivery facility for gathering systems • Provides increased logistics options for shippers in the Bakken region • Expected terminal completion in 4Q 2015; pipeline completion in 2016 Sand Hills Pipeline • Capital cost: ~ $45 MM (PSXP share) • Adding lateral connections and increasing pumping capacity beyond 200 MBD See appendix for footnotes.
  • 30. 30 Highly Integrated Assets Palermo Rail Terminal expected to be operational Q4 2015.
  • 31. 31 Fee-based, Long-term contracts provide stability Asset Initial Term (years) Maximum Term with Options (years) Clifton Ridge to Lake Charles 10 20 Sweeny to Pasadena 10 20 Hartford Connector 23 * 23 Gold Line 10 15 Sand Hills 15 15 Southern Hills 15 15 Explorer Various Various Clifton Ridge terminal 5 20 Clifton Ridge / Pecan grove docks 5 20 Pasadena terminal 5 20 Pasadena and Hartford truck racks 5 20 Gold Line terminals 5 15 Medford Spheres 10 20 Bayway Rail Rack 10 20 Ferndale Rail Rack 10 20 * Includes PSX JV Wood River Refinery to Hartford and Hartford to Explorer pipelines. The term of the Hartford Connector throughput and deficiency agreement began in January 2008 PipelinesTerminals/Storage
  • 32. Adjusted EBITDA and DCF 32 34.3 33.4 37.2 41.9 47.8 Q2 2014 Q3 2014 Q4 2014 Q1 2015 Q2 2015 Distributable Cash Flow ($MM) 37.6 35.9 43.7 49.0 57.0 Q2 2014 Q3 2014 Q4 2014 Q1 2015 Q2 2015 Adjusted EBITDA ($MM)
  • 33. Balanced Debt Maturity Profile 33 2020 2025 2045 5-year notes 2.646% coupon 10-year notes 3.605% coupon 30-year notes 4.68% coupon $1.1 B debt issuance February 2015 5-Year $300 MM notes 10-Year $500 MM notes 30-Year $300 MM notes Average cost of 3.64% BBB (stable) / Baa3 (stable) $300MM $500MM $300MM
  • 34. Financial Flexibility 34 Investment grade credit rating Target 3.5x debt / EBITDA 30% distribution CAGR through 2018 Target 1.1x annual coverage ratio Support Phillips 66 Midstream growth
  • 35. Closed 1st acquisition - $700 MM Closed 2nd acquisition - $340 MM -30% -10% 10% 30% 50% 70% 90% 110% 130% 150% 170% 190% 210% 230% 250% Jul-13 Sep-13 Nov-13 Jan-14 Mar-14 May-14 Jul-14 Sep-14 Nov-14 Jan-15 Mar-15 May-15 Jul-15 35 Total Return Since IPO PSXP 172% Alerian MLP Index -10% IPO Closed 3rd acquisition - $1.1 B Source: Bloomberg
  • 36. Institutional Investors Contact Kevin Mitchell - Investor Relations Kevin.Mitchell@p66.com 832-765-2297 C.W. Mallon - Investor Relations C.W.Mallon@p66.com 832-765-2297
  • 37. Footnotes 37 Slide 5 The chart represents look-through EBITDA and the Corporate segment EBITDA is excluded. Average Corporate adjusted quarterly EBITDA for 2013-2014 is ($86) MM. Slide 6 Injury statistics do not include major projects. Industry Averages are from: Phillips 66 – American Fuel & Petrochemical Manufacturers (AFPM) refining data, CPChem – American Chemistry Council (ACC), DCP – Gas Processors Association (GPA). Refining Environmental Event – is a key operational compliance indicator and generally reflects events when an exceedance of a numeric emissions or discharge limit occurs. It includes all events regardless of reporting frequency resulting in permit or regulatory-based numeric emissions exceedances. It also includes immediately agency-reportable exceedances. Slide 9 EBITDA excludes DCP but includes 100% PSXP EBITDA. Slide 10 PSXP EBITDA includes EBITDA attributable to Phillips 66 noncontrolling interests.
  • 38. Footnotes 38 Slide 11 PSXP is a consolidated subsidiary of PSX. Accordingly, quarterly cash distributions paid from PSXP to PSX, and consideration paid by PSXP to PSX in a dropdown transaction, both eliminate in consolidation and do not impact PSX’s consolidated cash balance. PSX’s consolidated cash balance increases to the extent PSXP funds consideration for a dropdown transaction with public debt and equity offerings Slide 14 Growth capital reflects 100% CPChem growth capital. Growth EBITDA (& start-up year) includes: 1-hexene (2014), 10th Sweeny furnace (2014), NAO expansion project (2015) and USGC petrochemical project (2017). Peers: Dow, ExxonMobil Chemical, LyondellBasell, Westlake Slide 17 The chart represents look-through EBITDA and the Corporate segment EBITDA is excluded. Slide 20 Capital returned includes the 2014 PSPI share exchange and excludes dividends payments Slide 27 Debt and equity issuance amounts are gross of fees. Transaction between PSX and PSXP eliminate in consolidation. Slide 29 $275 MM organic capital includes 2014 and 2015 spending
  • 39. 22.4 22.0 23.2 6.2 8.7 9.0 5.4 5.2 5.1 22% 28% 28% 2013 2014 2Q 2015 22.0 21.6 22.4 6.2 8.7 7.9 5.0 5.2 5.0 22% 29% 26% 2013 2014 2Q 2015 Equity $B Debt $B Cash & Cash Equivalents $B Debt to Capital Capital Structure 39 20- 30% Fully consolidated Excluding PSXP
  • 40. Free Cash Flow 40 0.8 0.5 0.3 CFO (excl. WC) Sustaining Capex Free Cash Flow 0.9 0.7 0.2 CFO (excl. WC) Sustaining Capex Free Cash Flow Midstream $B Chemicals $B Average from 2009-2014, DCP Midstream, CPChem and WRB free cash flow calculated at the enterprise level 2.5 1.6 0.9 CFO (excl. WC) Sustaining Capex Free Cash Flow 0.7 0.6 0.1 CFO (excl. WC) Sustaining Capex Free Cash Flow Refining $B Marketing & Specialties $B
  • 41. 32% 27% 13% 12% M&S Chemicals Midstream Refining -10% 0% 10% 20% 30% 40% Average Capital Employed ($B) Corporate -5% 41 2014 Adjusted ROCE P66 Total 14% 0 2 4 6 8 10 12 14 16 18 20 22 24 26 28 30
  • 42. 36% 27% 15% 17% M&S Chemicals Refining Midstream -10% 0% 10% 20% 30% 40% Average Capital Employed ($B) Corporate -2% 42 2014 Adjusted CROCE CROCE defined as Adjusted Net Income plus Depreciation and Amortization divided by Average Capital Employed. P66 Total 17% 0 2 4 6 8 10 12 14 16 18 20 22 24 26 28 30
  • 43. -2 0 2 4 6 8 10 2009 2010 2011 2012 2013 2014 2018E Refining Midstream Chemicals M&S Corporate $B 43 Adjusted EBITDA Average is 2009 through 2014. Avg. $6.4 B
  • 44. 1.1 1.9 2.5 3.4 3.4 4.2 2009 2010 2011 2012 2013 2014 Adjusted EBITDA $B 44 Chemicals – CPChem Reflects 100% CPChem.
  • 45. 1.0 1.2 1.4 0.9 1.0 0.8 2009 2010 2011 2012 2013 2014 Adjusted EBITDA $B 45 Midstream – DCP Reflects 100% DCP Midstream.
  • 46. 2015 Sensitivities – Phillips 66 46 Sensitivities shown above are independent and are only valid within a limited price range. Annual Net Income $MM Midstream - DCP (net to Phillips 66) 10¢/Gal Increase in NGL price 30 $1/MMBtu Increase in Natural Gas price 25 $10/BBL Increase in WTI price 15 Chemicals - CPChem (net to Phillips 66) 1¢/Lb Increase in Chain Margin (Ethylene, Polyethylene, NAO) 35 Worldwide Refining $1/BBL Increase in Gasoline Margin 220 $1/BBL Increase in Distillate Margin 200 $1/BBL Widening LLS / Maya Differential (LLS less Maya) 50 $1/BBL Widening WTI / WCS Differential (WTI less WCS) 40 $1/BBL Widening WTI / WTS Differential (WTI less WTS) 15 $1/BBL Widening LLS / Medium Sour Differential (LLS less Medium Sour) 15 $1/BBL Widening ANS / WCS Differential (ANS less WCS) 10 10¢/MMBtu Increase in Natural Gas price (10) Impacts due to Actual Crude Feedstock Differing from Feedstock Assumed in Market Indicators:
  • 47. Phillips 66 Capital Program 47 Sustaining Growth Total Capital Expenditures and Investments Consolidated Midstream(1) Transportation 148 1,084 1,232 NGL 19 1,912 1,931 167 2,996 3,163 Chemicals - - - Refining(2) 813 299 1,112 Marketing and Specialties 78 92 170 Corporate(2) 155 - 155 1,213 3,387 4,600 Selected Equity Affiliates DCP 125 275 400 CPChem 187 1,266 1,453 WRB 150 53 203 462 1,594 2,056 Capital Program(3) Midstream Transportation 148 1,084 1,232 DCP 125 275 400 NGL 19 1,912 1,931 292 3,271 3,563 Chemicals 187 1,266 1,453 Refining 963 352 1,315 Marketing and Specialties 78 92 170 Corporate 155 - 155 1,675 4,981 6,656 (1) Includes 100% of Phillips 66 Partners Millions of Dollars 2015 Budget (2) Includes non-cash capitalized leases of $11 million in Refining and $21 million in Corporate and Other (3) Includes Phillips 66's share of capital spending by DCP, CPChem and WRB, which are expected to be self- funded.
  • 48. Non-GAAP Reconciliations 48 Adjusted EBITDA forecasts were derived on an EBITDA-only basis. Accordingly, elements of net income including tax and depreciation information are not available. Together, these items generally result in a significant uplift in EBITDA over net income. 2018E Adjusted EBITDA/ EBITDA project backlog post 2018 PSXP Run Rate EBITDA PSXP 2014 and 2018 run rate EBITDA estimates were derived on an EBITDA-only basis. Accordingly, elements of net income including tax and depreciation information are not available. Together, these items generally result in a significant uplift in EBITDA over net income. Run rate EBITDA reflects annualized EBITDA projections of assets immediately upon acquisition. Millions of Dollars Year ending February 29 2016 Reconciliation of PSXP Estimated EBITDA to Estimated Net Income* Estimated net income 82$ Plus: Depreciation 20 Interest expense 4 Income taxes 9 Estimated EBITDA 115$ *Amounts reflect the sum of EBITDA and net income forecasts within each joint venture, multiplied by PSXP's expected ownership interest. PSXP Run Rate EBITDA PSXP 2014 and 2018 run rate EBITDA estimates were derived on an EBITDA-only basis. Accordingly, elements of net income including tax and depreciation information are not available. Together, these items generally result in a significant uplift in EBITDA over net income. Run rate EBITDA reflects annualized EBITDA projections of assets immediately upon acquisition.
  • 49. 49 Non-GAAP Reconciliations 2009 2010 2011 2012 2013 2014 Phillips 66 Chemicals Segment ROCE Numerator Net Income 228$ 486 716 823 987 1,137 After-tax interest expense - - - - - - GAAP ROCE earnings 228 486 716 823 987 1,137 Special Items - - - 157 - 72 Adjusted ROCE earnings 228$ 486 716 980 987 1,209 Denominator GAAP average capital employed* 2,024$ 2,275 2,563 3,142 3,825 4,489 *Total equity plus debt. Annualized Adjusted ROCE (percent) 11% 21% 28% 31% 26% 27% Annualized GAAP ROCE (percent) 11% 21% 28% 26% 26% 25% Millions of Dollars
  • 50. Non-GAAP Reconciliations 50 Marketing & Specialties Adjusted EBITDA Reconciliation 2009 2010 2011 2012 2013 2014 2009-2014 Average U.S. Marketing U.S. Marketing net income attributable to Phillips 66 232$ 338 154 116 426 439 284 Plus: Provision for income taxes 151 225 120 56 248 251 175 Net interest expense (47) (41) (32) - (0) (0) (20) Depreciation and amortization 34 30 30 29 15 15 25 U.S. Marketing EBITDA 370$ 553 271 201 689 705 465 Adjustments (pretax): Gain on asset dispositions (22)$ (234) - (4) - - (43) Impairments 59 12 - - - - 12 Pending claims and settlements - (56) - 62 (25) (44) (11) Tax law impacts - - - - (6) - (1) U.S. Marketing Adjusted EBITDA* 407$ 275 271 259 658 661 422 International Marketing International Marketing net income attributable to Phillips 66 155$ 110 256 159 261 397 223 Plus: Provision for income taxes 216 52 111 105 59 75 103 Net interest expense 1 - - - - - 0 Depreciation and amortization 92 104 114 107 80 68 94 International Marketing EBITDA 463$ 266 481 371 400 540 420 Adjustments (pretax): Gain on asset dispositions -$ - 3 - - (125) (20) International Marketing Adjusted EBITDA* 463$ 266 484 371 400 415 400 Millions of Dollars Marketing & Specialties Adjusted EBITDA Reconciliation 2009 2010 2011 2012 2013 2014 2009-2014 Average Specialties Specialties net income attributable to Phillips 66 154$ 207 283 269 206 199 220 Plus: Provision for income taxes 90 121 175 158 126 114 131 Net interest expense 2 - - - - - 0 Depreciation and amortization 6 7 8 11 8 11 9 Specialties EBITDA 252$ 335 466 438 341 324 359 Adjustments (pretax): Gain on asset dispositions -$ - (43) - (40) - (14) Exit of a business line - - - - 54 - 9 Specialties Adjusted EBITDA* 252$ 335 423 438 355 324 354 Marketing & Specialties Consolidated Segment Marketing and Specialties net income attributable to Phillips 66 541$ 656 693 544 894 1,034 727 Plus: Provision for income taxes 457 398 405 319 433 440 409 Net interest expense (44) (41) (32) - (0) (0) (20) Depreciation and amortization 131 140 153 147 103 95 128 Marketing and Specialties EBITDA 1,085$ 1,153 1,218 1,010 1,430 1,569 1,244 Adjustments (pretax): Gain on asset dispositions (22)$ (234) (40) (4) (40) (125) (78) Impairments 59 12 - - - - 12 Pending claims and settlements - (56) - 62 (25) (44) (11) Exit of a business line - - - - 54 - 9 Tax law impacts - - - - (6) - (1) Marketing and Specialties Adjusted EBITDA 1,122$ 875 1,178 1,068 1,413 1,400 1,176 Millions of Dollars
  • 51. Non-GAAP Reconciliations 51 Adjusted EBITDA by Segment Reconciliation 2009 2010 2011 2012 2013 2014 2009-2014 Average Midstream Midstream net income attributable to Phillips 66 384$ 384 2,147 52 469 507 657 Plus: Net income attributable to noncontrolling interests 3 5 5 7 17 35 12 Provision for income taxes 204 184 453 29 264 309 241 Depreciation and amortization 99 74 82 83 88 91 86 Midstream EBITDA 690$ 647 2,687 171 838 942 996 Adjustments (pretax): EBITDA attributable to Phillips 66 noncontrolling interests -$ (9) (10) (13) (24) (45) (17) Proportional share of selected equity affiliates income taxes 9 3 1 - 4 3 3 Proportional share of selected equity affiliates net interest 119 119 97 85 110 118 108 Proportional share of selected equity affiliates depreciation and amortization 187 188 202 131 139 150 166 Lower-of-cost-or-market inventory adjustments - - - - - 2 0 Gain on asset dispositions (15) - (1,830) - - - (308) Gain on share issuance by equity affiliate (135) - - - - - (23) Impairments 70 - 6 523 - - 100 Pending Claims and settlements - - - (37) - - (6) Hurricane-related costs - - - 2 - - 0 Midstream Adjusted EBITDA* 925$ 948 1,153 862 1,067 1,170 1,021 * Proportional share of selected equity affiliates is net of noncontrolling interests. Chemicals Chemicals net income attributable to Phillips 66 228$ 486 716 823 986 1,137 729 Plus: Provision for income taxes 67 194 252 366 375 495 292 Chemicals EBITDA 295$ 680 968 1,189 1,361 1,632 1,021 Adjustments (pretax): Proportional share of selected equity affiliates income taxes 37$ 59 75 79 93 111 76 Proportional share of selected equity affiliates net interest 34 35 16 13 10 9 20 Proportional share of selected equity affiliates depreciation and amortization 192 183 198 213 246 258 215 Impairments - - - 43 - 88 22 Premium on early debt retirement - - - 144 - - 24 Lower-of-cost-or-market inventory adjustments - - - - - 3 1 Chemicals Adjusted EBITDA 558$ 957 1,257 1,681 1,710 2,101 1,377 Millions of Dollars
  • 52. Non-GAAP Reconciliations 52 Adjusted EBITDA by Segment Reconciliation 2009 2010 2011 2012 2013 2014 2009-2014 Average Refining Refining net income (loss) attributable to Phillips 66 (556)$ (661) 1,369 3,091 1,747 1,771 1,127 Plus: Provision for income taxes (296) (121) 808 1,998 1,035 696 687 Net interest expense (1) (2) (1) - - - (1) Depreciation and amortization 641 659 664 655 685 704 668 Refining EBITDA (212)$ (125) 2,840 5,744 3,467 3,171 2,481 Adjustments (pretax): Proportional share of selected equity affiliates income taxes 1$ 1 4 5 (4) 3 2 Proportional share of selected equity affiliates net interest (179) (160) (140) (118) (95) (19) (119) Proportional share of selected equity affiliates depreciation and amortization 178 169 184 236 237 245 208 Net (gain) loss on asset dispositions - - 234 (185) - (145) (16) Impairments - 1,500 500 606 - 131 456 Canceled projects - 106 44 - - - 25 Pending claims and settlements 39 - - 31 - 23 16 Severence accruals - 28 24 - - - 9 Hurrican-related costs - - - 54 - - 9 Tax law impacts - - - - (22) - (4) Lower-of-cost-or-market inventory adjustments - - - - - 40 7 Refining Adjusted EBITDA (173)$ 1,519 3,690 6,373 3,583 3,449 3,074 Millions of Dollars
  • 53. Non-GAAP Reconciliations 53 Adjusted EBITDA by Segment Reconciliation 2009 2010 2011 2012 2013 2014 2009-2014 Average Marketing and Specialties Marketing and Specialties net income attributable to Phillips 66 541$ 655 692 544 894 1,034 727 Plus: Provision for income taxes 457 398 406 319 433 441 409 Net interest expense (44) (40) (32) - - - (19) Depreciation and amortization 132 140 152 147 103 95 128 Marketing and Specialties EBITDA 1,086$ 1,153 1,218 1,010 1,430 1,570 1,245 Adjustments (pretax): Gain on asset dispositions (22)$ (234) (40) (4) (40) (125) (78) Impairments 59 12 - - - - 12 Pending claims and settlements - (56) - 62 (25) (44) (11) Exit of a business line - - - - 54 - 9 Tax law impacts - - - - (6) - (1) Marketing and Specialties Adjusted EBITDA 1,123$ 875 1,178 1,068 1,413 1,401 1,176 Corporate Corporate net income (loss) attributable to Phillips 66 (140)$ (159) (192) (434) (431) (393) (292) Plus: Provision for income taxes (75) (93) (97) (239) (263) (287) (176) Net interest expense 1 1 17 231 258 246 126 Depreciation and amortization 1 1 4 21 71 105 34 Corporate EBITDA (213)$ (250) (268) (421) (365) (329) (308) Adjustments (pretax): Impairments -$ - - 25 - - 4 Repositioning Costs - - - 85 - - 14 Corporate Adjusted EBITDA (213)$ (250) (268) (311) (365) (329) (289) Millions of Dollars
  • 54. Non-GAAP Reconciliations 54 Adjusted EBITDA by Segment Reconciliation 2009 2010 2011 2012 2013 2014 2009-2014 Average Phillips 66 Phillips 66 net income attributable to Phillips 66 476$ 735 4,775 4,124 3,726 4,762 3,100 Less: Income from discontinued operations 19 30 43 48 61 706 151 Plus: Net income attributable to noncontrolling interests 3 5 5 7 17 35 12 Provision for income taxes 357 562 1,822 2,473 1,844 1,654 1,452 Net interest expense (44) (41) (16) 231 258 246 106 Depreciation and amortization 873 874 902 906 947 995 916 Phillips 66 EBITDA 1,646$ 2,105 7,445 7,693 6,731 6,986 5,434 Adjustments (pretax): EBITDA attributable to Phillips 66 noncontrolling interests -$ (9) (10) (13) (24) (45) (17) Proportional share of selected equity affiliates income taxes 47 63 80 84 93 117 81 Proportional share of selected equity affiliates net interest (26) (6) (27) (20) 25 108 9 Proportional share of selected equity affiliates depreciation and amortization 557 540 584 580 622 653 589 Gain on asset dispositions (37) (234) (1,636) (189) (40) (270) (401) Gain on share issuance by equity affiliate (135) - - - - - (23) Impairments 129 1,512 506 1,197 - 219 594 Cancelled projects - 106 44 - - - 25 Severence accruals - 28 24 - - - 9 Exit of a business line - - - - 54 - 9 Pending claims and settlements 39 (56) - 56 (25) (21) (1) Premium on early debt retirement - - - 144 - - 24 Repositioning Costs - - - 85 - - 14 Hurricane-related costs - - - 56 - - 9 Tax law impacts - - - - (28) - (5) Lower-of-cost-or-market inventory adjustments - - - - - 45 8 Phillips 66 Adjusted EBITDA 2,220$ 4,049 7,010 9,673 7,408 7,792 6,359 Millions of Dollars
  • 55. Non-GAAP Reconciliations 55 Low High 100% CPChem Incremental Project Earnings Projections Estimated incremental net income 1,000$ 1,313 Plus: Estimated income taxes 20 27 Estimated net interest expense - - Estimated depreciation 280 260 Estimated EBITDA 1,300$ 1,600 Millions of Dollars
  • 56. Non-GAAP Reconciliations 56 Phillips 66 Midstream Chemicals Refining Marketing & Specialties Corporate Phillips 66 ROCE Numerator Net Income 4,797$ 541 1,137 1,771 1,034 (393) After-tax interest expense 173 - - - - 173 GAAP ROCE earnings 4,970 541 1,137 1,771 1,034 (220) Special Items (981) 1 72 (195) (152) 0 Adjusted ROCE earnings 3,990$ 542 1,209 1,576 882 (220) Denominator GAAP average capital employed* 29,634$ 4,207 4,489 13,377 2,743 4,722 Discontinued Operations (96) - - - - - Adjusted average capital employed* 29,537$ 4,207 4,489 13,377 2,743 4,722 *Total equity plus debt. Annualized Adjusted ROCE (percent) 14% 13% 27% 12% 32% -5% Annualized GAAP ROCE (percent) 17% 13% 25% 13% 38% -5% Phillips 66 Midstream Chemicals Refining Marketing & Specialties Corporate Phillips 66 CROCE Numerator Net Income 4,797$ 541 1,137 1,771 1,034 (393) After-tax interest expense 173 - - - - 173 Depreciation and amortization 995 91 - 704 95 106 5,966 633 1,137 2,475 1,129 (114) Special Items (981) 1 72 (195) (152) 0 Adjusted CROCE earnings 4,985$ 634 1,209 2,280 977 (114) Denominator GAAP average capital employed* 29,634$ 4,207 4,489 13,377 2,743 4,722 Discontinued Operations (96) - - - - - Adjusted average capital employed* 29,537$ 4,207 4,489 13,377 2,743 4,722 *Total equity plus debt. Adjusted CROCE (percent) 17% 15% 27% 17% 36% -2% Net Income/ GAAP Average Capital Employed (percent) 16% 13% 25% 13% 38% -8% Millions of Dollars 2014
  • 57. Non-GAAP Reconciliations 57 Midstream Chemicals Refining Marketing & Specialties FCF Yield Numerator Cash From Operations GAAP 559$ 230 2,615 563 Less: Change in Non-Cash Working Cap. (13) - 152 (127) Cash From Operations (excluding WC) 572 230 2,463 690 Less: P66 Equity affiliate cash from ops 205 230 584 - Add: Equity look through cash from ops 396 855 573 - Adjusted FCF (excl WC) 763$ 855 2,452 690 Total Capex GAAP 2,173 - 1,038 439 Less: Growth Capex 2,058 - 287 388 Sustaining Capex 115 - 751 51 Less: P66 Equity affiliate sustaining capex - - - - Add: Equity look through sustaining capex 148 150 134 - Adjusted Sustaining Capex 263$ 150 885 51 Free Cash Flow 500$ 705 1,567 639 Denominator GAAP average capital employed* 3,346$ 3,053 15,052 3,382 Less: P66 Equity affiliate capital employed 512 3,053 2,507 - Add: Equity look through capital employed 3,667 3,515 5,231 - Adjusted average capital employed* 6,501$ 3,515$ 17,776$ 3,382$ *Total equity plus debt. Adjusted FCFY (percent) 8% 20% 9% 19% GAAP CFO/ GAAP Capital Employed (percent) 17% 8% 17% 17% Average 2009-2014
  • 58. Non-GAAP Reconciliations 58 2009 2010 2011 2012 2013 2014 100% CPChem Net Income $ 615 1,388 1,970 2,403 2,743 3,288 Plus: Income taxes 26 42 57 67 71 86 Net interest expense 58 63 18 8 (3) (2) Depreciation and amortization 285 255 258 265 278 296 EBITDA $ 984 1,748 2,303 2,743 3,089 3,668 Adjustments (pre-tax): Proportional share of equity affiliates income taxes 48 76 93 91 115 136 Proportional share of equity affiliates net interest expense 10 8 14 17 24 19 Proportional share of equity affiliates depreciation and amortization 98 112 138 157 214 220 Impairments - - - 91 - 175 Premium on early debt retirement - - - 287 - - Lower-of-cost-or-market inventory adjustments - - - - - 6 Adjusted EBITDA $ 1,140 1,944 2,548 3,386 3,442 4,224 Millions of Dollars 2009 2010 2011 2012 2013 2014 100% DCP Midstream Net Income $ 339 592 863 486 491 288 Plus: Income taxes 18 5 3 2 10 11 Net interest expense 254 253 213 193 249 287 Depreciation and amortization 405 413 449 291 314 348 EBITDA $ 1,016 1,263 1,528 972 1,064 934 Adjustments (pre-tax): Proportional share of equity affiliates income taxes (1) - - (1) (3) (6) Proportional share of equity affiliates net interest expense (18) (20) (25) (32) (40) (67) Proportional share of equity affiliates depreciation and amortization (41) (50) (59) (43) (67) (86) Adjusted EBITDA $ 956 1,193 1,444 896 954 775 Millions of Dollars
  • 59. Non-GAAP Reconciliations 59 Adjusted EBITDA by Segment Reconciliation 1Q 2Q 3Q 4Q 1Q 2Q 3Q 4Q 1Q 2Q Midstream Midstream net income 114$ 92 152 128 194 117 124 107 78 (62) 104 Plus: Provision for income taxes 63 49 87 65 108 63 70 68 38 (37) 57 Depreciation and amortization 19 19 19 31 19 21 24 27 26 27 23 Midstream EBITDA 196$ 160 258 224 321 201 218 202 142 (72) 185 Adjustments (pretax): EBITDA attributable to Phillips 66 noncontrolling interests (5)$ (4) (7) (8) (8) (12) (13) (12) (16) (17) (10) Proportional share of selected equity affiliates income taxes - 2 1 1 2 - 2 (1) 1 (2) 1 Proportional share of selected equity affiliates net interest 22 22 33 33 30 31 29 28 32 33 29 Proportional share of selected equity affiliates depreciation and amortization 31 33 37 38 39 36 37 38 40 41 37 Lower-of-cost-or-market inventory adjustments - - - - - - - 2 - - - Impairments by equity affiliates - - - - - - - - - 194 19 Midstream Adjusted EBITDA* 244$ 213$ 322$ 288$ 384 256 273 257 199 177 261 * Proportional share of selected equity affiliates is net of noncontrolling interests. Chemicals Chemicals net income 282$ 181 262 261 316 324 230 267 203 295 262 Plus: Provision for income taxes 121 51 105 98 126 142 98 129 88 121 108 Chemicals EBITDA 403$ 232 367 359 442 466 328 396 291 416 370 Adjustments (pretax): Proportional share of selected equity affiliates income taxes 19$ 25 25 24 27 28 35 21 22 25 25 Proportional share of selected equity affiliates net interest 2 3 2 3 3 1 2 3 2 1 2 Proportional share of selected equity affiliates depreciation and amortization 58 60 60 68 62 62 64 70 65 65 63 Impairments - - - - - - 88 - - - 9 Lower-of-cost-or-market inventory adjustments - - - - - - - 3 - - - Chemicals Adjusted EBITDA 482$ 320 454 454 534 557 517 493 380 507 470 Millions of Dollars 2013 2014 2015 Average
  • 60. Non-GAAP Reconciliations 60 Adjusted EBITDA by Segment Reconciliation 1Q 2Q 3Q 4Q 1Q 2Q 3Q 4Q 1Q 2Q Refining Refining net income 904$ 455 (30) 418 306 390 558 517 538 604 466 Plus: Provision for income taxes 467 280 22 266 202 257 301 (64) 226 328 229 Depreciation and amortization 177 168 170 170 172 174 178 180 177 183 175 Refining EBITDA 1,548$ 903 162 854 680 821 1,037 633 941 1,115 869 Adjustments (pretax): Proportional share of selected equity affiliates income taxes 2$ 1 - (7) - 1 - 2 - (2) (0) Proportional share of selected equity affiliates net interest (26) (24) (23) (22) (19) - - - - - (11) Proportional share of selected equity affiliates depreciation and amortization 58 57 60 62 61 61 61 62 63 63 61 Asset dispositions - - - - - - - (145) (8) - (15) Impairments - - - - - - - 131 - - 13 Pending claims and settlements - - - - - - - 23 - - 2 Tax law impacts (22) - - - - - - - - - (2) Lower-of-cost-or-market inventory adjustments - - - - - - - 40 - - 4 Refining Adjusted EBITDA 1,560$ 937 199 887 722 883 1,098 746 996 1,176 920 Marketing and Specialties Marketing and Specialties net income 190$ 344 255 105 137 162 368 367 304 314 255 Plus: Provision for income taxes 92 187 107 47 68 86 127 160 102 96 107 Depreciation and amortization 33 25 22 23 21 23 24 27 24 23 25 Marketing and Specialties EBITDA 315$ 556 384 175 226 271 519 554 430 433 386 Adjustments (pretax): Asset dispositions -$ (40) - - - - (109) (16) (110) (132) (41) Pending claims and settlements (25) - - - - - - (44) - - (7) Exit of a business line 54 - - - - - - - - - 5 Tax law impacts (6) - - - - - - - - - (1) Marketing and Specialties Adjusted EBITDA 338$ 516 384 175 226 271 410 494 320 301 344 Millions of Dollars 2013 2014 2015 Average
  • 61. Non-GAAP Reconciliations 61 Adjusted EBITDA by Segment Reconciliation 1Q 2Q 3Q 4Q 1Q 2Q 3Q 4Q 1Q 2Q Corporate Corporate net income (loss) (95)$ (126) (113) (97) (81) (121) (91) (100) (126) (125) (106) Plus: Provision for income taxes (80) (60) (43) (80) (78) (61) (58) (90) (63) (68) (68) Net interest expense 65 66 65 62 63 60 55 68 81 67 65 Depreciation and amortization 13 17 22 19 22 21 23 39 26 40 22 Corporate EBITDA (97)$ (103) (69) (96) (74) (101) (71) (83) (82) (86) (86) Adjustments (pretax): Impairments -$ - - - - - - - - - - Pending claims and settlements -$ - - - - - - - - (5) Corporate Adjusted EBITDA (97)$ (103) (69) (96) (74) (101) (71) (83) (82) (91) (86) Phillips 66 Phillips 66 net income 1,410$ 960 540 833 1,578 872 1,189 1,158 997 1,025 1,056 Less: Income from discontinued operations 15 14 14 18 706 - - - - - 77 Plus: Provision for income taxes 663 507 278 396 426 487 538 203 391 440 433 Net interest expense 65 66 65 62 63 60 55 68 81 67 65 Depreciation and amortization 242 229 233 243 234 239 249 273 253 274 247 Phillips 66 EBITDA 2,365$ 1,748 1,102 1,516 1,595 1,658 2,031 1,702 1,722 1,806 1,725 Adjustments (pretax): EBITDA attributable to Phillips 66 noncontrolling interests (5)$ (4) (7) (8) (8) (12) (13) (12) (16) (17) (10) Proportional share of selected equity affiliates income taxes 21 28 26 18 29 29 37 22 23 21 25 Proportional share of selected equity affiliates net interest (2) 1 12 14 14 32 31 31 34 34 20 Proportional share of selected equity affiliates depreciation and amortization 147 150 157 168 162 159 162 170 168 169 161 Asset dispositions - (40) - - - - (109) (161) (118) (132) (56) Impairments - - - - - - 88 131 - - 22 Exit of a business line 54 - - - - - - - - - 5 Tax law impacts (28) - - - - - - - - - (3) Impairments by equity affiliates - - - - - - - - - 194 19 Pending claims and settlements (25) - - - - - - (21) - (5) (5) Lower-of-cost-or-market inventory adjustments - - - - - - - 45 - - 5 Phillips 66 Adjusted EBITDA 2,527$ 1,883 1,290 1,708 1,792 1,866 2,227 1,907 1,813 2,070 1,908 Millions of Dollars 2013 2014 2015 Average
  • 62. Adjusted EBITDA and Distributable Cash Flow Reconciliation to Net Income 62 $ MM 2Q 2015 1Q 2015 4Q 2014 3Q 2014 2Q 2014 Net Income $ 42.0 $ 35.4 $ 36.3 $ 30.0 $ 30.9 Plus: Depreciation 5.3 5.1 4.5 4.2 3.9 Net interest expense 9.5 5.8 2.1 1.4 1.3 Amortization of deferred rentals 0.1 0.1 0.1 0.1 0.1 Provision for (benefit from) income taxes (0.1) 0.2 0.2 0.1 0.2 EBITDA 56.8 46.6 43.2 35.8 36.4 Distributions in excess of equity earnings 0.2 0.7 - - - Expenses indemnified or prefunded by Phillips 66 - 0.3 0.1 0.7 - Transaction costs associated with acquisitions - 1.4 1.0 0.2 - EBITDA attributable to predecessors - - (0.6) (0.8) 1.2 Adjusted EBITDA 57.0 49.0 43.7 35.9 37.6 Plus: Adjustments related to minimum volume commitments 2.2 1.1 (2.4) 1.4 (0.7) Phillip 66 prefunded maintenance capital expenditures - - 0.1 - 1.1 Less: Net interest 9.5 6.5 1.4 1.7 0.1 Income taxes paid 0.4 - - - 0.2 Maintenance capital expenditures 1.5 1.7 2.8 2.2 3.4 Distributable Cash Flow 47.8 41.9 37.2 33.4 34.3