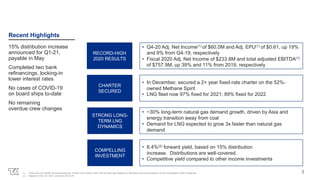
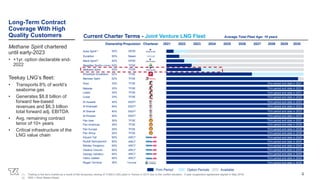
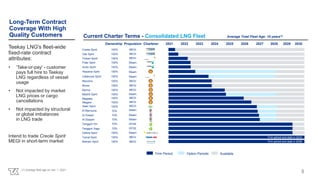
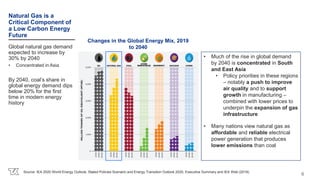
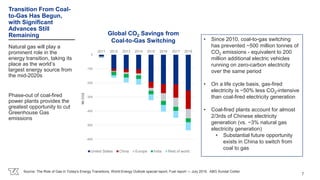
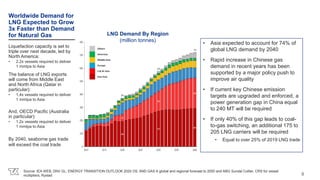
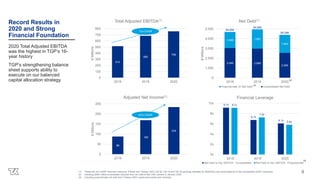
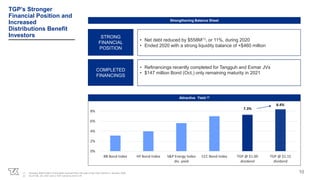
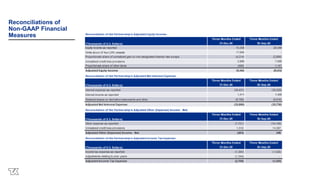
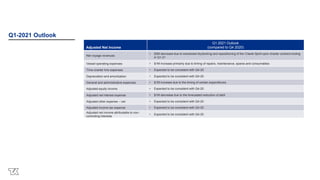
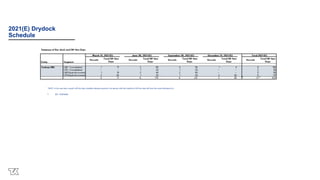
Teekay LNG Partners reported record-high 2020 results, with adjusted net income up 39% and total adjusted EBITDA up 11% from 2019. The company also announced a 15% increase to its common unit distribution commencing in Q1 2021. Teekay LNG's fleet has 97% of available days fixed for 2021 and 89% fixed for 2022, providing stable cash flow. Global demand for LNG is expected to grow substantially over the next decades, driven by Asia and the transition away from coal, supporting strong long-term LNG shipping dynamics.
2. This presentation contains forward-looking statements (as defined in Section 21E of the Securities Exchange Act of 1934, as amended)
which reflect management’s current views with respect to certain future events and performance, including statements, among other things,
regarding: the impact of market volatility and related global events on the Partnership's operations and cash flows; fixed charter coverage for
the Partnership's LNG fleet for the remainder of 2021 and 2022; the expected increase in the Partnership’s common unit distribution
commencing in the first quarter of 2021 (and the sustainability of such increased distribution payments); the continued creditworthiness of the
Partnership’s contractual counterparties; the ability of the Partnership to realize and receive the full benefits from its contractual backlog of
revenue under its long-term charter contracts; the Partnership's operational performance; continued receipt of terminal use payments in
respect of the Bahrain LNG regasification terminal; expected reductions in the Partnership’s financial leverage as it continues to reduce its
debt levels; and the expected cash flows from, and the continued performance of, the Partnership's and its joint ventures' charter contracts.
The following factors are among those that could cause actual results to differ materially from the forward-looking statements, which involve
risks and uncertainties, and that should be considered in evaluating any such statement: changes in production of LNG or LPG, either
generally or in particular regions; changes in trading patterns or timing of start-up of new LNG liquefaction and regasification projects
significantly affecting overall vessel tonnage requirements; changes in applicable industry laws and regulations and the timing of
implementation of new laws and regulations; the potential for early termination of long-term contracts of existing vessels in the Partnership's
fleet; higher than expected costs and expenses, including as a result of off-hire days or dry-docking requirements (both scheduled and
unscheduled); delays in the Partnership’s ability to successfully and timely complete dry dockings; general market conditions and trends,
including spot, multi-month and multi-year charter rates; inability of customers of the Partnership or any of its joint ventures to make future
payments under contracts; potential further delays to the formal commencement of commercial operations of the Bahrain Regasification
Terminal; the inability of the Partnership to renew or replace long-term contracts on existing vessels; potential lack of cash flow to reduce
balance sheet leverage or of excess capital available to allocate towards returning capital to unitholders; potential lack of cash flow to
continue paying distributions on the Partnership’s common units and other securities; and other factors discussed in Teekay LNG Partners’
filings from time to time with the SEC, including its Report on Form 20-F for the fiscal year ended December 31, 2019. The Partnership
expressly disclaims any obligation to release publicly any updates or revisions to any forward-looking statements contained herein to reflect
any change in the Partnership’s expectations with respect thereto or any change in events, conditions or circumstances on which any such
statement is based.
Forward Looking
Statement
2
3. Recent Highlights
15% distribution increase
announced for Q1-21,
payable in May
Completed two bank
refinancings, locking-in
lower interest rates
No cases of COVID-19
on board ships to-date
No remaining
overdue crew changes
3
(1) These are non-GAAP financial measures. Please see Teekay LNG’s Q4-20 earnings release for definitions and reconciliations to the comparable GAAP measures.
(2) Based on Feb. 24, 2021 unit price of $13.75
RECORD-HIGH
2020 RESULTS
CHARTER
SECURED
STRONG LONG-
TERM LNG
DYNAMICS
COMPELLING
INVESTMENT
• Q4-20 Adj. Net Income(1) of $60.0M and Adj. EPU(1) of $0.61, up 19%
and 9% from Q4-19, respectively
• Fiscal 2020 Adj. Net Income of $233.8M and total adjusted EBITDA(1)
of $757.9M, up 39% and 11% from 2019, respectively
• In December, secured a 2+ year fixed-rate charter on the 52%-
owned Methane Spirit
• LNG fleet now 97% fixed for 2021; 89% fixed for 2022
• 8.4%(2) forward yield, based on 15% distribution
increase. Distributions are well-covered.
• Competitive yield compared to other income investments
• ~30% long-term natural gas demand growth, driven by Asia and
energy transition away from coal
• Demand for LNG expected to grow 3x faster than natural gas
demand
4. Yakov Gakkel 50% Firm period end date in 2045
50%
Georgiy Ushakov
Firm period end date in 2039
Current Charter Terms - Joint Venture LNG Fleet
Long-Term Contract
Coverage With High
Quality Customers
Methane Spirit chartered
until early-2023
• +1yr. option declarable end-
2022
Teekay LNG’s fleet:
• Transports 8% of world’s
seaborne gas
• Generates $8.8 billion of
forward fee-based
revenues and $6.3 billion
total forward adj. EBITDA
• Avg. remaining contract
tenor of 10+ years
• Critical infrastructure of the
LNG value chain
Pan Africa 20%
Pan Europe 20%
Pan Americas 30%
Pan Asia 30%
Firm period end date in 2045
Firm period end date in 2038
30%
Regas Terminal
Arwa Spirit(1) 52%
2021 2022 2023 2024 2025 2026 2027 2028
Charterer
Ownership 2029
Methane Spirit 52%
Marib Spirit(1) 52%
Excalibur 50%
Magellan Spirit 52%
(in-charter)
Woodside Donaldson 52%
Meridian Spirit 52%
Soyo 33% Firm period end date in 2031
Malanje 33% Firm period end date in 2031
Lobito 33% Firm period end date in 2031
Cubal 33% Firm period end date in 2032
Al Huwaila 40% Firm period end date in 2033
Al Kharsaah 40% Firm period end date in 2033
Al Shamal 40%
Al Khuwair 40%
Firm period end date in 2033
Firm period end date in 2037
Firm period end date in 2038
Firm period end date in 2039
Vladimir Voronin 50%
Rudolf Samoylovich 50%
Eduard Toll 50% Firm period end date in 2045
Firm period end date in 2045
Nikolay Yevgenov 50% Firm period end date in 2045
Average Total Fleet Age: 10 years
(1) Trading in the term market as a result of the temporary closing of YLNG’s LNG plant in Yemen in 2015 due to the conflict situation. 3-year suspension agreement signed in May 2019.
(2) SSD = Slow Steam Diesel
4
Firm period end date in 2045
Propulsion
ARC7
ARC7
TFDE
TFDE
TFDE
TFDE
DFDE
TFDE
DFDE
Steam
TFDE
TFDE
TFDE
TFDE
TFDE
TFDE
TFDE
SSD(2)
SSD(2)
SSD(2)
SSD(2)
ARC7
ARC7
ARC7
ARC7
Terminal
Option Periods
Firm Period Available
2030
5. Al Marrouna 70%
Long-Term Contract
Coverage With High
Quality Customers
Teekay LNG's fleet-wide
fixed-rate contract
attributes:
• ‘Take-or-pay' - customer
pays full hire to Teekay
LNG regardless of vessel
usage
• Not impacted by market
LNG prices or cargo
cancellations
• Not impacted by structural
or global imbalances
in LNG trade
Intend to trade Creole Spirit
MEGI in short-term market
2021 2022 2023 2024 2025 2026 2027 2028
Charterer
Ownership
Current Charter Terms - Consolidated LNG Fleet
Polar Spirit 100%
Hispania Spirit 100%
Option Periods
Firm Period Available
Madrid Spirit 100%
Al Areesh 70%
Al Daayen 70%
Catalunya Spirit 100%
Torben Spirit 100%
Tangguh Hiri 70%
Galicia Spirit 100%
Tangguh Sago 70%
Arctic Spirit 100%
Creole Spirit 100%
Oak Spirit 100%
2029
Macoma 100%
100%
Murex
Magdala 100%
Myrina 100%
Megara 100%
Bahrain Spirit 100% Firm period end date in 2038
Sean Spirit 100%
Yamal Spirit 100% Firm period end date in 2033
Average Total Fleet Age: 10 years(1)
(1) Average fleet age on Jan. 1, 2021
5
Propulsion
MEGI
Steam
MEGI
Steam
Steam
Steam
MEGI
Steam
DFDE
DFDE
Steam
MEGI
Steam
MEGI
MEGI
MEGI
MEGI
MEGI
Steam
Steam
MEGI
MEGI
2030
6. Global natural gas demand
expected to increase by
30% by 2040
• Concentrated in Asia
By 2040, coal’s share in
global energy demand dips
below 20% for the first
time in modern energy
history
• Much of the rise in global demand
by 2040 is concentrated in South
and East Asia
• Policy priorities in these regions
– notably a push to improve
air quality and to support
growth in manufacturing –
combined with lower prices to
underpin the expansion of gas
infrastructure
• Many nations view natural gas as
affordable and reliable electrical
power generation that produces
lower emissions than coal
Source: IEA 2020 World Energy Outlook, Stated Policies Scenario and Energy Transition Outlook 2020, Executive Summary and IEA Web (2019)
Natural Gas is a
Critical Component of
a Low Carbon Energy
Future
Changes in the Global Energy Mix, 2019
to 2040
6
7. Natural gas will play a
prominent role in the
energy transition, taking its
place as the world’s
largest energy source from
the mid-2020s
Phase-out of coal-fired
power plants provides the
greatest opportunity to cut
Greenhouse Gas
emissions
• Since 2010, coal-to-gas switching
has prevented ~500 million tonnes of
CO2 emissions - equivalent to 200
million additional electric vehicles
running on zero-carbon electricity
over the same period
• On a life cycle basis, gas-fired
electricity is ~50% less CO2-intensive
than coal-fired electricity generation
• Coal-fired plants account for almost
2/3rds of Chinese electricity
generation (vs. ~3% natural gas
electricity generation)
• Substantial future opportunity
exists in China to switch from
coal to gas
Source: The Role of Gas in Today's Energy Transitions, World Energy Outlook special report, Fuel report — July 2019. ABG Sundal Collier
Transition From Coal-
to-Gas Has Begun,
with Significant
Advances Still
Remaining
-600
-500
-400
-300
-200
-100
0
2011 2012 2013 2014 2015 2016 2017 2018
Mt
CO2
United States China Europe India Rest of world
Global CO2 Savings from
Coal-to-Gas Switching
7
8. Liquefaction capacity is set to
triple over next decade, led by
North America:
• 2.2x vessels required to deliver
1 mmtpa to Asia
The balance of LNG exports
will come from Middle East
and North Africa (Qatar in
particular):
• 1.4x vessels required to deliver
1 mmtpa to Asia
And, OECD Pacific (Australia
in particular):
• 1.2x vessels required to deliver
1 mmtpa to Asia
By 2040, seaborne gas trade
will exceed the coal trade
• Asia expected to account for 74% of
global LNG demand by 2040
• Rapid increase in Chinese gas
demand in recent years has been
supported by a major policy push to
improve air quality
• If current key Chinese emission
targets are upgraded and enforced, a
power generation gap in China equal
to 240 MT will be required
• If only 40% of this gap leads to coal-
to-gas switching, an additional 175 to
205 LNG carriers will be required
• Equal to over 25% of 2019 LNG trade
Source: IEA WEB, DNV GL: ENERGY TRANSITION OUTLOOK 2020 OIL AND GAS A global and regional forecast to 2050 and ABG Sundal Collier, CRS for vessel
multipliers, Rystad
Worldwide Demand for
LNG Expected to Grow
3x Faster than Demand
for Natural Gas
Others
Americas
Middle East
Europe
S & SE Asia
East Asia
8
LNG Demand By Region
(million tonnes)
9. 9
515
685
758
0
100
200
300
400
500
600
700
800
2018 2019 2020
$
Millions
Total Adjusted EBITDA(1)
Record Results in
2020 and Strong
Financial Foundation
88
169
234
0
50
100
150
200
250
2018 2019 2020
$
Millions
Adjusted Net Income(1)
3,046 2,989
2,555
1,648 1,967
1,843
0
1,000
2,000
3,000
4,000
5,000
2018 2019 2020
$
Millions
Net Debt(1)
Proportionate JV Net Debt Consolidated Net Debt
(1) These are non-GAAP financial measures. Please see Teekay LNG’s Q4-20, Q4-19 and Q4-18 earnings releases for definitions and reconciliations to the comparable GAAP measures.
(2) Including $260 million of proceeds received from the sale of two LNG carriers in January 2020.
(3) Including proportionate net debt from Teekay LNG’s equity-accounted joint ventures.
(3)
$4,694
$4,956
$4,398
9.1x
6.7x
6.1x
9.1x
7.2x
5.8x
0x
2x
4x
6x
8x
10x
2018 2019 2020
Financial Leverage
Net Debt to Adj. EBITDA - Consolidated Net Debt to Adj. EBITDA - Proportionate
(3)
(2)
21% CAGR
63% CAGR
2020 Total Adjusted EBITDA
was the highest in TGP’s 16-
year history
TGP’s strengthening balance
sheet supports ability to
execute on our balanced
capital allocation strategy
10. TGP’s Stronger
Financial Position and
Increased
Distributions Benefit
Investors
Attractive Yield (2)
Strengthening Balance Sheet
10
• Net debt reduced by $558M(1), or 11%, during 2020
• Ended 2020 with a strong liquidity balance of +$460 million
STRONG
FINANCIAL
POSITION
• Refinancings recently completed for Tangguh and Exmar JVs
• $147 million Bond (Oct.) only remaining maturity in 2021
COMPLETED
FINANCINGS
0%
2%
4%
6%
8%
BB Bond Index HY Bond Index S&P Energy Index
div. yield
CCC Bond Index TGP @ $1.00
dividend
TGP @ $1.15
dividend
7.3%
8.4%
(1) Including $260 million of proceeds received from the sale of two LNG carriers in January 2020.
(2) As of Feb. 24, 2021 and a TGP unit price of $13.75
12. Adjusted Net Income
Q4-20 vs. Q3-20
1) Refer to slide labelled Reconciliations of Non-GAAP Financial Measures for a reconciliation of Adjusted Equity Income, Adjusted Net Interest Expense, Adjusted Other (Expense) Income – Net, and Adjusted
Income Tax Expense.
(Thousands of U.S. Dollars except units
outstanding or unless otherwise indicated)
Q4-2020 Q3-2020
Comments
Net voyage revenues 148,278 144,985 Increased due to fewer scheduled dry dockings during Q4-20 compared to Q3-20
Vessel operating expenses (31,243) (30,642)
Time-charter hire expenses (6,294) (5,980)
Depreciation and amortization (32,883) (32,601)
General and administrative expenses (6,689) (6,165)
Income from vessel operations 71,169 69,597
Adjusted equity income(1) 30,465 29,932
Adjusted net interest expense(1) (35,800) (35,738)
Adjusted other (expense) income – net(1) (203) 248
Adjusted income tax expense(1) (2,708) (1,420)
Adjusted net income 62,923 62,619
Less: Adjusted net income attributable to non-controlling
interests (2,945) (3,686)
Adjusted net income attributable to the partners and
preferred unitholders 59,978 58,933
Weighted-average number of common units outstanding 86,951,234 86,951,234
Limited partner’s interest in adjusted net income per
common unit 0.61 0.59
14. Q1-2021 Outlook
Adjusted Net Income
Q1 2021 Outlook
(compared to Q4 2020)
Net voyage revenues
• $3M decrease due to scheduled drydocking and repositioning of the Creole Spirit upon charter contract ending
in Q1-21
Vessel operating expenses • $1M increase primarily due to timing of repairs, maintenance, spares and consumables
Time-charter hire expenses • Expected to be consistent with Q4-20
Depreciation and amortization • Expected to be consistent with Q4-20
General and administrative expenses • $1M increase due to the timing of certain expenditures
Adjusted equity income • Expected to be consistent with Q4-20
Adjusted net interest expense • $1M decrease due to the forecasted reduction of debt
Adjusted other expense – net • Expected to be consistent with Q4-20
Adjusted income tax expense • Expected to be consistent with Q4-20
Adjusted net income attributable to non-
controlling interests
• Expected to be consistent with Q4-20
15. 2021(E) Drydock
Schedule
*NOTE: In the case that a vessel's off-hire days straddles between quarters, the quarter with the majority of off-hire days will have the vessel allocated to it.
• (E) – Estimate