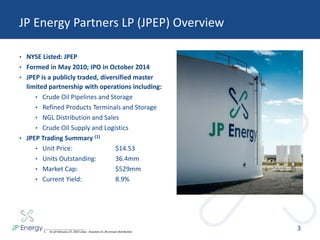
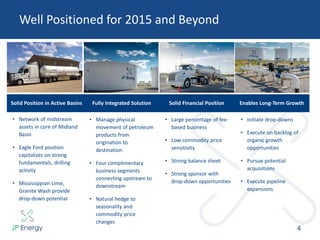
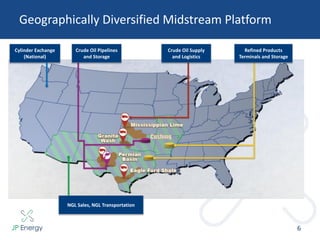
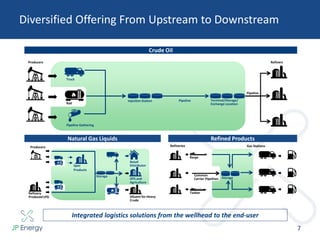
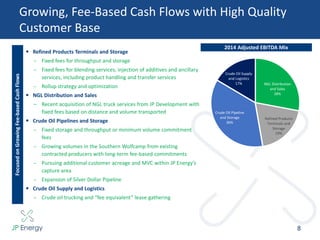
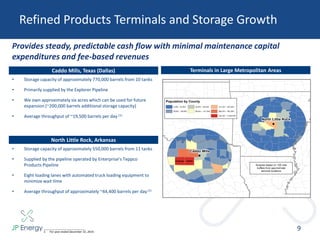
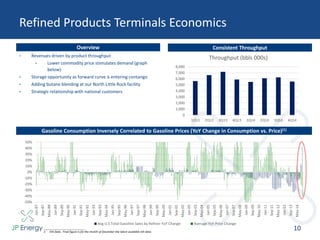
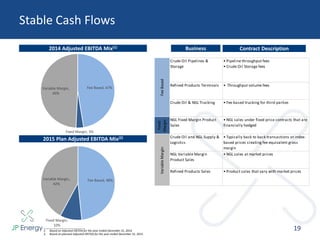
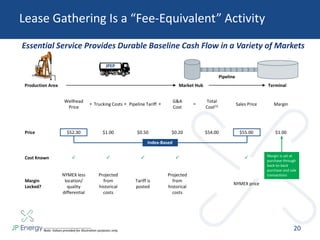
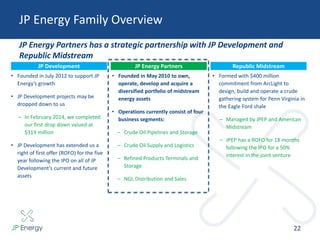
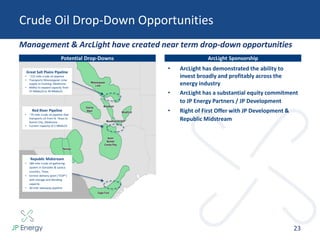
Investor Presentation
March 2015
Disclaimers
2
This presentation contains forward-looking statements. These statements discuss future expectations, contain projections of results of operations or of financial condition or
state other forward-looking information. These statements are based upon various assumptions, many of which are based, in turn, upon further assumptions, including
examination of historical operating trends made by the management of JP Energy Partners LP (the “Partnership” or “JPE”). Although the Partnership believes that these
assumptions were reasonable when made, because assumptions are inherently subject to significant uncertainties and contingencies, which are difficult or impossible to
predict and are beyond its control, the Partnership cannot give assurance that it will achieve or accomplish these expectations, beliefs or intentions. These forward-looking
statements involve risks and uncertainties. When considering these forward- looking statements, you should keep in mind the risk factors and other cautionary statements
in the filings made by the Partnership with the Securities and Exchange Commission (the “SEC”), copies of which are available to the public. The risk factors and other factors
noted in the Partnership’s filings with the SEC could cause the Partnership’s actual results to differ materially from those contained in any forward-looking statement. The
Partnership expressly disclaims any intention or obligation to revise or publicly update any forward-looking statements, whether as a result of new information, future
events or otherwise.
Forward Looking Statements
Non-GAAP Measures
This document includes certain non-GAAP financial measures as defined under SEC Regulation G. A reconciliation of those measures to most directly comparable GAAP
measures is provided in the appendix to this presentation.
Adjusted EBITDA is defined as net income (loss) plus (minus) interest expense (income), income tax expense (benefit), depreciation and amortization expense, asset
impairments, (gains) losses on asset sales, certain non-cash charges such as non-cash compensation and non-cash vacation expense, non-cash (gains) losses on commodity
derivative contracts (total (gain) loss on commodity derivatives less net cash flow associated with commodity derivatives settled during the period) and selected (gains)
charges and transaction costs that are unusual or non-recurring and other selected items that impact comparability.
JP Energy Partners LP (JPEP) Overview
3
• NYSE Listed: JPEP
• Formed in May 2010; IPO in October 2014
• JPEP is a publicly traded, diversified master
limited partnership with operations including:
• Crude Oil Pipelines and Storage
• Refined Products Terminals and Storage
• NGL Distribution and Sales
• Crude Oil Supply and Logistics
• JPEP Trading Summary (1)
• Unit Price: $14.53
• Units Outstanding: 36.4mm
• Market Cap: $529mm
• Current Yield: 8.9%
___________________________
1. As of February 27, 2015 close. Assumes $1.30 annual distribution.
Well Positioned for 2015 and Beyond
4
Solid Position in Active Basins Fully Integrated Solution Solid Financial Position
• Network of midstream
assets in core of Midland
Basin
• Eagle Ford position
capitalizes on strong
fundamentals, drilling
activity
• Mississippian Lime,
Granite Wash provide
drop-down potential
• Manage physical
movement of petroleum
products from
origination to
destination
• Four complimentary
business segments
connecting upstream to
downstream
• Natural hedge to
seasonality and
commodity price
changes
• Large percentage of fee-
based business
• Low commodity price
sensitivity
• Strong balance sheet
• Strong sponsor with
drop-down opportunities
Enables Long-Term Growth
• Initiate drop-downs
• Execute on backlog of
organic growth
opportunities
• Pursue potential
acquisitions
• Execute pipeline
expansions
Business Diversification
Cylinder Exchange
(National)
Geographically Diversified Midstream Platform
6
Crude Oil Pipelines
and Storage
Crude Oil Supply
and Logistics
Refined Products
Terminals and Storage
NGL Sales, NGL Transportation
Diversified Offering From Upstream to Downstream
Integrated logistics solutions from the wellhead to the end-user
Crude Oil
Producers Refiners
Truck
Pipeline Gathering
Injection Station Pipeline Terminal/Storage/
Exchange Location
Pipeline
Refined ProductsNatural Gas Liquids
Refineries
OFS and
Agriculture
Gas Stations
Barge
Common
Carrier Pipelines
Tanker
Storage
Rail
Diluent for Heavy
Crude
Producers
Refinery
Produced LPG
Spec
Products
Retail
Distributor
Storage
7
8
Growing, Fee-Based Cash Flows with High Quality
Customer Base
 Refined Products Terminals and Storage
– Fixed fees for throughput and storage
– Fixed fees for blending services, injection of additives and ancillary
services, including product handling and transfer services
– Rollup strategy and optimization
 NGL Distribution and Sales
– Recent acquisition of NGL truck services from JP Development with
fixed fees based on distance and volume transported
 Crude Oil Pipelines and Storage
– Fixed storage and throughput or minimum volume commitment
fees
– Growing volumes in the Southern Wolfcamp from existing
contracted producers with long-term fee-based commitments
– Pursuing additional customer acreage and MVC within JP Energy’s
capture area
– Expansion of Silver Dollar Pipeline
 Crude Oil Supply and Logistics
– Crude oil trucking and “fee equivalent” lease gathering
FocusedonGrowingFee-basedCashFlows
NGL
Distribution
and Sales
Refined
Products
Terminals
and Storage
Crude Oil
Pipelines &
Storage
2014 Adjusted EBITDA Mix
NGL Distribution
and Sales
28%
Refined Products
Terminals and
Storage
19%
Crude Oil Pipeline
and Storage
36%
Crude Oil Supply
and Logistics
17%
Refined Products Terminals and Storage Growth
• Storage capacity of approximately 770,000 barrels from 10 tanks
• Primarily supplied by the Explorer Pipeline
• We own approximately six acres which can be used for future
expansion (~200,000 barrels additional storage capacity)
• Average throughput of ~19,500 barrels per day (1)
Caddo Mills, Texas (Dallas) Terminals in Large Metropolitan Areas
9
• Storage capacity of approximately 550,000 barrels from 11 tanks
• Supplied by the pipeline operated by Enterprise’s Teppco
Products Pipeline
• Eight loading lanes with automated truck loading equipment to
minimize wait time
• Average throughput of approximately ~44,400 barrels per day (1)
North Little Rock, Arkansas
Provides steady, predictable cash flow with minimal maintenance capital
expenditures and fee-based revenues
___________________________
1. For year ended December 31, 2014.
-50%
-40%
-30%
-20%
-10%
0%
10%
20%
30%
40%
50%
Jan-87
Sep-87
May-88
Jan-89
Sep-89
May-90
Jan-91
Sep-91
May-92
Jan-93
Sep-93
May-94
Jan-95
Sep-95
May-96
Jan-97
Sep-97
May-98
Jan-99
Sep-99
May-00
Jan-01
Sep-01
May-02
Jan-03
Sep-03
May-04
Jan-05
Sep-05
May-06
Jan-07
Sep-07
May-08
Jan-09
Sep-09
May-10
Jan-11
Sep-11
May-12
Jan-13
Sep-13
May-14
Avg U.S Total Gasoline Sales by Refiner YoY Change Average YoY Price Change
• Revenues driven by product throughput
• Lower commodity price stimulates demand (graph
below)
• Storage opportunity as forward curve is entering contango
• Adding butane blending at our North Little Rock facility
• Strategic relationship with national customers
Refined Products Terminals Economics
10
Overview
Gasoline Consumption Inversely Correlated to Gasoline Prices (YoY Change in Consumption vs. Price)(1)
Consistent Throughput
___________________________
1. EIA Data. Final figure is for the month of December the latest available EIA data.
0
1,000
2,000
3,000
4,000
5,000
6,000
7,000
8,000
1Q13 2Q13 3Q13 4Q13 1Q14 2Q14 3Q14 4Q14
Throughput (bbls 000s)
0
10,000
20,000
30,000
40,000
50,000
60,000
Jan-13
Mar-13
May-13
Jul-13
Sep-13
Nov-13
Jan-14
Mar-14
May-14
Jul-14
Sep-14
Nov-14
Jan-15
Crude Oil Storage
11
JP Energy Partners’ crude oil storage facility is located in Cushing,
Oklahoma, a key hub connecting production to the Gulf Coast
Asset Highlights
• Focused on operational storage with largest tanks in Cushing for
large crude movements or storage options (~3mm barrels aggregate
shell capacity)
• Inbound connections with multiple pipelines and two-way
interconnections with all the major storage facilities in Cushing
• Annuity-like, stable, fee-based cash flow priced off capacity under
long term contracts (~3yrs remaining)
• Expect increased demand from recent changes in crude oil spot and
futures prices
• The WTI forward curve has shifted from backwardation to
contango, making it more economical to store
Recent Market Impact- Entering Contango(2)
Consistent, Fee Based Adjusted Crude Oil Storage EBITDA(1)
EIA Cushing Storage Volumes
___________________________
1. 4Q14 EBITDA excluding unusual items.
2. NYMEX Crude Oil WTI (CL) curve as of February 27, 2015.
1Q13 2Q13 3Q13 4Q13 1Q14 2Q14 3Q14 4Q14
Unusual
Items
$45
$50
$55
$60
$65
$70
$75
$80
$85
$90
$95
Mar-15
Jun-15
Sep-15
Dec-15
Mar-16
Jun-16
Sep-16
Dec-16
Mar-17
Jun-17
Sep-17
Dec-17
Mar-18
Jun-18
Sep-18
Dec-18
Crude Oil WTI ($/bbl) Futures Curve by Expiry Date
Current One Year Ago
NGL Distribution and Sales
12
Limited Gross Margin Seasonality (2)Overview(1)
• NGL Distribution and Sales / NGL Transportation
• Target growing demand for power generation and oilfield
service applications providing stable cash flows throughout
the year
• Fixed fee business primarily in the Eagle Ford and Permian
• Cylinder Exchange
• 3rd largest propane cylinder exchange business in the U.S.
• Established footprint in 48 states with a network of
~19,500 customer locations
• National footprint gives us capability to compete for large
volume national accounts and provide us with economies
of scale and significant cost savings
• Maintain flexible market pricing to allow for margin optimization
• Improve logistics and create synergies
• Leverage scale by using freight and supply point optimization
• Execute on organic growth by entering new major markets, and
expanding customer and other strategic relationships
• Evaluation of new services / geographies
• Industrial services
• Continue to expand in the Western U.S.
Growth Opportunities NGL Operations
Cylinder Exchange Footprint
Recent
Expansion
Pinnacle Location
PPE Central Ops
PPE Depots
PPE Production___________________________
1. Cylinder Exchange location count of ~19,500 is as of January 31, 2015.
2. Adjusted gross margin and volumes are for Pinnacle Propane and Pinnacle Propane Express and exclude JP Liquids Transportation.
1Q13 2Q13 3Q13 4Q13 1Q14 2Q14 3Q14 4Q14
Propane Volume Adjusted Gross Margin
NGL Distribution and Sales Economics
13
Overview
• Two primary businesses reduce seasonality
• Propane Sales and Distribution business is winter
weighted, although decreasing seasonality due to growth
in industrial and oilfield services
• Propane Cylinder Exchange business is summer weighted
• Margins tend to expand as commodity prices fall
• Longer dated sales contracts
Limited Seasonality (1)
___________________________
1. Based on adjusted gross margin for the year ended December 31, 2014. Winter includes three months ending March 31, 2014 and December 31, 2014 , and summer includes the
three months ending June 30, 2014 and September 30, 2014.
2. NYMEX Propane Non-LDH Mt. Belvieu (OPIS) front month and NYMEX WTI Front Month through February 27, 2015.
Mt. Belvieu ($/gal) Correlated With NYMEX WTI ($/bbl)(2)
Winter, 54%Summer, 46%
$0
$20
$40
$60
$80
$100
$120
$0.00
$0.20
$0.40
$0.60
$0.80
$1.00
$1.20
$1.40
$1.60
$1.80
9/26/13
10/26/13
11/26/13
12/26/13
1/26/14
2/26/14
3/26/14
4/26/14
5/26/14
6/26/14
7/26/14
8/26/14
9/26/14
10/26/14
11/26/14
12/26/14
1/26/15
2/26/15
NYMEX Propane Mt. Belvieu (OPIS) WTI NYMEX
Silver Dollar Anchored by Active Producers and
Provides Access to Multiple End-Markets
JP Energy Partners’ crude oil pipeline system is base loaded by two
customers with over 300,000 contiguous acres in the Permian Basin
14
~5 years
remaining on
minimum volume
commitment
~9 years remaining
with 110,000 acre
dedication
Major Customer A
Major Customer B
10 years with
53,000 acreage
dedication
Major Customer C
10,000
12,000
14,000
16,000
18,000
20,000
22,000
24,000
26,000
4Q13 1Q14 2Q14 3Q14 4Q14
Pipeline Volumes (Barrels Per Day)
Silver Dollar Pipeline Continuing To Grow
15
Overview
• Volume growth from the core of the Permian continues in
current oil price environment
• Connection to Cline Shale immediately expanded system capacity
• Customers remain committed to developing Permian acreage
• Most stated break-evens look to be in the high $40s
• Area producers expect year over year growth despite
declining rig counts
• Substantial optionality with three connections
• Oxy Cline Shale
• Plains Owens
• Signed connection agreement for third takeaway option
• Trucking stations create synergies with Crude Oil Supply and
Logistics segment
• Increases capture area of the system
Volume Growth Accelerating
Cline Shale
Connection
Silver Dollar Pipeline Reagan County Expansion
16
Project Overview
• Recently announced the expansion of the Silver Dollar pipeline
north into Reagan and Glasscock Counties
• Expansion is base loaded by a 53,000 acre 10yr dedication
• Approximately 55 miles of pipeline with expected completion date
in the second half of 2015
• Estimated capital cost of approximately $36mm
Planned Expansion
Planned Expansion
Strategic and Financial Rationale
• Strategic Rationale
• Expands the Silver Dollar Pipeline capture area into the
core of the Midland basin
• New customer opportunities
• Deploys breadth of midstream capabilities for producer
(pipeline, trucking, marketing)
• Financial Rationale
• Accretive project assuming only base load
• Additional upside from new customers
• Initially funded using revolving credit facility
17
Gathering Systems In the Lowest Cost Crude Oil Basins
Core Assets in the Permian (Silver Dollar) and Eagle Ford (Republic Midstream ROFO)(1)(2)
___________________________
1. Rounded Breakeven Estimates based on UBS research dated October 14, 2014.
2. JP Energy Partners has a ROFO for a 50% interest in Republic Midstream.
JP Energy
Focus Areas
Stable Cash Flows
Fee Based, 48%
Fixed Margin,
10%
Variable Margin,
42%
Fee Based, 47%
Fixed Margin, 3%
Variable Margin,
49%
Stable Cash Flows
Business
19
2014 Adjusted EBITDA Mix(1)
___________________________
1. Based on Adjusted EBITDA for the year ended December 31, 2014.
2. Based on planned Adjusted EBITDA for the year ended December 31, 2015.
Contract Description
Crude Oil Pipelines &
Storage
• Pipeline throughput fees
• Crude Oil Storage fees
Refined Products Terminals • Throughput volume fees
Crude Oil & NGL Trucking • Fee based trucking for third parties
Fixed
Margin
NGL Fixed Margin Product
Sales
• NGL sales under fixed price contracts that are
financially hedged
Crude Oil and NGL Supply &
Logistics
• Typically back to back transactions at index-
based prices creating fee equivalent gross
margin
NGL Variable Margin
Product Sales
• NGL sales at market prices
Refined Products Sales • Product sales that vary with market prices
FeeBasedVariableMargin
2015 Plan Adjusted EBITDA Mix(2)
Lease Gathering Is a “Fee-Equivalent” Activity
Essential Service Provides Durable Baseline Cash Flow in a Variety of Markets
Wellhead
Price
Trucking Costs Pipeline Tariff
G&A
Cost
Total
Cost(1) Sales Price Margin
Price $52.30 $1.00 $0.50 $0.20 $54.00 $55.00 $1.00
Cost Known     
Margin
Locked?
NYMEX less
location/
quality
differential
Projected
from
historical
costs
Tariff is
posted
Projected
from
historical
costs
NYMEX price
Production Area
JPEP
Market Hub
Pipeline
Terminal
Index-Based
Margin is set at
purchase through
back-to-back
purchase and sale
transactions
+ + =+
20___________________________
Note: Values provided for illustration purposes only.
Strong Equity Sponsorship
JP Energy Family Overview
22
JP Energy Partners has a strategic partnership with JP Development and
Republic Midstream
JP Development
• Founded in July 2012 to support JP
Energy’s growth
• JP Development projects may be
dropped down to us
– In February 2014, we completed
our first drop down valued at
$319 million
• JP Development has extended us a
right of first offer (ROFO) for the five
year following the IPO on all of JP
Development’s current and future
assets
JP Energy Partners
• Founded in May 2010 to own,
operate, develop and acquire a
diversified portfolio of midstream
energy assets
• Operations currently consist of four
business segments:
– Crude Oil Pipelines and Storage
– Crude Oil Supply and Logistics
– Refined Products Terminals and
Storage
– NGL Distribution and Sales
Republic Midstream
• Formed with $400 million
commitment from ArcLight to
design, build and operate a crude
gathering system for Penn Virginia in
the Eagle Ford shale
– Managed by JPEP and American
Midstream
– JPEP has a ROFO for 18 months
following the IPO for a 50%
interest in the joint venture
Permian
North
Barnett
Combo Play
Eagle Ford
Mississippian
Lime
Granite
Wash Woodford
Woodford
Woodford-SCOOP
Management & ArcLight have created near term drop-down opportunities
Crude Oil Drop-Down Opportunities
• ArcLight has demonstrated the ability to
invest broadly and profitably across the
energy industry
• ArcLight has a substantial equity commitment
to JP Energy Partners / JP Development
• Right of First Offer with JP Development &
Republic Midstream
ArcLight Sponsorship
23
Great Salt Plains Pipeline
• ~115 mile crude oil pipeline
• Transports Mississippian Lime
supply to Cushing, Oklahoma
• Ability to expand capacity from
27 Mbbls/d to 40 Mbbls/d
Red River Pipeline
• ~75 mile crude oil pipeline that
transports oil from N. Texas to
Garvin City, Oklahoma
• Current capacity of 5 Mbbls/d
Republic Midstream
• 180-mile crude oil gathering
system in Gonzales & Lavaca
counties, Texas
• Central delivery point (“CDP”)
with storage and blending
capacity
• 30-mile takeaway pipeline
Potential Drop-Downs
Financial Strategy
Available Liquidity ($mm)(1)
Conservative Balance Sheet
25
Balance Sheet Management
___________________________
1. As of February 27, 2015. Availability based on $275mm of commitments.
• Two major focuses for conservative balance sheet management
• Maintain considerable excess liquidity
• $160mm as of February 27th, 2015
• Target leverage lower than peer group
• <3.5x EBITDA target
• IPO proceeds were used to delever the balance sheet
Cost Control
• Focused on disciplined growth capital expenditures
• Spending on only the highest return and most
strategically significant projects
• Continuing to review the cost structure
• Targeting best practices
• Revisiting current processes
• Reviewing G&A expenses following acquisition activity
Credit Facility
Borrowings, $107
Outstanding
Letters of Credit,
$19
Unrestricted
Cash, $11
Unused Credit
Facility Capacity,
$149
Financial Strategy
26
 Long term contracts for our crude oil pipelines
 Refined products and NGL segments offer diversification in mature markets but with
considerable growth opportunities
 Near-term organic growth projects already being pursued in existing businesses
 Strategic drop-downs from JP Development and Republic Midstream could further
bolster growth
 Remain open to acquisition opportunities that are strategic to the platform
 Revolver has ~$149 million in availability
 Target 3.5x leverage over the long-term
 Established risk management policies and procedures to monitor and manage the
market risks associated with commodity prices, counterparty credit and interest rates
 Commodity price exposure is minimized through fixed-fee contracts or margin-based
arrangements
Maintain Stable
Cash Flows
Comprehensive
Risk Management
Commitment to
Financial
Flexibility
Deliver Consistent
Distribution
Growth
Summary
27
 Four unique but complementary business segments connecting upstream supply to
downstream demand
 Opportunity to seek further value chain integration
 Diverse business mix provides natural hedge to seasonality and commodity price swings
 JP Energy Partners and JP Energy Development Company have strategically developed
and acquired assets in the most profitable basins in North America
 Truck locations managed dynamically to optimize returns of Crude Oil Supply and
Logistics and Crude Oil Pipelines segment
 Limited direct commodity price exposure
 58% fee or fixed margin planned 2015 Adjusted EBITDA
 Owns over 50% of the LP units and approximately 71% of the GP
 Experienced sponsor that is active in the market
 Actively seeking to expand drop-down inventory
 Focused on financially responsible and conservative growth and cost containment
 Revolver has ~$149 million in availability
 Target 3.5x leverage over the long-term
Conservative
Balance Sheet
Stable Cash Flows
Diversified
Business
Strategically
Located Crude
Assets
Strong Equity
Sponsorship
Appendix
Non-GAAP Reconciliation – Adjusted EBITDA
29
2014 2013
(in thousands)
Segment Adjusted EBITDA
Crude oil pipelines and storage 20,159$ 13,353$
Crude oil supply and logistics 9,185 14,686
Refined products terminals and storage 10,723 16,100
NGLs distribution and sales 15,525 15,518
Discontinued operations 983 2,023
Corporate and other (24,924) (27,396)
Total Adjusted EBITDA 31,651 34,284
Depreciation and amortization (42,488) (33,345)
Interest expense (9,393) (9,075)
Loss on extinguishment of debt (1,634) -
Income taxbenefit (expense) (300) (208)
Loss on disposal of assets, net (1,366) (1,492)
Unit-based compensation (1,877) (948)
Total gain (loss) on commodity derivatives (13,762) 902
Net cash (receipts) payments for commodity derivatives settled during the period 1,071 209
Discontinued operations (10,591) (3,205)
Non-cash inventory LCM adjustment (222) -
Transaction costs and other non-cash items (4,112) (1,343)
Net loss (53,023)$ (14,221)$
Twelve months endedDecember 31,

Jpep march investor presentation

  • 1.
  • 2.
    Disclaimers 2 This presentation containsforward-looking statements. These statements discuss future expectations, contain projections of results of operations or of financial condition or state other forward-looking information. These statements are based upon various assumptions, many of which are based, in turn, upon further assumptions, including examination of historical operating trends made by the management of JP Energy Partners LP (the “Partnership” or “JPE”). Although the Partnership believes that these assumptions were reasonable when made, because assumptions are inherently subject to significant uncertainties and contingencies, which are difficult or impossible to predict and are beyond its control, the Partnership cannot give assurance that it will achieve or accomplish these expectations, beliefs or intentions. These forward-looking statements involve risks and uncertainties. When considering these forward- looking statements, you should keep in mind the risk factors and other cautionary statements in the filings made by the Partnership with the Securities and Exchange Commission (the “SEC”), copies of which are available to the public. The risk factors and other factors noted in the Partnership’s filings with the SEC could cause the Partnership’s actual results to differ materially from those contained in any forward-looking statement. The Partnership expressly disclaims any intention or obligation to revise or publicly update any forward-looking statements, whether as a result of new information, future events or otherwise. Forward Looking Statements Non-GAAP Measures This document includes certain non-GAAP financial measures as defined under SEC Regulation G. A reconciliation of those measures to most directly comparable GAAP measures is provided in the appendix to this presentation. Adjusted EBITDA is defined as net income (loss) plus (minus) interest expense (income), income tax expense (benefit), depreciation and amortization expense, asset impairments, (gains) losses on asset sales, certain non-cash charges such as non-cash compensation and non-cash vacation expense, non-cash (gains) losses on commodity derivative contracts (total (gain) loss on commodity derivatives less net cash flow associated with commodity derivatives settled during the period) and selected (gains) charges and transaction costs that are unusual or non-recurring and other selected items that impact comparability.
  • 3.
    JP Energy PartnersLP (JPEP) Overview 3 • NYSE Listed: JPEP • Formed in May 2010; IPO in October 2014 • JPEP is a publicly traded, diversified master limited partnership with operations including: • Crude Oil Pipelines and Storage • Refined Products Terminals and Storage • NGL Distribution and Sales • Crude Oil Supply and Logistics • JPEP Trading Summary (1) • Unit Price: $14.53 • Units Outstanding: 36.4mm • Market Cap: $529mm • Current Yield: 8.9% ___________________________ 1. As of February 27, 2015 close. Assumes $1.30 annual distribution.
  • 4.
    Well Positioned for2015 and Beyond 4 Solid Position in Active Basins Fully Integrated Solution Solid Financial Position • Network of midstream assets in core of Midland Basin • Eagle Ford position capitalizes on strong fundamentals, drilling activity • Mississippian Lime, Granite Wash provide drop-down potential • Manage physical movement of petroleum products from origination to destination • Four complimentary business segments connecting upstream to downstream • Natural hedge to seasonality and commodity price changes • Large percentage of fee- based business • Low commodity price sensitivity • Strong balance sheet • Strong sponsor with drop-down opportunities Enables Long-Term Growth • Initiate drop-downs • Execute on backlog of organic growth opportunities • Pursue potential acquisitions • Execute pipeline expansions
  • 5.
  • 6.
    Cylinder Exchange (National) Geographically DiversifiedMidstream Platform 6 Crude Oil Pipelines and Storage Crude Oil Supply and Logistics Refined Products Terminals and Storage NGL Sales, NGL Transportation
  • 7.
    Diversified Offering FromUpstream to Downstream Integrated logistics solutions from the wellhead to the end-user Crude Oil Producers Refiners Truck Pipeline Gathering Injection Station Pipeline Terminal/Storage/ Exchange Location Pipeline Refined ProductsNatural Gas Liquids Refineries OFS and Agriculture Gas Stations Barge Common Carrier Pipelines Tanker Storage Rail Diluent for Heavy Crude Producers Refinery Produced LPG Spec Products Retail Distributor Storage 7
  • 8.
    8 Growing, Fee-Based CashFlows with High Quality Customer Base  Refined Products Terminals and Storage – Fixed fees for throughput and storage – Fixed fees for blending services, injection of additives and ancillary services, including product handling and transfer services – Rollup strategy and optimization  NGL Distribution and Sales – Recent acquisition of NGL truck services from JP Development with fixed fees based on distance and volume transported  Crude Oil Pipelines and Storage – Fixed storage and throughput or minimum volume commitment fees – Growing volumes in the Southern Wolfcamp from existing contracted producers with long-term fee-based commitments – Pursuing additional customer acreage and MVC within JP Energy’s capture area – Expansion of Silver Dollar Pipeline  Crude Oil Supply and Logistics – Crude oil trucking and “fee equivalent” lease gathering FocusedonGrowingFee-basedCashFlows NGL Distribution and Sales Refined Products Terminals and Storage Crude Oil Pipelines & Storage 2014 Adjusted EBITDA Mix NGL Distribution and Sales 28% Refined Products Terminals and Storage 19% Crude Oil Pipeline and Storage 36% Crude Oil Supply and Logistics 17%
  • 9.
    Refined Products Terminalsand Storage Growth • Storage capacity of approximately 770,000 barrels from 10 tanks • Primarily supplied by the Explorer Pipeline • We own approximately six acres which can be used for future expansion (~200,000 barrels additional storage capacity) • Average throughput of ~19,500 barrels per day (1) Caddo Mills, Texas (Dallas) Terminals in Large Metropolitan Areas 9 • Storage capacity of approximately 550,000 barrels from 11 tanks • Supplied by the pipeline operated by Enterprise’s Teppco Products Pipeline • Eight loading lanes with automated truck loading equipment to minimize wait time • Average throughput of approximately ~44,400 barrels per day (1) North Little Rock, Arkansas Provides steady, predictable cash flow with minimal maintenance capital expenditures and fee-based revenues ___________________________ 1. For year ended December 31, 2014.
  • 10.
    -50% -40% -30% -20% -10% 0% 10% 20% 30% 40% 50% Jan-87 Sep-87 May-88 Jan-89 Sep-89 May-90 Jan-91 Sep-91 May-92 Jan-93 Sep-93 May-94 Jan-95 Sep-95 May-96 Jan-97 Sep-97 May-98 Jan-99 Sep-99 May-00 Jan-01 Sep-01 May-02 Jan-03 Sep-03 May-04 Jan-05 Sep-05 May-06 Jan-07 Sep-07 May-08 Jan-09 Sep-09 May-10 Jan-11 Sep-11 May-12 Jan-13 Sep-13 May-14 Avg U.S TotalGasoline Sales by Refiner YoY Change Average YoY Price Change • Revenues driven by product throughput • Lower commodity price stimulates demand (graph below) • Storage opportunity as forward curve is entering contango • Adding butane blending at our North Little Rock facility • Strategic relationship with national customers Refined Products Terminals Economics 10 Overview Gasoline Consumption Inversely Correlated to Gasoline Prices (YoY Change in Consumption vs. Price)(1) Consistent Throughput ___________________________ 1. EIA Data. Final figure is for the month of December the latest available EIA data. 0 1,000 2,000 3,000 4,000 5,000 6,000 7,000 8,000 1Q13 2Q13 3Q13 4Q13 1Q14 2Q14 3Q14 4Q14 Throughput (bbls 000s)
  • 11.
    0 10,000 20,000 30,000 40,000 50,000 60,000 Jan-13 Mar-13 May-13 Jul-13 Sep-13 Nov-13 Jan-14 Mar-14 May-14 Jul-14 Sep-14 Nov-14 Jan-15 Crude Oil Storage 11 JPEnergy Partners’ crude oil storage facility is located in Cushing, Oklahoma, a key hub connecting production to the Gulf Coast Asset Highlights • Focused on operational storage with largest tanks in Cushing for large crude movements or storage options (~3mm barrels aggregate shell capacity) • Inbound connections with multiple pipelines and two-way interconnections with all the major storage facilities in Cushing • Annuity-like, stable, fee-based cash flow priced off capacity under long term contracts (~3yrs remaining) • Expect increased demand from recent changes in crude oil spot and futures prices • The WTI forward curve has shifted from backwardation to contango, making it more economical to store Recent Market Impact- Entering Contango(2) Consistent, Fee Based Adjusted Crude Oil Storage EBITDA(1) EIA Cushing Storage Volumes ___________________________ 1. 4Q14 EBITDA excluding unusual items. 2. NYMEX Crude Oil WTI (CL) curve as of February 27, 2015. 1Q13 2Q13 3Q13 4Q13 1Q14 2Q14 3Q14 4Q14 Unusual Items $45 $50 $55 $60 $65 $70 $75 $80 $85 $90 $95 Mar-15 Jun-15 Sep-15 Dec-15 Mar-16 Jun-16 Sep-16 Dec-16 Mar-17 Jun-17 Sep-17 Dec-17 Mar-18 Jun-18 Sep-18 Dec-18 Crude Oil WTI ($/bbl) Futures Curve by Expiry Date Current One Year Ago
  • 12.
    NGL Distribution andSales 12 Limited Gross Margin Seasonality (2)Overview(1) • NGL Distribution and Sales / NGL Transportation • Target growing demand for power generation and oilfield service applications providing stable cash flows throughout the year • Fixed fee business primarily in the Eagle Ford and Permian • Cylinder Exchange • 3rd largest propane cylinder exchange business in the U.S. • Established footprint in 48 states with a network of ~19,500 customer locations • National footprint gives us capability to compete for large volume national accounts and provide us with economies of scale and significant cost savings • Maintain flexible market pricing to allow for margin optimization • Improve logistics and create synergies • Leverage scale by using freight and supply point optimization • Execute on organic growth by entering new major markets, and expanding customer and other strategic relationships • Evaluation of new services / geographies • Industrial services • Continue to expand in the Western U.S. Growth Opportunities NGL Operations Cylinder Exchange Footprint Recent Expansion Pinnacle Location PPE Central Ops PPE Depots PPE Production___________________________ 1. Cylinder Exchange location count of ~19,500 is as of January 31, 2015. 2. Adjusted gross margin and volumes are for Pinnacle Propane and Pinnacle Propane Express and exclude JP Liquids Transportation. 1Q13 2Q13 3Q13 4Q13 1Q14 2Q14 3Q14 4Q14 Propane Volume Adjusted Gross Margin
  • 13.
    NGL Distribution andSales Economics 13 Overview • Two primary businesses reduce seasonality • Propane Sales and Distribution business is winter weighted, although decreasing seasonality due to growth in industrial and oilfield services • Propane Cylinder Exchange business is summer weighted • Margins tend to expand as commodity prices fall • Longer dated sales contracts Limited Seasonality (1) ___________________________ 1. Based on adjusted gross margin for the year ended December 31, 2014. Winter includes three months ending March 31, 2014 and December 31, 2014 , and summer includes the three months ending June 30, 2014 and September 30, 2014. 2. NYMEX Propane Non-LDH Mt. Belvieu (OPIS) front month and NYMEX WTI Front Month through February 27, 2015. Mt. Belvieu ($/gal) Correlated With NYMEX WTI ($/bbl)(2) Winter, 54%Summer, 46% $0 $20 $40 $60 $80 $100 $120 $0.00 $0.20 $0.40 $0.60 $0.80 $1.00 $1.20 $1.40 $1.60 $1.80 9/26/13 10/26/13 11/26/13 12/26/13 1/26/14 2/26/14 3/26/14 4/26/14 5/26/14 6/26/14 7/26/14 8/26/14 9/26/14 10/26/14 11/26/14 12/26/14 1/26/15 2/26/15 NYMEX Propane Mt. Belvieu (OPIS) WTI NYMEX
  • 14.
    Silver Dollar Anchoredby Active Producers and Provides Access to Multiple End-Markets JP Energy Partners’ crude oil pipeline system is base loaded by two customers with over 300,000 contiguous acres in the Permian Basin 14 ~5 years remaining on minimum volume commitment ~9 years remaining with 110,000 acre dedication Major Customer A Major Customer B 10 years with 53,000 acreage dedication Major Customer C
  • 15.
    10,000 12,000 14,000 16,000 18,000 20,000 22,000 24,000 26,000 4Q13 1Q14 2Q143Q14 4Q14 Pipeline Volumes (Barrels Per Day) Silver Dollar Pipeline Continuing To Grow 15 Overview • Volume growth from the core of the Permian continues in current oil price environment • Connection to Cline Shale immediately expanded system capacity • Customers remain committed to developing Permian acreage • Most stated break-evens look to be in the high $40s • Area producers expect year over year growth despite declining rig counts • Substantial optionality with three connections • Oxy Cline Shale • Plains Owens • Signed connection agreement for third takeaway option • Trucking stations create synergies with Crude Oil Supply and Logistics segment • Increases capture area of the system Volume Growth Accelerating Cline Shale Connection
  • 16.
    Silver Dollar PipelineReagan County Expansion 16 Project Overview • Recently announced the expansion of the Silver Dollar pipeline north into Reagan and Glasscock Counties • Expansion is base loaded by a 53,000 acre 10yr dedication • Approximately 55 miles of pipeline with expected completion date in the second half of 2015 • Estimated capital cost of approximately $36mm Planned Expansion Planned Expansion Strategic and Financial Rationale • Strategic Rationale • Expands the Silver Dollar Pipeline capture area into the core of the Midland basin • New customer opportunities • Deploys breadth of midstream capabilities for producer (pipeline, trucking, marketing) • Financial Rationale • Accretive project assuming only base load • Additional upside from new customers • Initially funded using revolving credit facility
  • 17.
    17 Gathering Systems Inthe Lowest Cost Crude Oil Basins Core Assets in the Permian (Silver Dollar) and Eagle Ford (Republic Midstream ROFO)(1)(2) ___________________________ 1. Rounded Breakeven Estimates based on UBS research dated October 14, 2014. 2. JP Energy Partners has a ROFO for a 50% interest in Republic Midstream. JP Energy Focus Areas
  • 18.
  • 19.
    Fee Based, 48% FixedMargin, 10% Variable Margin, 42% Fee Based, 47% Fixed Margin, 3% Variable Margin, 49% Stable Cash Flows Business 19 2014 Adjusted EBITDA Mix(1) ___________________________ 1. Based on Adjusted EBITDA for the year ended December 31, 2014. 2. Based on planned Adjusted EBITDA for the year ended December 31, 2015. Contract Description Crude Oil Pipelines & Storage • Pipeline throughput fees • Crude Oil Storage fees Refined Products Terminals • Throughput volume fees Crude Oil & NGL Trucking • Fee based trucking for third parties Fixed Margin NGL Fixed Margin Product Sales • NGL sales under fixed price contracts that are financially hedged Crude Oil and NGL Supply & Logistics • Typically back to back transactions at index- based prices creating fee equivalent gross margin NGL Variable Margin Product Sales • NGL sales at market prices Refined Products Sales • Product sales that vary with market prices FeeBasedVariableMargin 2015 Plan Adjusted EBITDA Mix(2)
  • 20.
    Lease Gathering Isa “Fee-Equivalent” Activity Essential Service Provides Durable Baseline Cash Flow in a Variety of Markets Wellhead Price Trucking Costs Pipeline Tariff G&A Cost Total Cost(1) Sales Price Margin Price $52.30 $1.00 $0.50 $0.20 $54.00 $55.00 $1.00 Cost Known      Margin Locked? NYMEX less location/ quality differential Projected from historical costs Tariff is posted Projected from historical costs NYMEX price Production Area JPEP Market Hub Pipeline Terminal Index-Based Margin is set at purchase through back-to-back purchase and sale transactions + + =+ 20___________________________ Note: Values provided for illustration purposes only.
  • 21.
  • 22.
    JP Energy FamilyOverview 22 JP Energy Partners has a strategic partnership with JP Development and Republic Midstream JP Development • Founded in July 2012 to support JP Energy’s growth • JP Development projects may be dropped down to us – In February 2014, we completed our first drop down valued at $319 million • JP Development has extended us a right of first offer (ROFO) for the five year following the IPO on all of JP Development’s current and future assets JP Energy Partners • Founded in May 2010 to own, operate, develop and acquire a diversified portfolio of midstream energy assets • Operations currently consist of four business segments: – Crude Oil Pipelines and Storage – Crude Oil Supply and Logistics – Refined Products Terminals and Storage – NGL Distribution and Sales Republic Midstream • Formed with $400 million commitment from ArcLight to design, build and operate a crude gathering system for Penn Virginia in the Eagle Ford shale – Managed by JPEP and American Midstream – JPEP has a ROFO for 18 months following the IPO for a 50% interest in the joint venture
  • 23.
    Permian North Barnett Combo Play Eagle Ford Mississippian Lime Granite WashWoodford Woodford Woodford-SCOOP Management & ArcLight have created near term drop-down opportunities Crude Oil Drop-Down Opportunities • ArcLight has demonstrated the ability to invest broadly and profitably across the energy industry • ArcLight has a substantial equity commitment to JP Energy Partners / JP Development • Right of First Offer with JP Development & Republic Midstream ArcLight Sponsorship 23 Great Salt Plains Pipeline • ~115 mile crude oil pipeline • Transports Mississippian Lime supply to Cushing, Oklahoma • Ability to expand capacity from 27 Mbbls/d to 40 Mbbls/d Red River Pipeline • ~75 mile crude oil pipeline that transports oil from N. Texas to Garvin City, Oklahoma • Current capacity of 5 Mbbls/d Republic Midstream • 180-mile crude oil gathering system in Gonzales & Lavaca counties, Texas • Central delivery point (“CDP”) with storage and blending capacity • 30-mile takeaway pipeline Potential Drop-Downs
  • 24.
  • 25.
    Available Liquidity ($mm)(1) ConservativeBalance Sheet 25 Balance Sheet Management ___________________________ 1. As of February 27, 2015. Availability based on $275mm of commitments. • Two major focuses for conservative balance sheet management • Maintain considerable excess liquidity • $160mm as of February 27th, 2015 • Target leverage lower than peer group • <3.5x EBITDA target • IPO proceeds were used to delever the balance sheet Cost Control • Focused on disciplined growth capital expenditures • Spending on only the highest return and most strategically significant projects • Continuing to review the cost structure • Targeting best practices • Revisiting current processes • Reviewing G&A expenses following acquisition activity Credit Facility Borrowings, $107 Outstanding Letters of Credit, $19 Unrestricted Cash, $11 Unused Credit Facility Capacity, $149
  • 26.
    Financial Strategy 26  Longterm contracts for our crude oil pipelines  Refined products and NGL segments offer diversification in mature markets but with considerable growth opportunities  Near-term organic growth projects already being pursued in existing businesses  Strategic drop-downs from JP Development and Republic Midstream could further bolster growth  Remain open to acquisition opportunities that are strategic to the platform  Revolver has ~$149 million in availability  Target 3.5x leverage over the long-term  Established risk management policies and procedures to monitor and manage the market risks associated with commodity prices, counterparty credit and interest rates  Commodity price exposure is minimized through fixed-fee contracts or margin-based arrangements Maintain Stable Cash Flows Comprehensive Risk Management Commitment to Financial Flexibility Deliver Consistent Distribution Growth
  • 27.
    Summary 27  Four uniquebut complementary business segments connecting upstream supply to downstream demand  Opportunity to seek further value chain integration  Diverse business mix provides natural hedge to seasonality and commodity price swings  JP Energy Partners and JP Energy Development Company have strategically developed and acquired assets in the most profitable basins in North America  Truck locations managed dynamically to optimize returns of Crude Oil Supply and Logistics and Crude Oil Pipelines segment  Limited direct commodity price exposure  58% fee or fixed margin planned 2015 Adjusted EBITDA  Owns over 50% of the LP units and approximately 71% of the GP  Experienced sponsor that is active in the market  Actively seeking to expand drop-down inventory  Focused on financially responsible and conservative growth and cost containment  Revolver has ~$149 million in availability  Target 3.5x leverage over the long-term Conservative Balance Sheet Stable Cash Flows Diversified Business Strategically Located Crude Assets Strong Equity Sponsorship
  • 28.
  • 29.
    Non-GAAP Reconciliation –Adjusted EBITDA 29 2014 2013 (in thousands) Segment Adjusted EBITDA Crude oil pipelines and storage 20,159$ 13,353$ Crude oil supply and logistics 9,185 14,686 Refined products terminals and storage 10,723 16,100 NGLs distribution and sales 15,525 15,518 Discontinued operations 983 2,023 Corporate and other (24,924) (27,396) Total Adjusted EBITDA 31,651 34,284 Depreciation and amortization (42,488) (33,345) Interest expense (9,393) (9,075) Loss on extinguishment of debt (1,634) - Income taxbenefit (expense) (300) (208) Loss on disposal of assets, net (1,366) (1,492) Unit-based compensation (1,877) (948) Total gain (loss) on commodity derivatives (13,762) 902 Net cash (receipts) payments for commodity derivatives settled during the period 1,071 209 Discontinued operations (10,591) (3,205) Non-cash inventory LCM adjustment (222) - Transaction costs and other non-cash items (4,112) (1,343) Net loss (53,023)$ (14,221)$ Twelve months endedDecember 31,